Method for displaying gene experiment data

Inactive Publication Date: 2006-03-07
HITACHI LTD
View PDF2 Cites 1 Cited by
  • Summary
  • Abstract
  • Description
  • Claims
  • Application Information

AI Technical Summary

Benefits of technology

[0023]According to the present invention, experiment data of expressions of a plurality of genes can be displa

Problems solved by technology

Therefore, a displaying method that is limited to two types of samples is not always satisfactory.
However, even when the two displays like one shown in FIG. 3 are placed side by side, it is hard to understand the states of gene expressions of these three cells by a brief look.
Howe

Method used


Image

  • Method for displaying gene experiment data
  • Method for displaying gene experiment data
  • Method for displaying gene experiment data

Examples


Embodiment Construction

[0037]Hereinafter, embodiments of the present invention will be described with reference to the drawings.

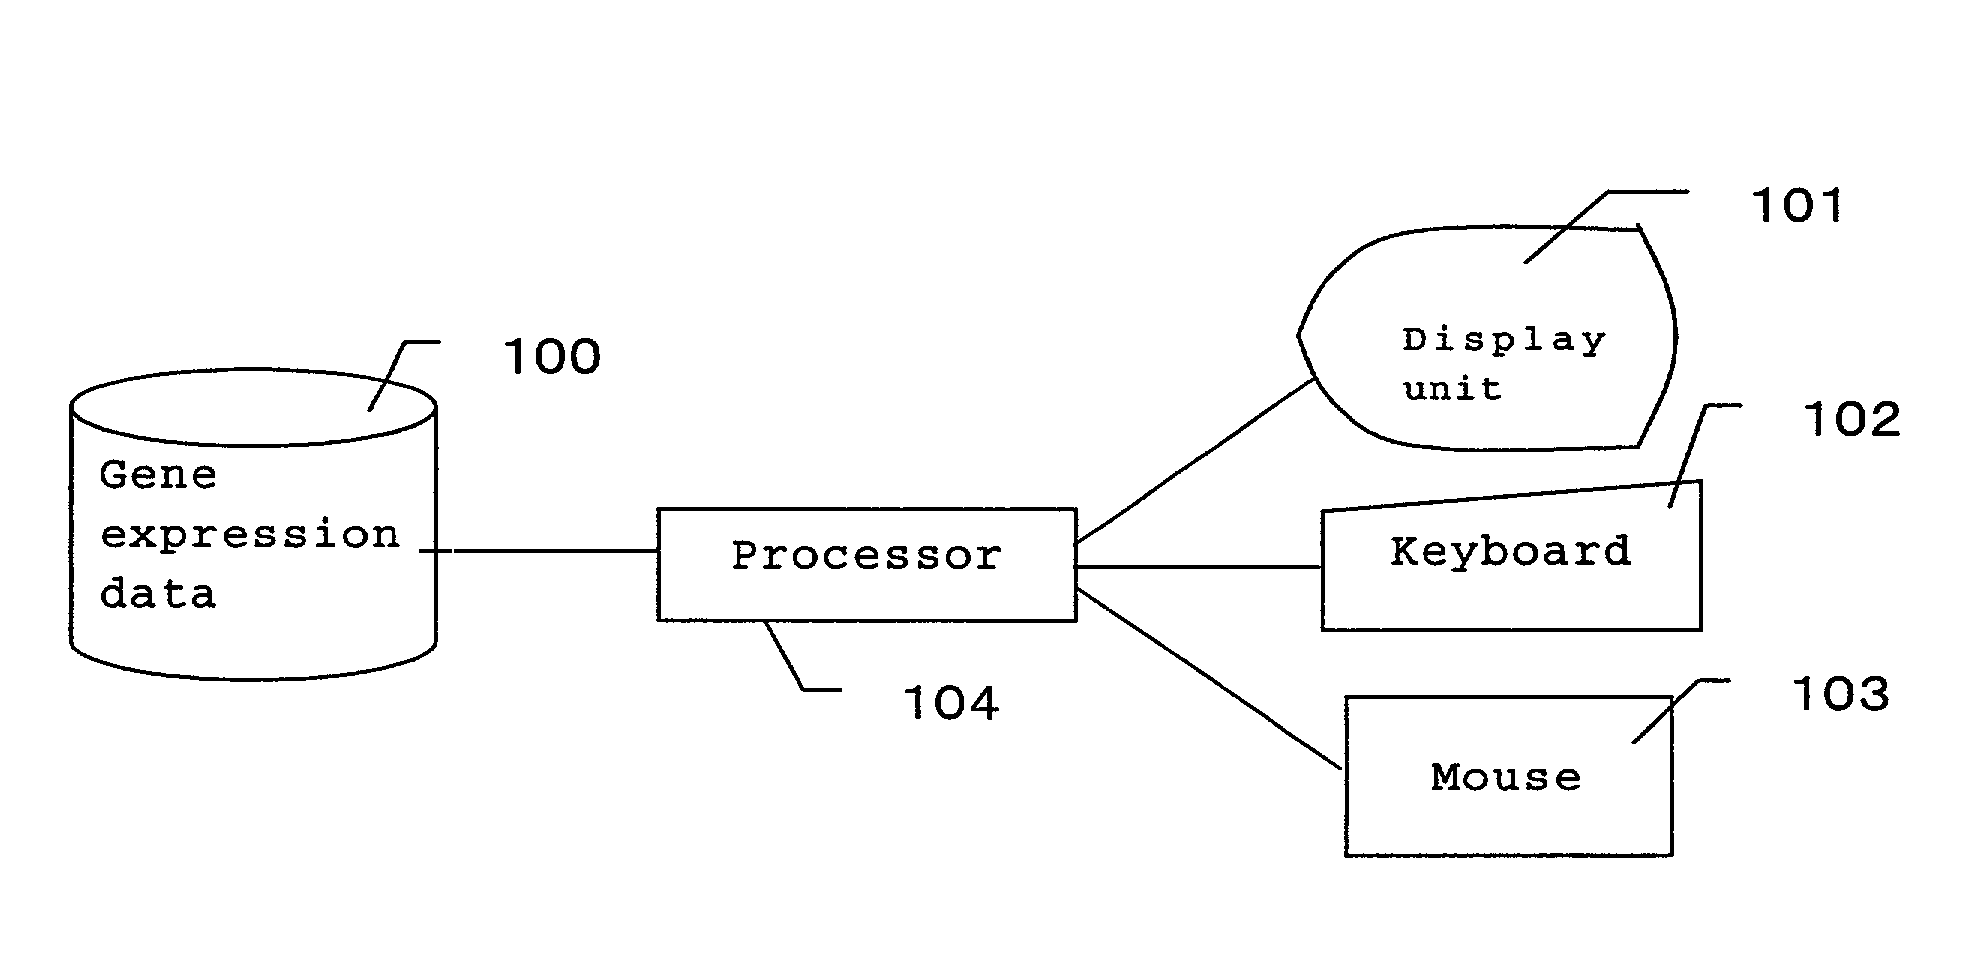
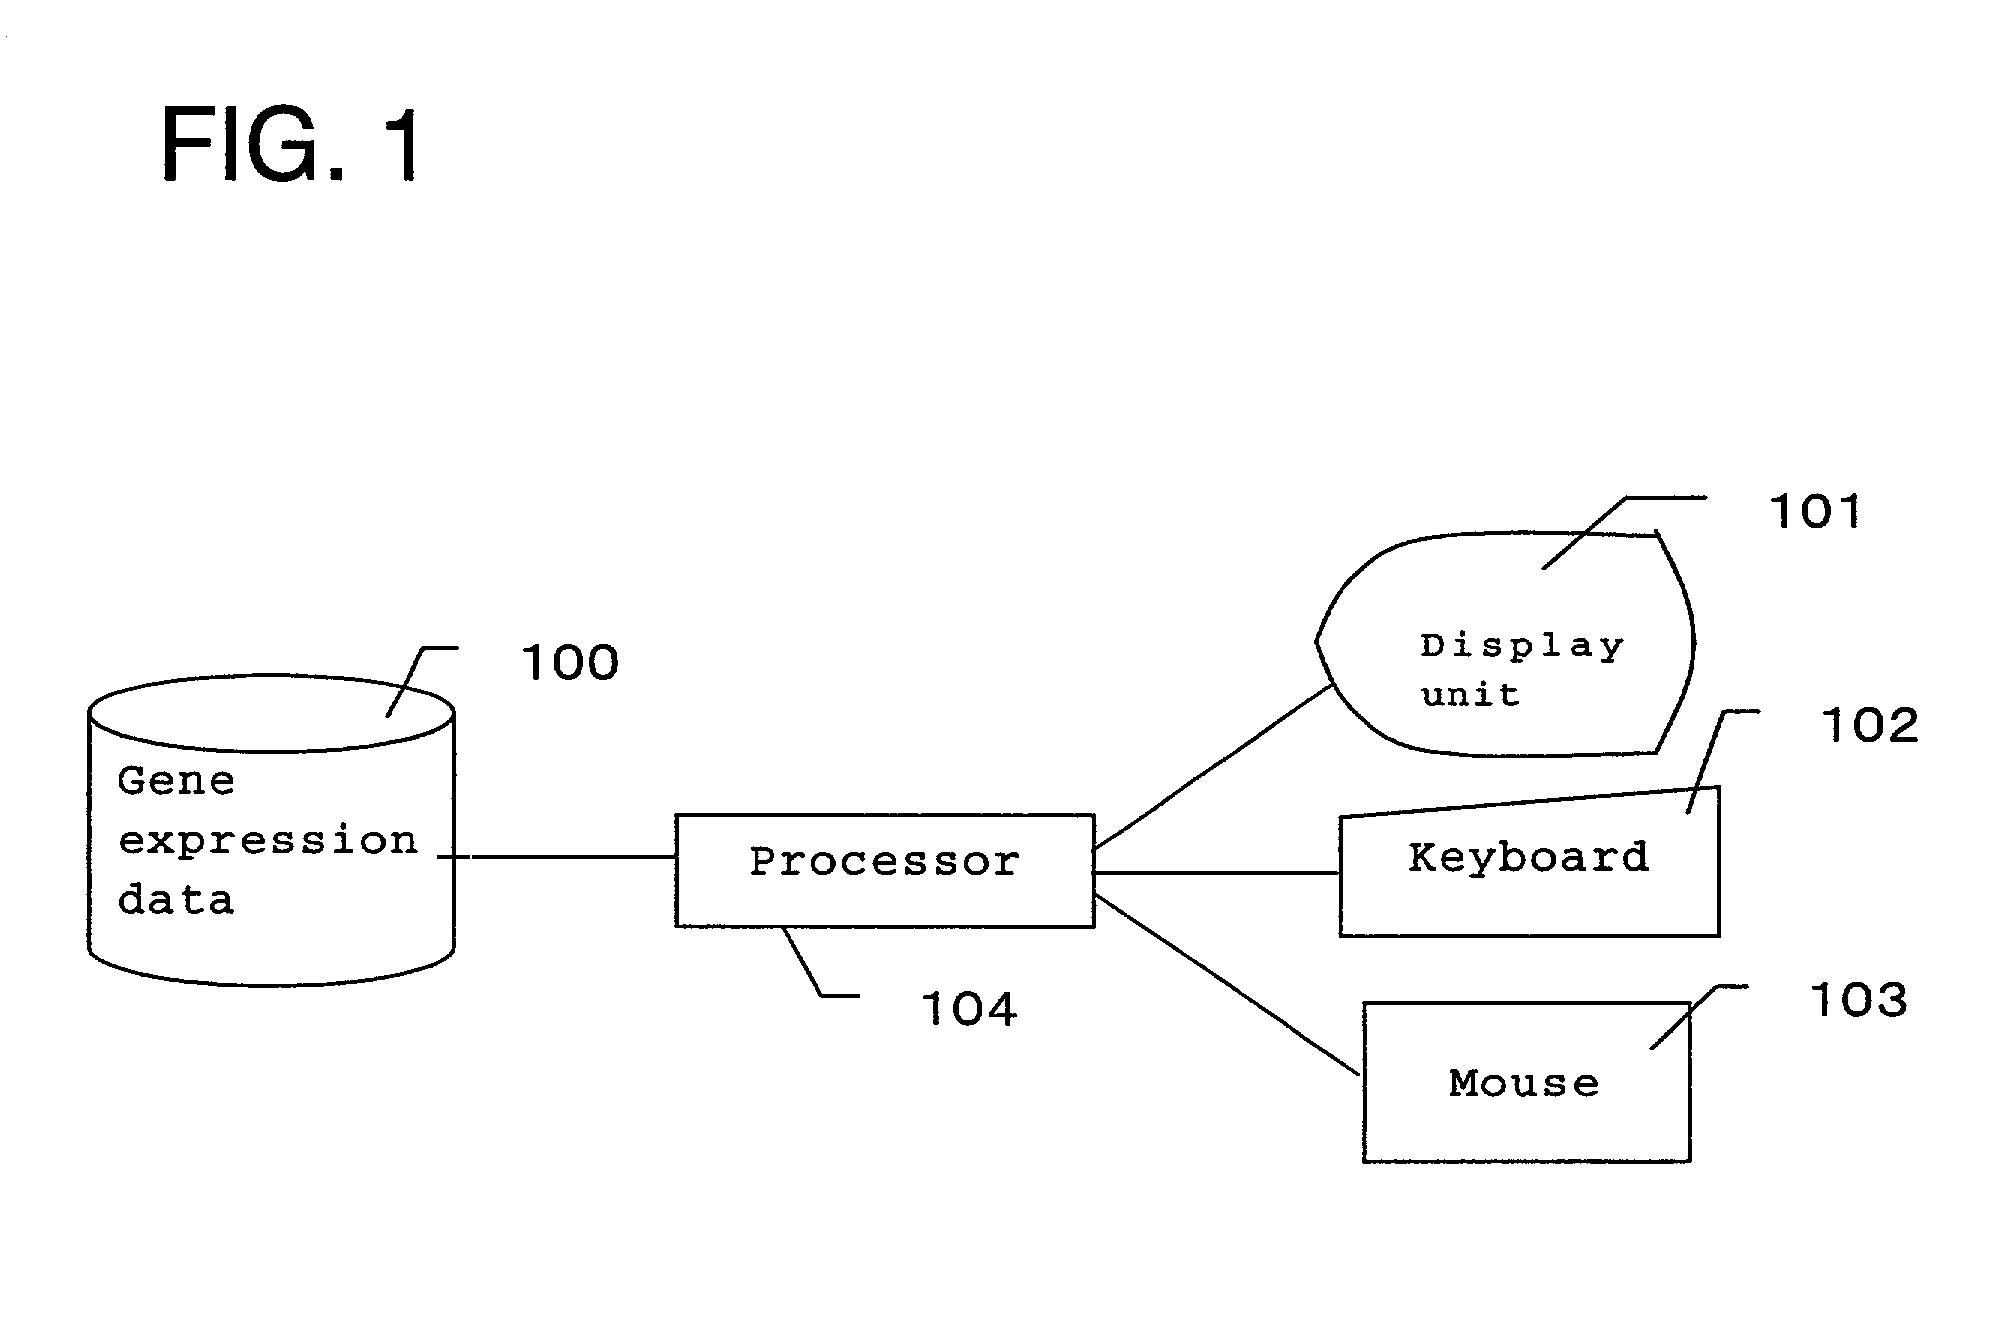
[0038]FIG. 1 is a schematic view showing a configuration of a system of the present invention. The system of the invention is provided with gene expression data 100 for storing numerically-expressed gene expressions levels in a series of cell process, a display unit 101 for visualizing and displaying the expression data, inputting devices such as a keyboard 102 and a mouse 103 for inputting values into the system and for selection, and a processor 104 for performing clustering of the expression data or the like with respect to the expression level of the gene.

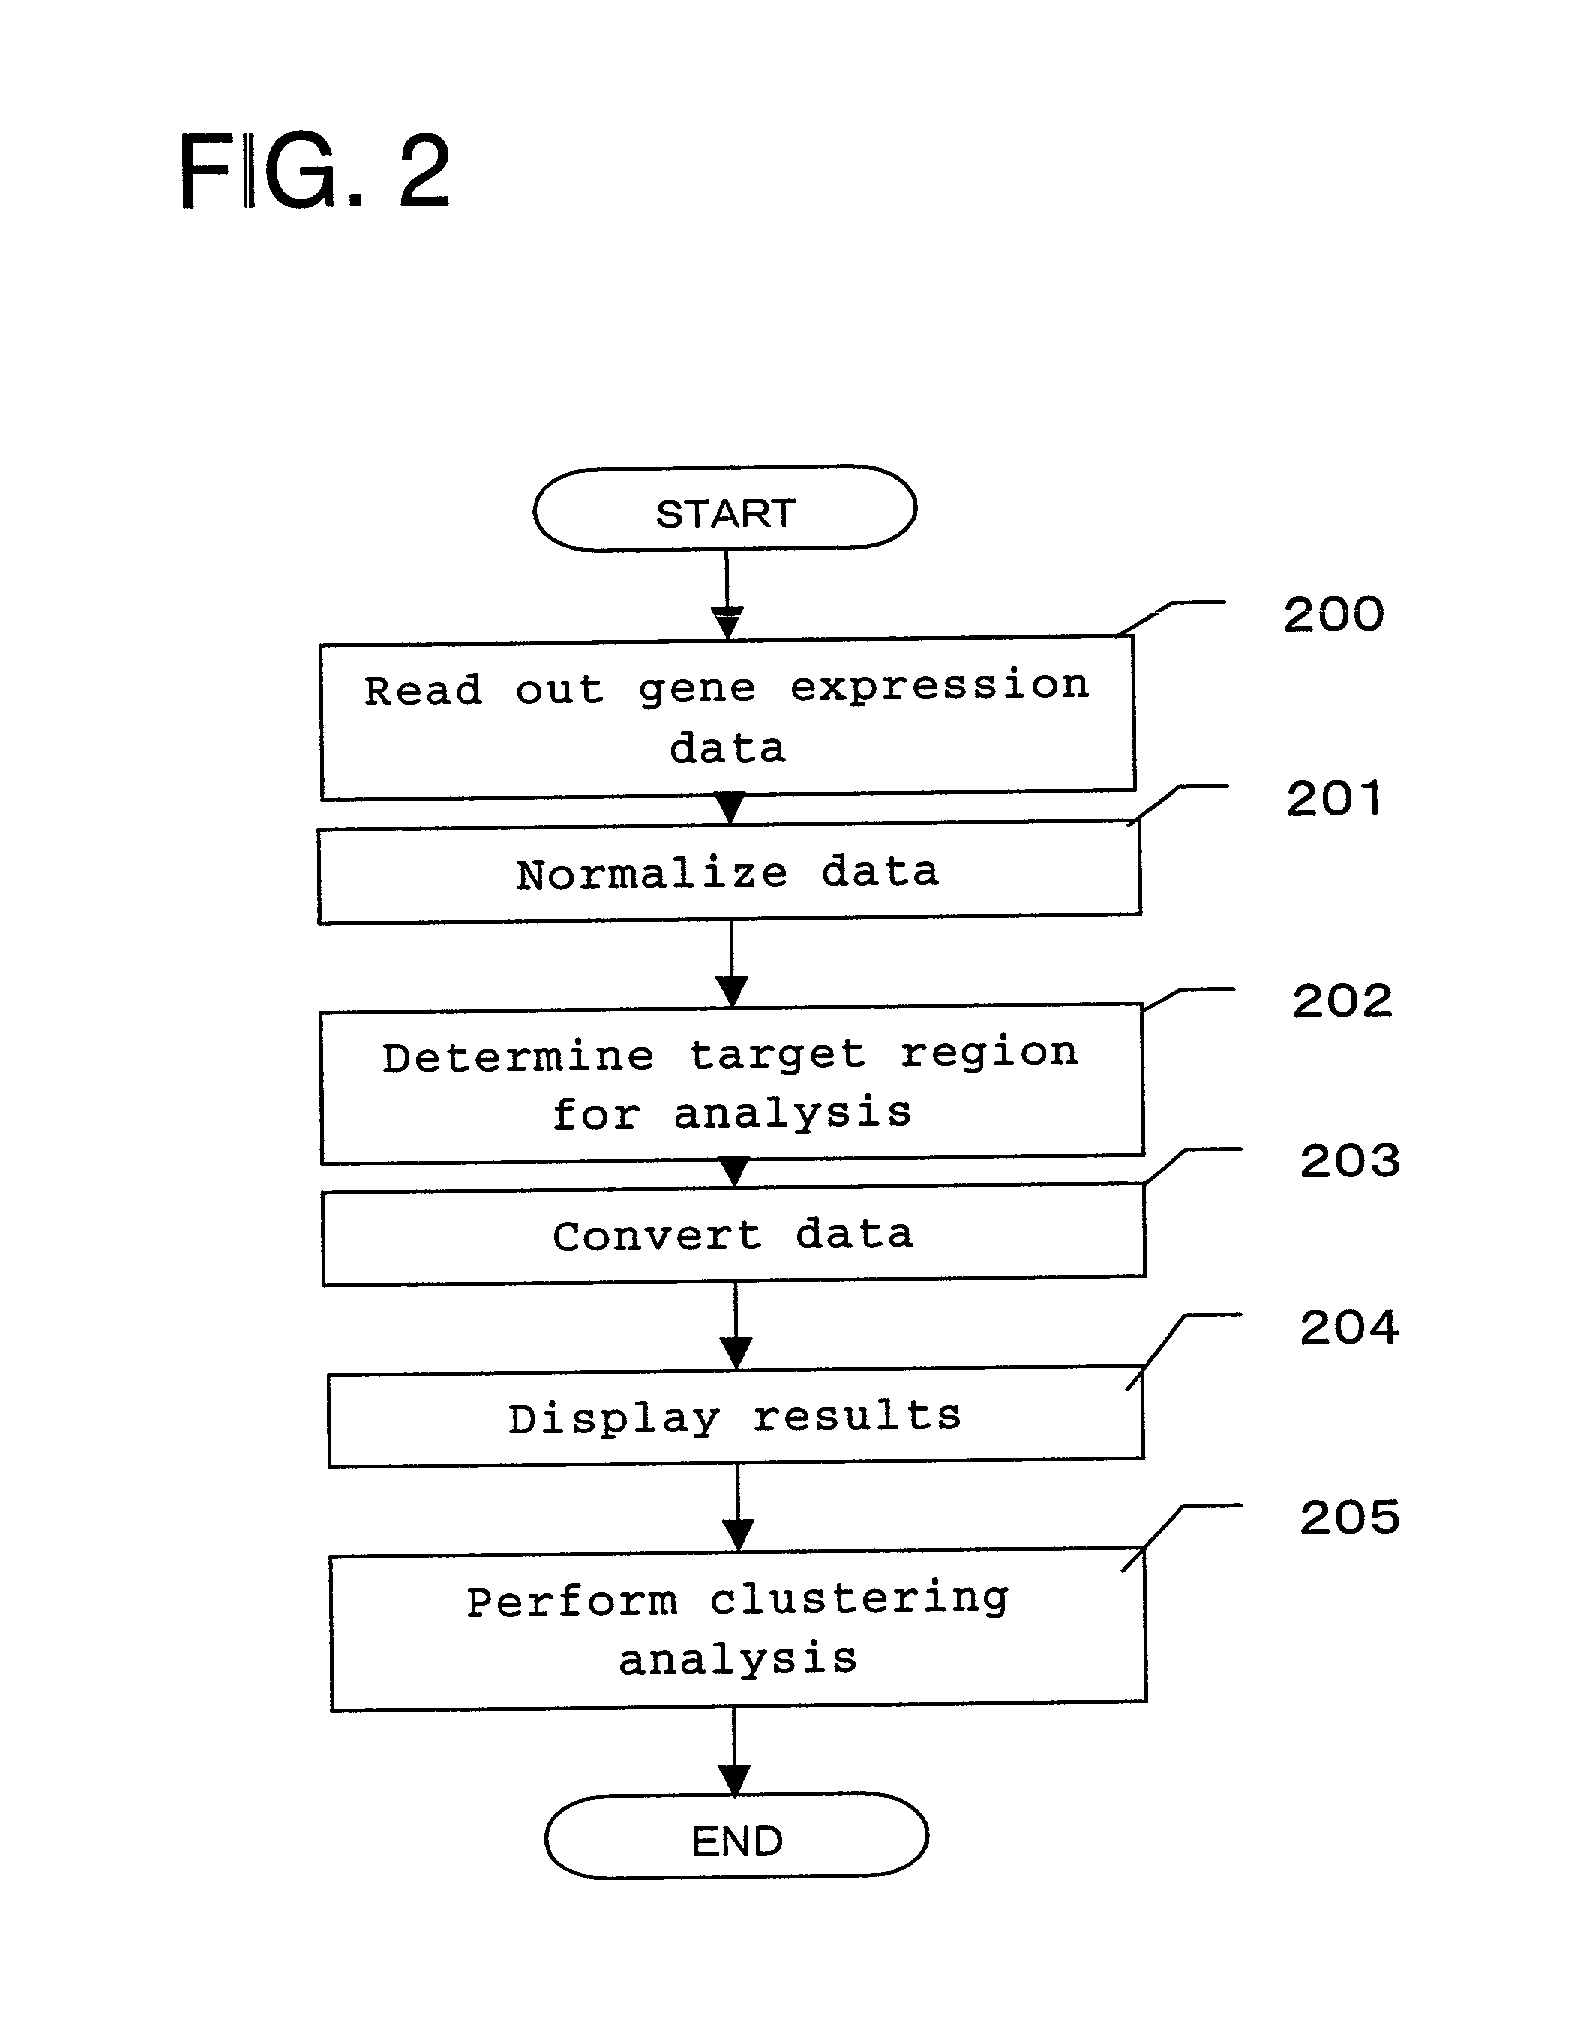
[0039]FIG. 2 is a flowchart showing general processes of a gene experiment data displaying method according to the present invention. Hereinafter, the processes will be described by following this flowchart.

[0040]First, data is read out from the gene expression data 100 and input into the processor 104 (Step 200). FIG. 5 sho...


PUM

PropertyMeasurementUnit
Ratioaaaaaaaaaa
Gene expression profileaaaaaaaaaa
Levelaaaaaaaaaa

Abstract

The present invention aims at providing a visual display which is useful in roughly understanding the state of groupings and changes, by comparing expression data of genes from two experiments based on expression data of one sample common to both experiments.
In order to compare data of expression levels obtained from different experiments each using two types of samples, three types of expression levels are displayed in three-dimension as mediated by the data of the common sample used in both experiments. Specifically, expression level data for Samples A and B and expression level data for Samples A and C are combined and converted into single three-dimensional data and displayed as points inside a sphere. Alternatively, expression states of each gene to Samples A, B and C are mapped on a sphere with respect to a ratio between Sample A and Sample B and a ratio between Samples A and C, and displayed as distribution on the surface of the sphere. A clustering analysis is performed based on the distributed points inside or on the sphere, to visually understand the expression state of genes for the three types of samples. In addition, the expression level data displayed as points inside or on the sphere are linked as a line or a curve for each gene or for each gene group resulting from the clustering analysis, to visually understand the changes of expression states with time.

Description

FIELD OF THE INVENTION[0001]The present invention relates to a method for displaying gene expression data obtained from two types of experiments by hybridization with particular genes, in a visually understandable manner to aid prediction of a function and a role of the gene.BACKGROUND OF THE INVENTION[0002]With the increase in the number of species that have been determined of their genome sequences, so called genome comparison has extensively been performed. Genome comparison aims at finding facts based on gene differences among species, for example, finding genes involved in evolution, finding a collection of genes which are considered to be common to all species, or, on the other hand, studying the nature unique to specific species. The recent development of infrastructures such as biochips (DNA chips) and DNA microarrays has changed the interest in the art of molecular biology from information of interspecies to information of intraspecies, namely coexpression analysis, and bro...

Claims


Application Information

Patent Timeline
IPC IPC(8): G06F17/11G06G7/58G06N7/00G01N33/53C12N15/09C12Q1/68G01N37/00G06F19/00G16B25/10G16B40/00G16B45/00
CPCG06F19/26G06F19/20G06F19/24G16B25/00G16B40/00G16B45/00G16B25/10
Inventor NAKASHIGE, RYONOZAKI, YASUYUKITAMURA, TAKUROWATANABE, TSUNEHIKO
Owner HITACHI LTD
Why Eureka
Try Eureka