Acoustic source localization system and method

a technology of acoustic source and localization method, which is applied in the field of determining the location of acoustic sources, can solve the problems of insufficient resolution of the direction of an acoustic source, inability to accurately determine the direction of the source, and inability to achieve the robustness of the cone-intersection method, etc., and achieves the effect of avoiding significant errors in the calculation of tdes from the peak of a correlation function

Inactive Publication Date: 2006-05-02
QUINDI
View PDF11 Cites 26 Cited by
  • Summary
  • Abstract
  • Description
  • Claims
  • Application Information

AI Technical Summary

Benefits of technology

[0017]An acoustic source location technique compares the time response of acoustic signals reaching the two microphones of each of two or more pairs of spaced-apart microphones. For each pair of microphones, a plurality of sample elements are calculated that correspond to a ranking of possible time delay offsets for the two acoustic signals received by the pair of microphones, with each sample element having a delay time and a sample value. Each sample element is mapped to a sub-surface of potential acoustic source locations appropriate for the separation distance and orientation of the microphone pair for which the sample element was calculated and assigned the sample value. A weighted value is calculated on each cell of a common boundary surface by combining the values of the plurality of sub-surfaces proximate the cell. The weighted cells form a weighted surface with the weighted value assigned to each cell interpreted as being indicative of the likelihood that the acoustic source lies in the direction of a bearing vector passing through the cell. In one embodiment, a likely direction to the acoustic source is calculated by determining a bearing vector passing through a cell having a maximum weighted value.

Problems solved by technology

The cone of potential acoustic source locations associated with a single pair of spaced-apart microphones typically does not provide sufficient resolution of the direction to an acoustic source.
However, there are several drawbacks to the cone intersection method.
In particular, the cone-intersection method is often not as robust as desired in applications where there is substantial noise and reverberation.
However, conventional techniques to calculate TDEs from the peak of a correlation function can be susceptible to significant errors when there is substantial noise and reverberation.
Conventional techniques to calculate the cross-correlation function do not permit the effects of noise and reverberation to be completely eliminated.
However, in a typical office environment, reverberations from walls, furniture, and other objects broadens the correlation function, leading to potential errors in calculating the physical time delay from the peak of the cross-correlation function.
However, even the use of a generalized cross-correlation function does not always permit an accurate, robust determination of the TDEs used in the intersection of cones method.
However, these assumptions are not necessarily true.
The TDE of each pair of microhones is estimated from the peak of the cross-correlation function and may have a significant error if the cross-correlation function is broadened by noise and reverberation.

Method used


Image

  • Acoustic source localization system and method
  • Acoustic source localization system and method
  • Acoustic source localization system and method

Examples


Embodiment Construction

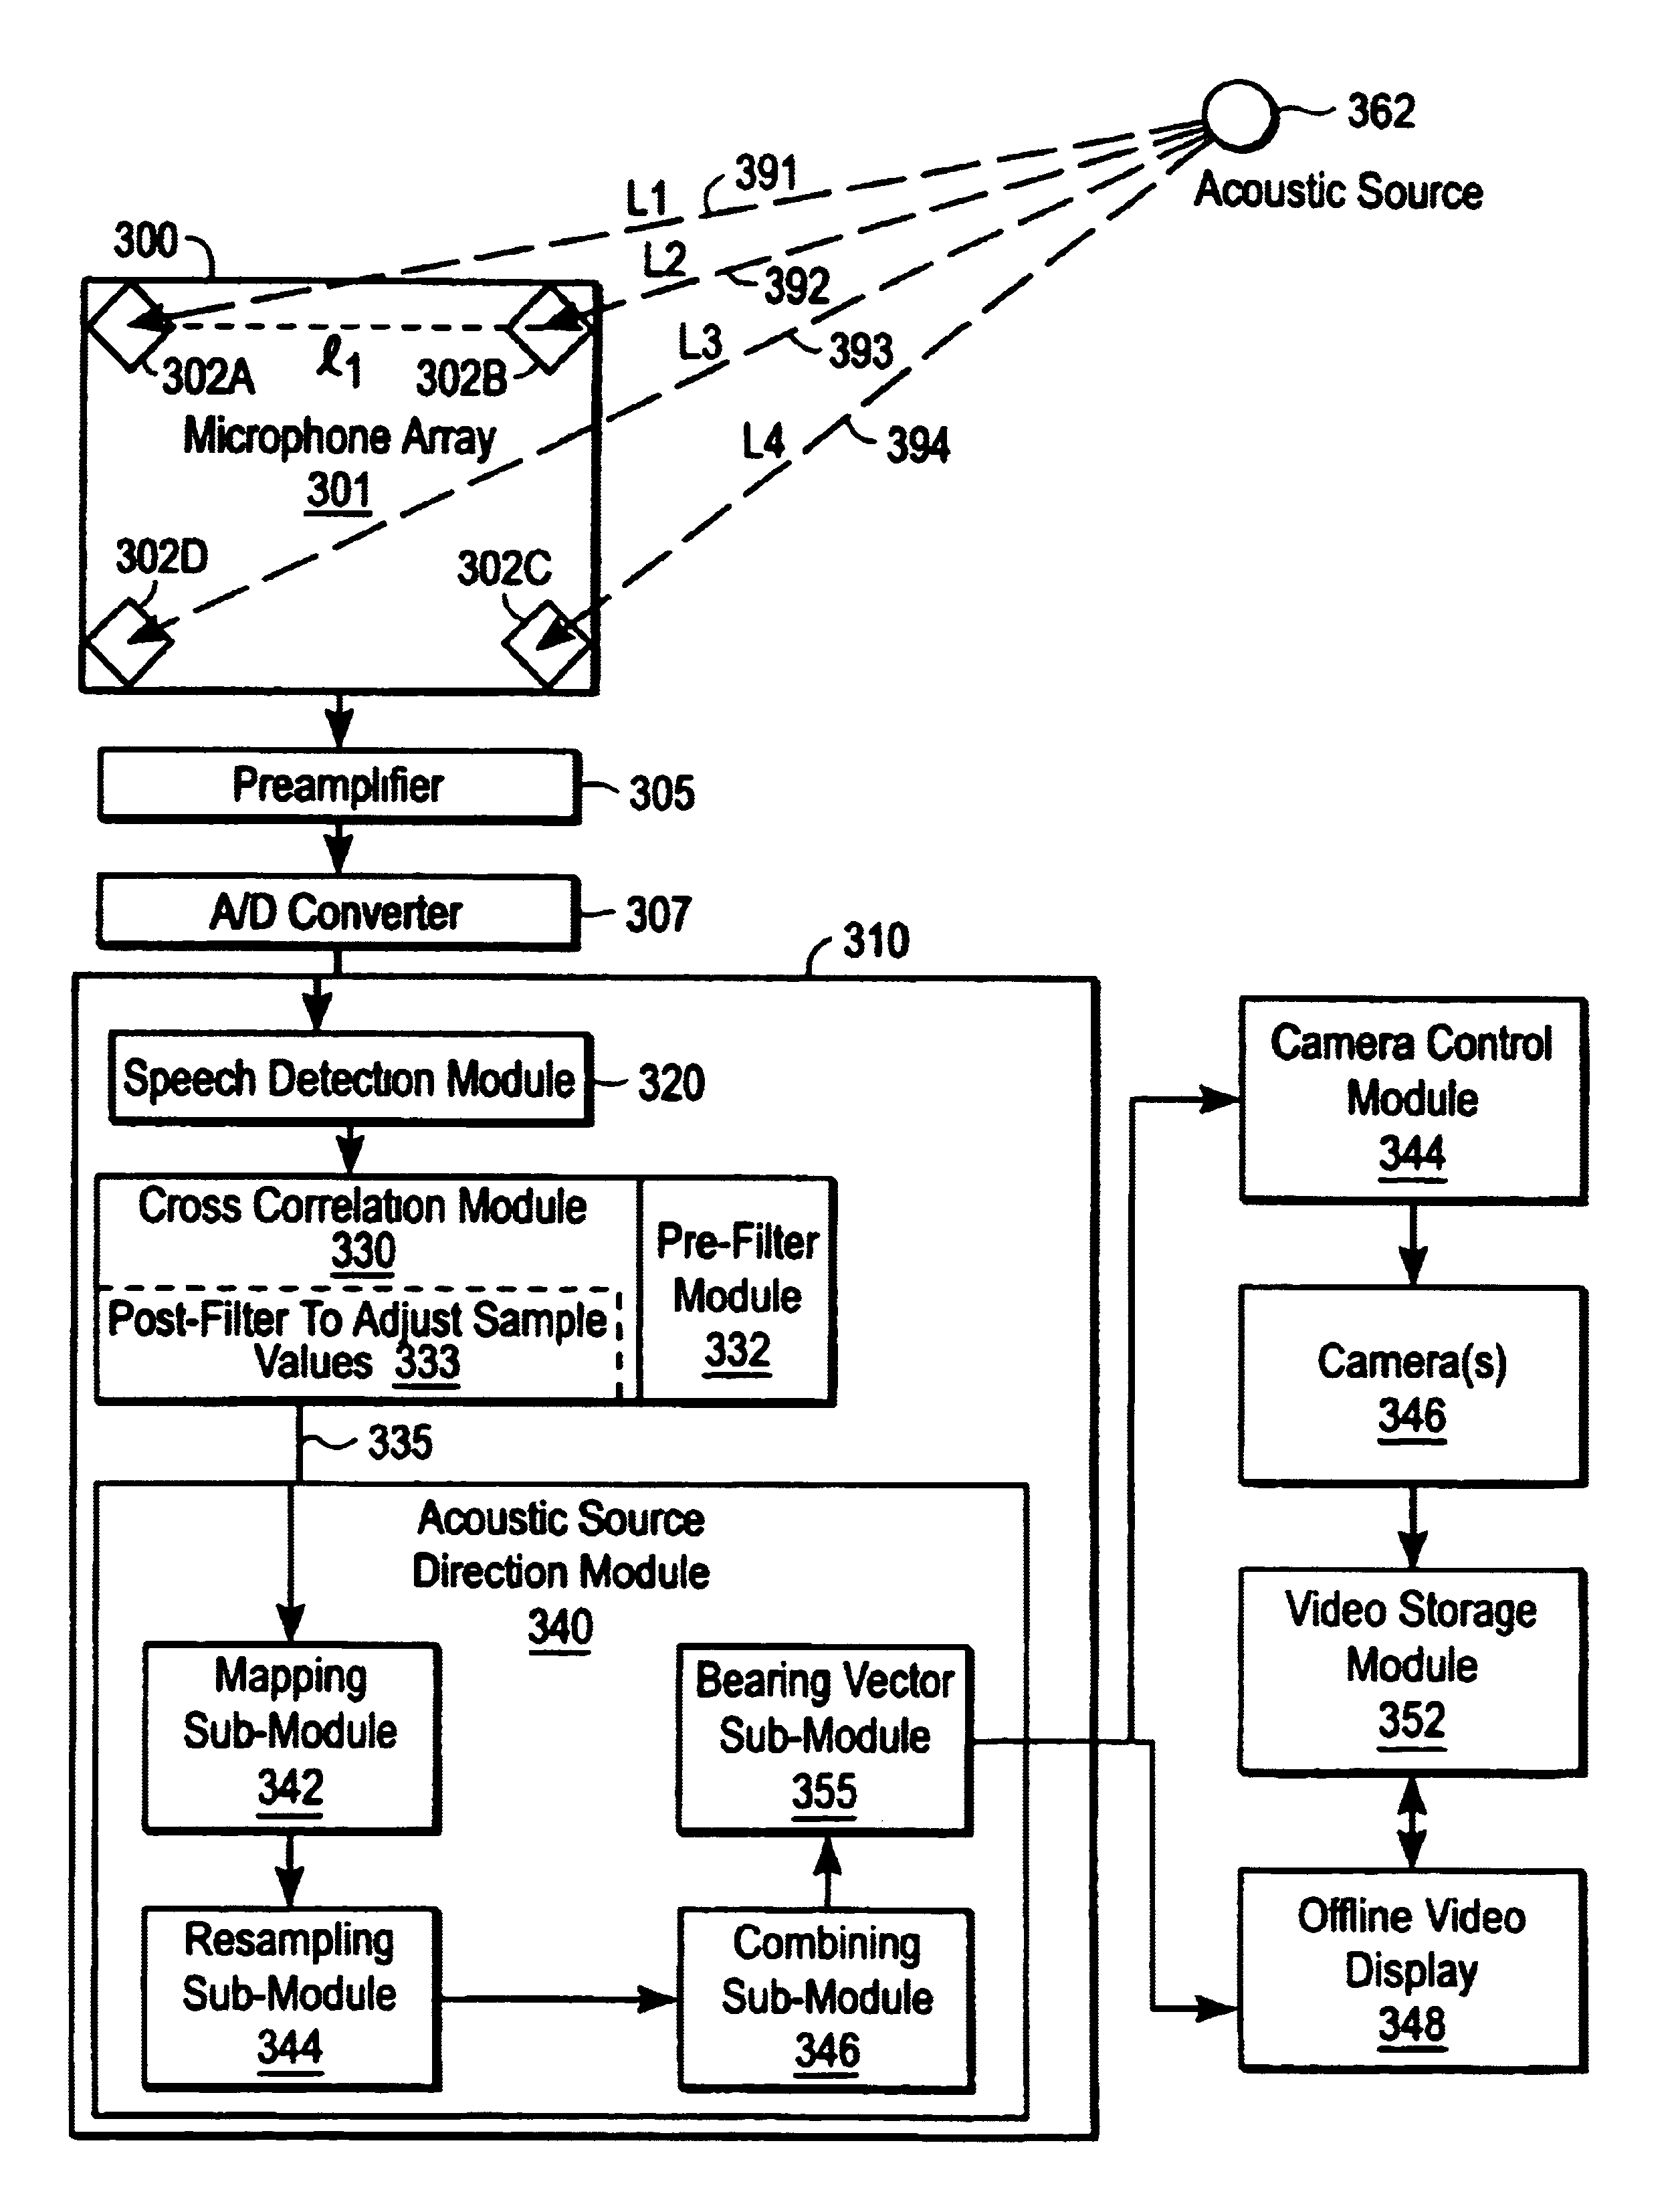
[0030]FIG. 3 is a block diagram illustrating one embodiment of an apparatus for practicing the acoustic source location method of the present invention. A microphone array 300 has three or more microphones 302 that are spaced apart from each other. Signals from two or more pairs of microphones 302 are used to generate information that can be used to determine a likely bearing to an acoustic source 362 from an origin 301. Since the microphones 302 are spaced apart, the distance Li from acoustic source 362 to each microphone may differ, as indicated by lines 391, 392, 393, and 394. Consequently, there will be a difference in the time response of acoustic signals reaching each of the two microphones in a pair due to differences in acoustic path length for acoustic signals to reach each of the two microphones of the pair.

[0031]Each pair of microphones has an associated separation distance between them and an orientation of its two microphones. For example, for the microphone pair consis...


PUM


Abstract

An acoustic source location technique compares the time response of signals from two or more pairs of microphones. For each pair of microphones, a plurality of sample elements are calculated that correspond to a ranking of possible time delay offsets for the two acoustic signals received by the pair of microphones, with each sample element having a delay time and a sample value. Each sample element is mapped to a sub-surface of potential acoustic source locations and assigned the sample value. A weighted value is calculated on each cell of a common boundary surface by combining the values of the plurality of sub-surfaces proximate the cell to form a weighted surface with the weighted value assigned to each cell interpreted as being indicative that a bearing vector to the acoustic source passes through the cell.

Description

RELATED APPLICATIONS[0001]This application claims the benefit of U.S. Provisional Application No. 60 / 247,138, entitled “Acoustic Source Direction By Hemisphere Sampling,” filed Nov. 10, 2000, by Stanley T. Birchfield and Daniel K. Gillmor, the contents of which is hereby incorporated by reference in its entirety.[0002]This application is also related to U.S. patent application Ser. No. 09 / 637,311, entitled “Audio and Video Notetaker,” filed Aug. 10, 2000 by Rosenschein, et. al., assigned to the assignee of the present application, the entire contents of which is hereby incorporated herein by reference in its entirety.BACKGROUND OF THE INVENTION[0003]1. Field of the Invention[0004]The present invention relates generally to techniques to determine the location of an acoustic source, such as determining a direction to an individual who is talking. More particularly, the present invention is directed towards using two or more pairs of microphones to determine a direction to an acoustic ...

Claims


Application Information

Patent Timeline
Patent Type & Authority Patents(United States)
IPC IPC(8): H04R3/00H04R1/40
CPCH04R1/406H04R3/005H04R2201/401
Inventor BIRCHFIELD, STANLEY T.GILLMOR, DANIEL K.
Owner QUINDI
Why Eureka
Try Eureka