
NIR spectroscopy method for analyzing chemical process components

a chemical process and spectroscopy technology, applied in the direction of material analysis, radiation pyrometry, instruments, etc., can solve the problems of labor-intensive and time-consuming analyses, inconsistent results of various laboratories, and inability to meet the needs of different laboratories

Active Publication Date: 2006-06-27
HER MAJESTY THE QUEEN & RIGHT OF CANADA REPRESENTED BY THE MIN OF NATURAL RESOURCES
View PDF12 Cites 45 Cited by
  • Summary
  • Abstract
  • Description
  • Claims
  • Application Information

AI Technical Summary

Benefits of technology

This patent describes a method for analyzing chemical compositions using near-infrared (NIR) spectroscopy. The invention is particularly useful for analyzing chemical process components during continuous processing. The NIR system used includes a stable light source, detector, electronics, and mechanical systems. The NIR hardware must exhibit long-term stability to achieve accurate results. The method involves correlating the NIR spectra to reference analytical data using chemometric techniques, such as principal component analysis (PCA) or partial least squares in latent variables (PLS). The NIR system is particularly useful for analyzing bitumen froth treatment during oil sands processing. The system is trained for the specific tests being conducted and can provide direct values for various components of the bitumen product, such as asphaltenes content, solvent-to-bitumen ratio, and density.

Problems solved by technology

These analyses are labor-intensive and time-consuming.
Consistency of the results from various laboratories is frequently not satisfactory.

Method used


Image

  • NIR spectroscopy method for analyzing chemical process components
  • NIR spectroscopy method for analyzing chemical process components
  • NIR spectroscopy method for analyzing chemical process components

Examples


example 1

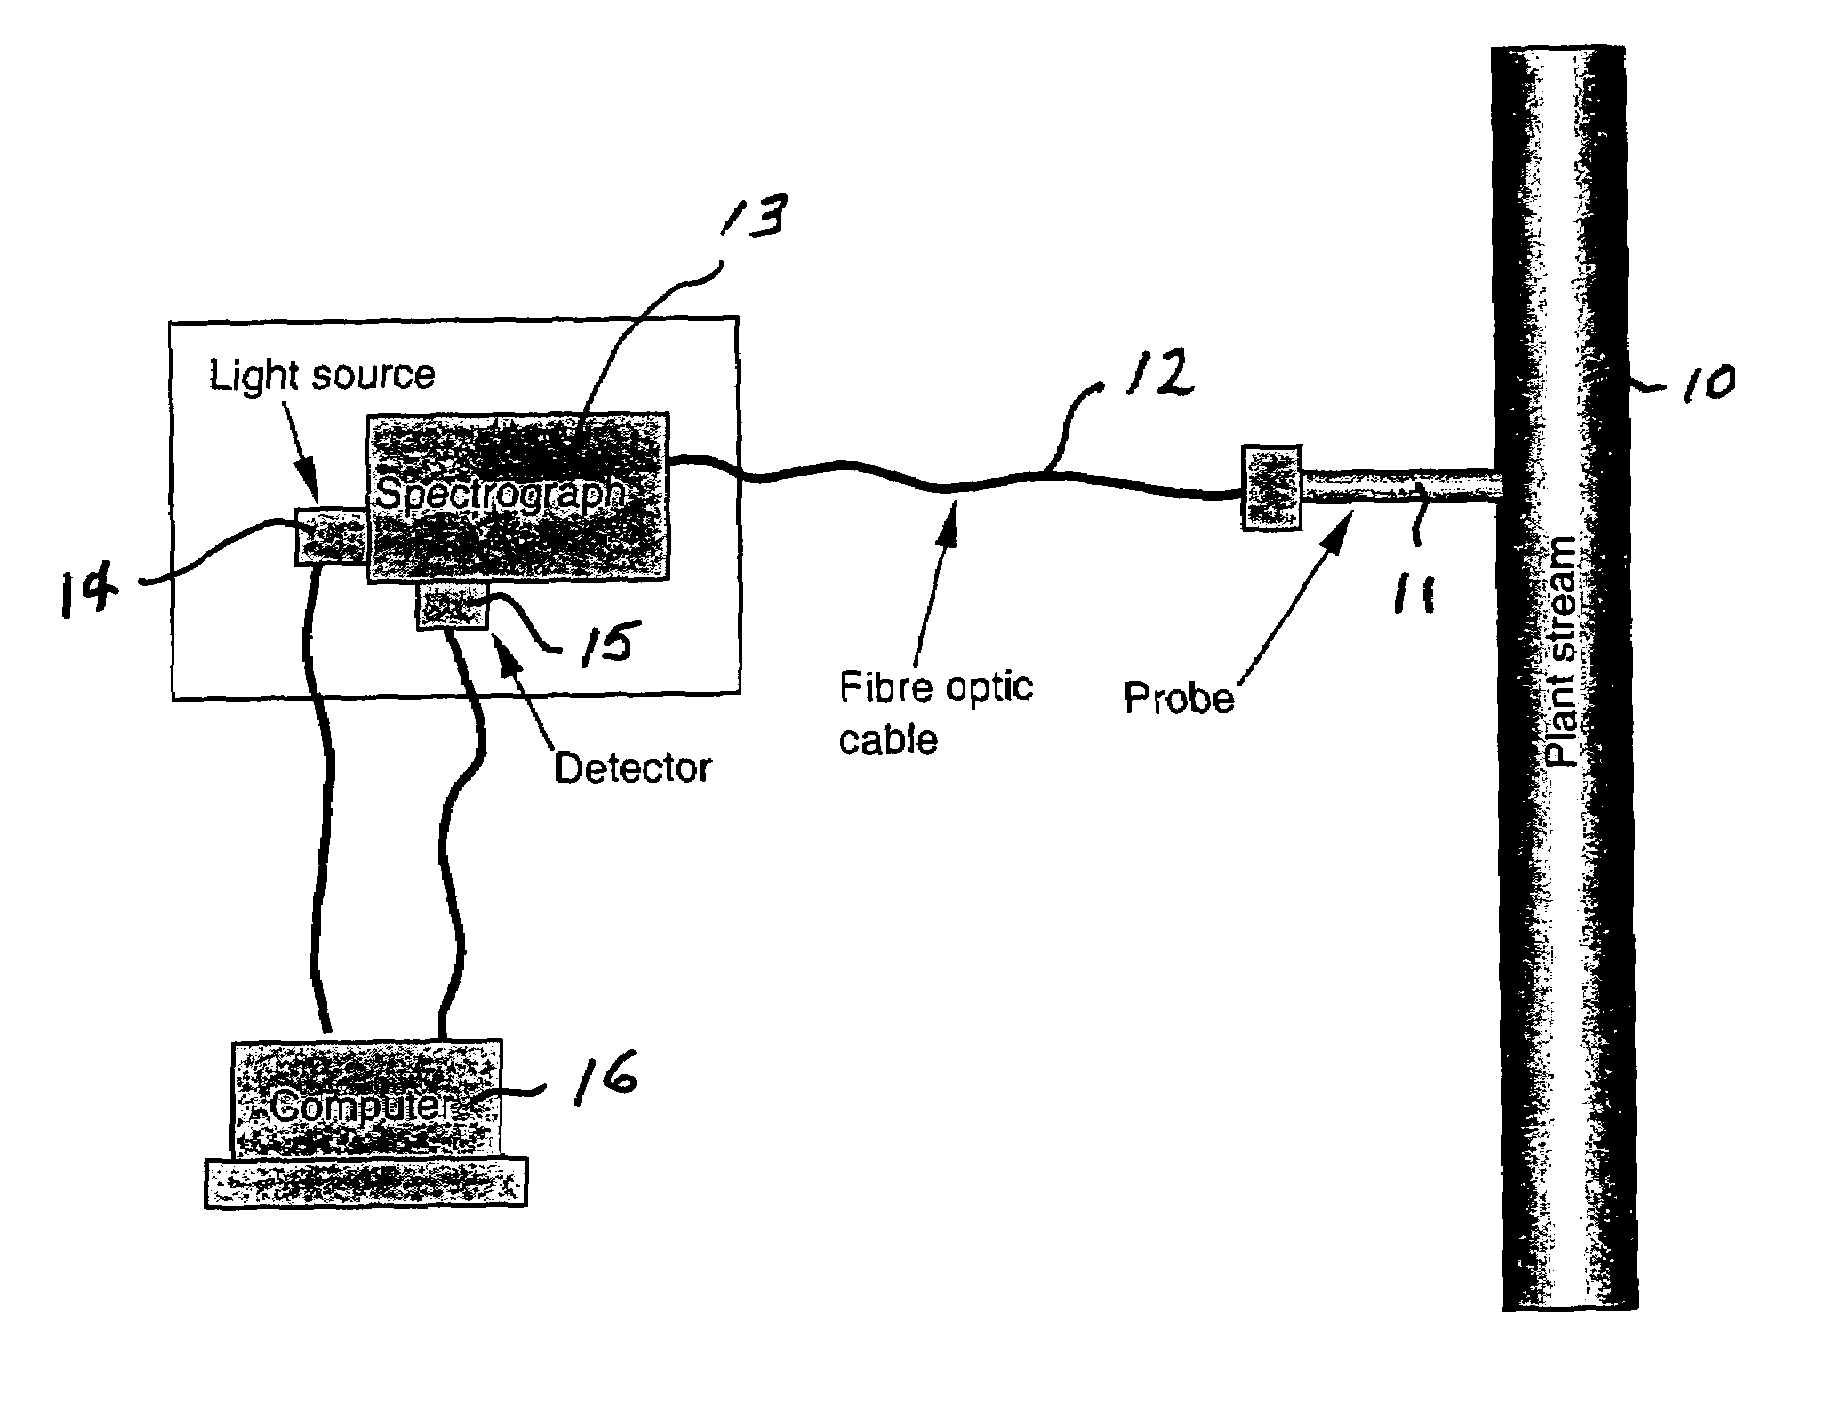
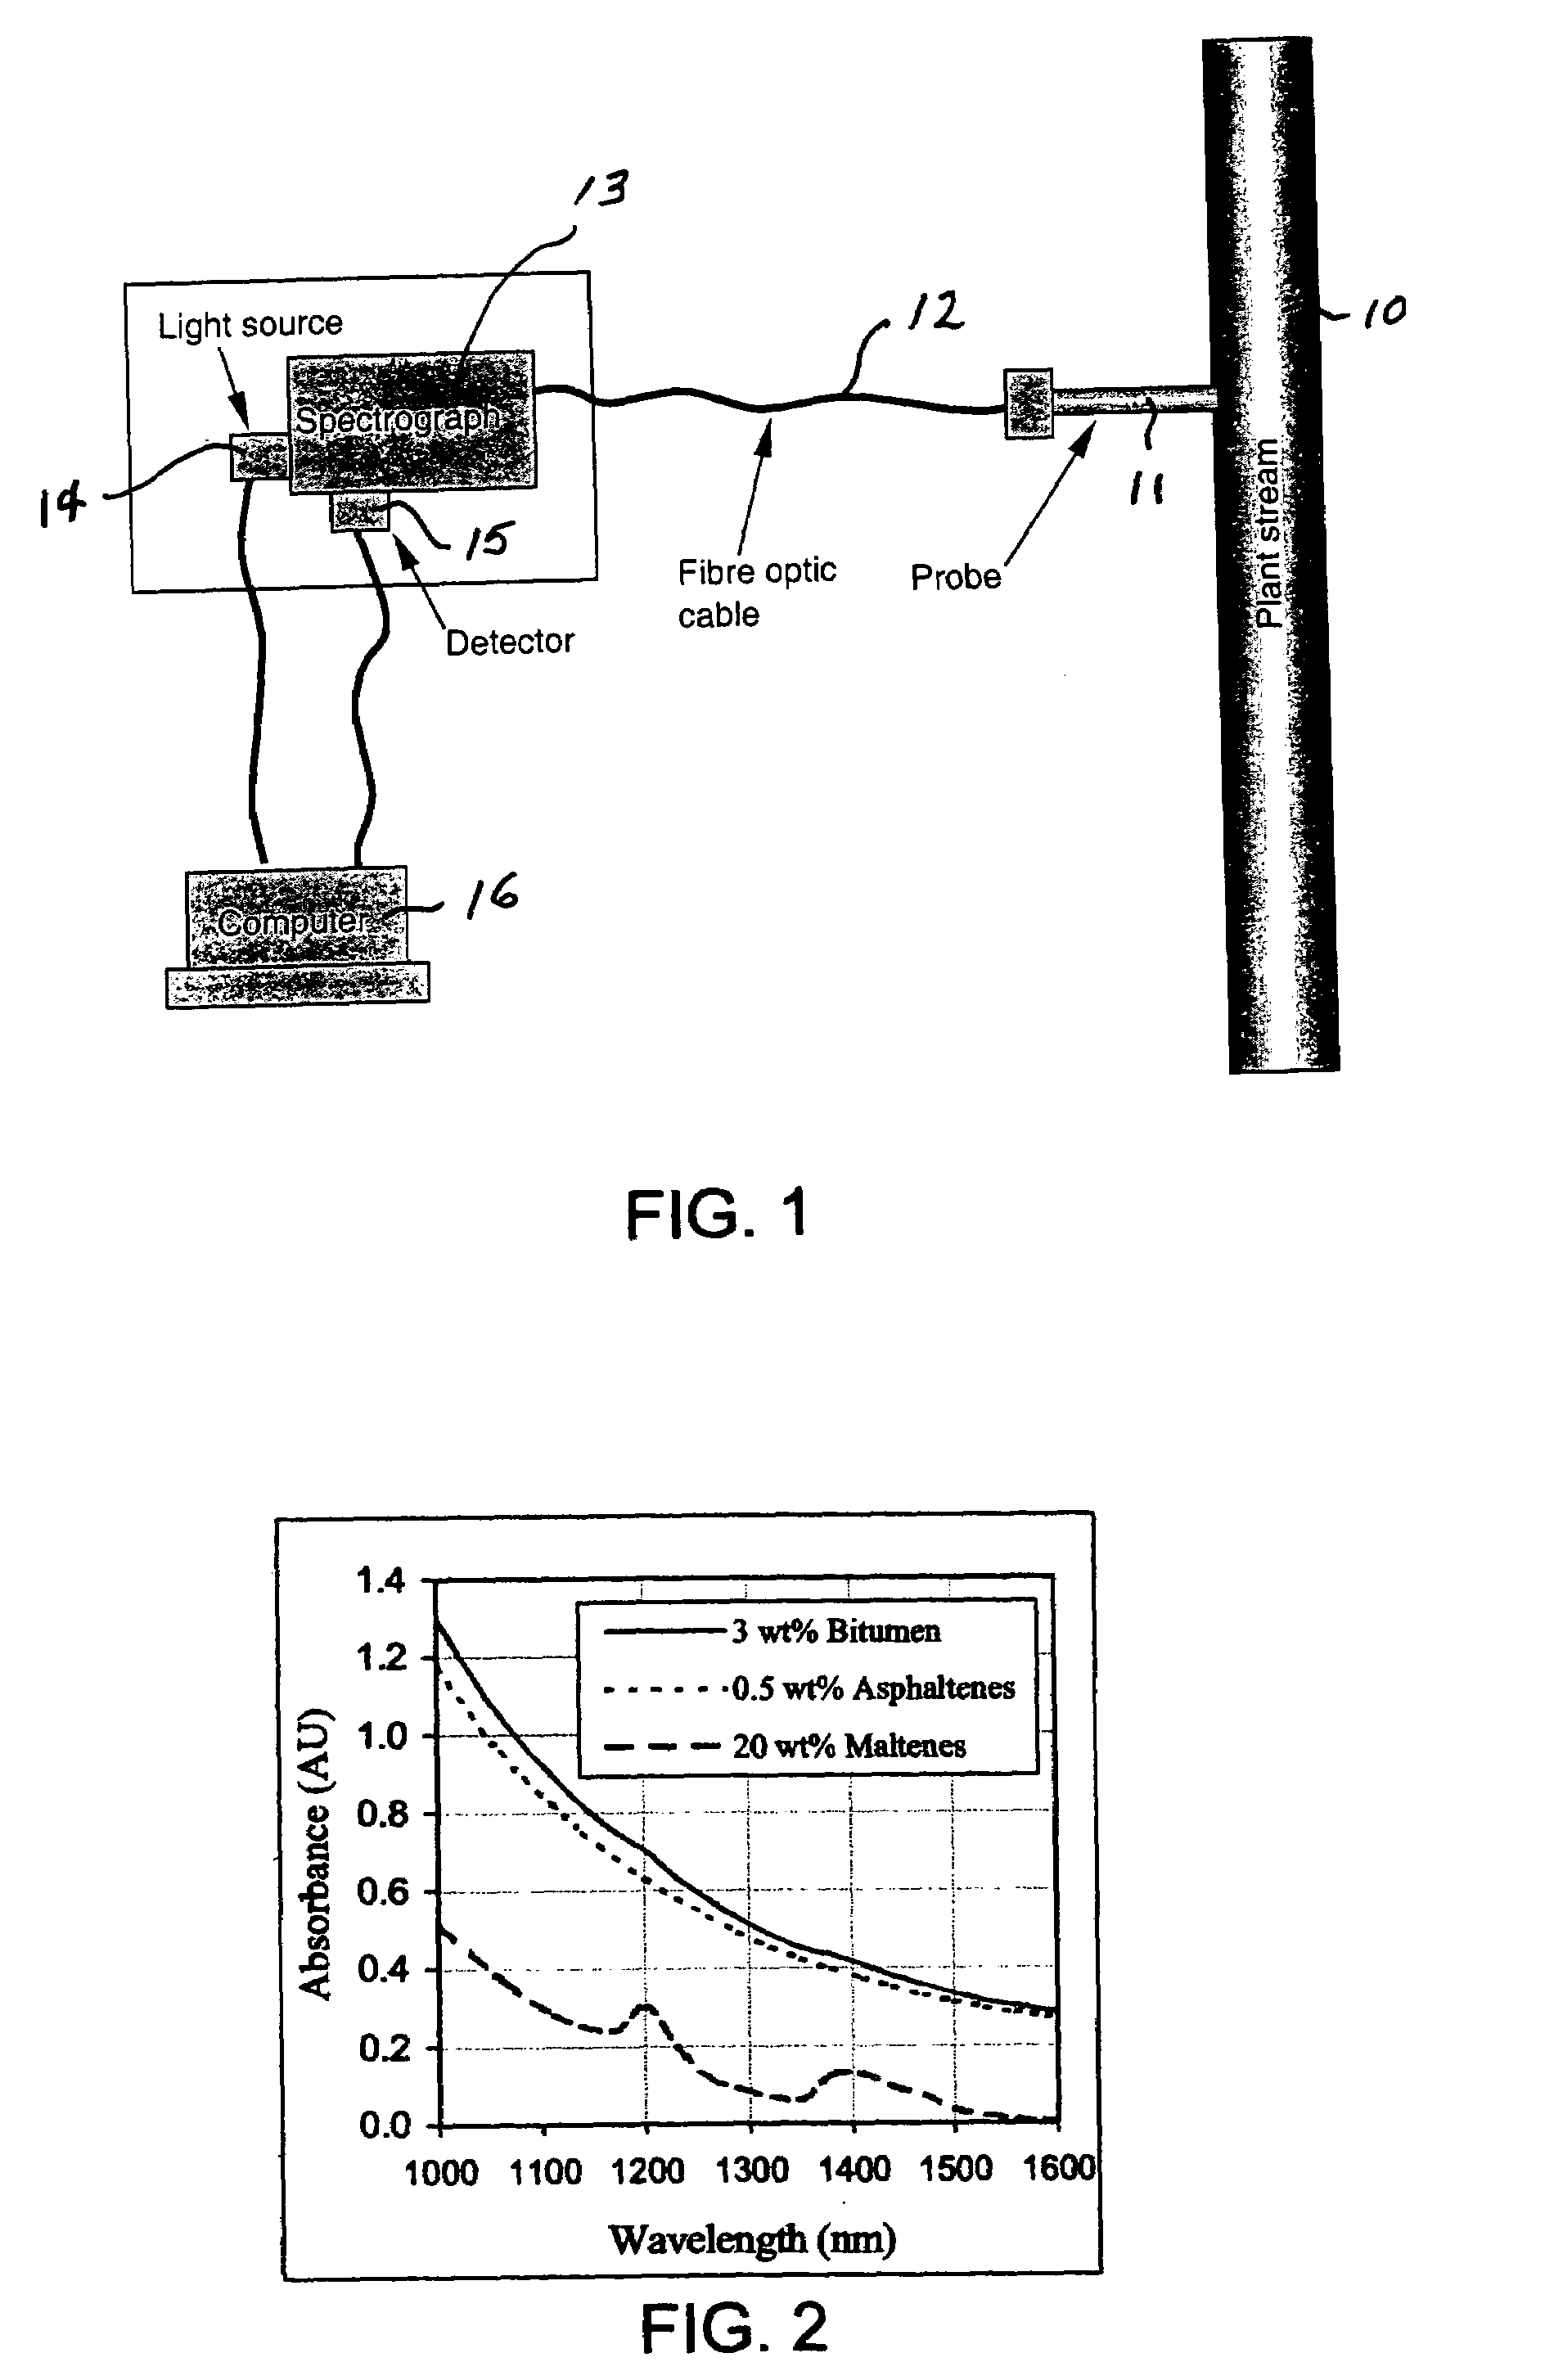
[0031]Tests were conducted using the NIR spectrograph arrangement shown in FIG. 1. It comprised a spectrograph that had no moving parts, a linear array detector, a stable light source, and a double-pass transflectance probe with fiber-optic cable coupling the light source and the spectrograph. The wavelength range was 900 to 1700 nm.

[0032]Sample spectra were recorded by directly dipping the transflectance probe into sample solutions. The solvent-diluted bitumen samples were measured directly with a 2-mm light path length probe without further dilution. The bitumen, asphaltenes, and maltenes samples were diluted with solvent (toluene or CS2) and the measurement was done with a 10-mm light pass length probe.

[0033]All samples were analyzed using standard laboratory analytical procedures. The results were used as reference values for establishing and evaluating the quantitative calibration models from NIR.

[0034]The n-C5 asphaltenes content in bitumen was determined by following the test...

example 2

[0041]A series of asphaltenes-toluene solutions were prepared with various asphaltenes concentrations (0.08, 0.13, 0.22, 0.44, and 0.87 g / 100 mL). NIR spectra of these samples and pure toluene were recorded using a 10-mm light path length transflectance probe. The contribution of toluene to the absorbance was subtracted by calculating the difference of the sample solution spectra and the pure toluene spectrum (considering the dilution factor). Absorptivities of asphaltenes were calculated as:

[0042]Ki=AiL×C

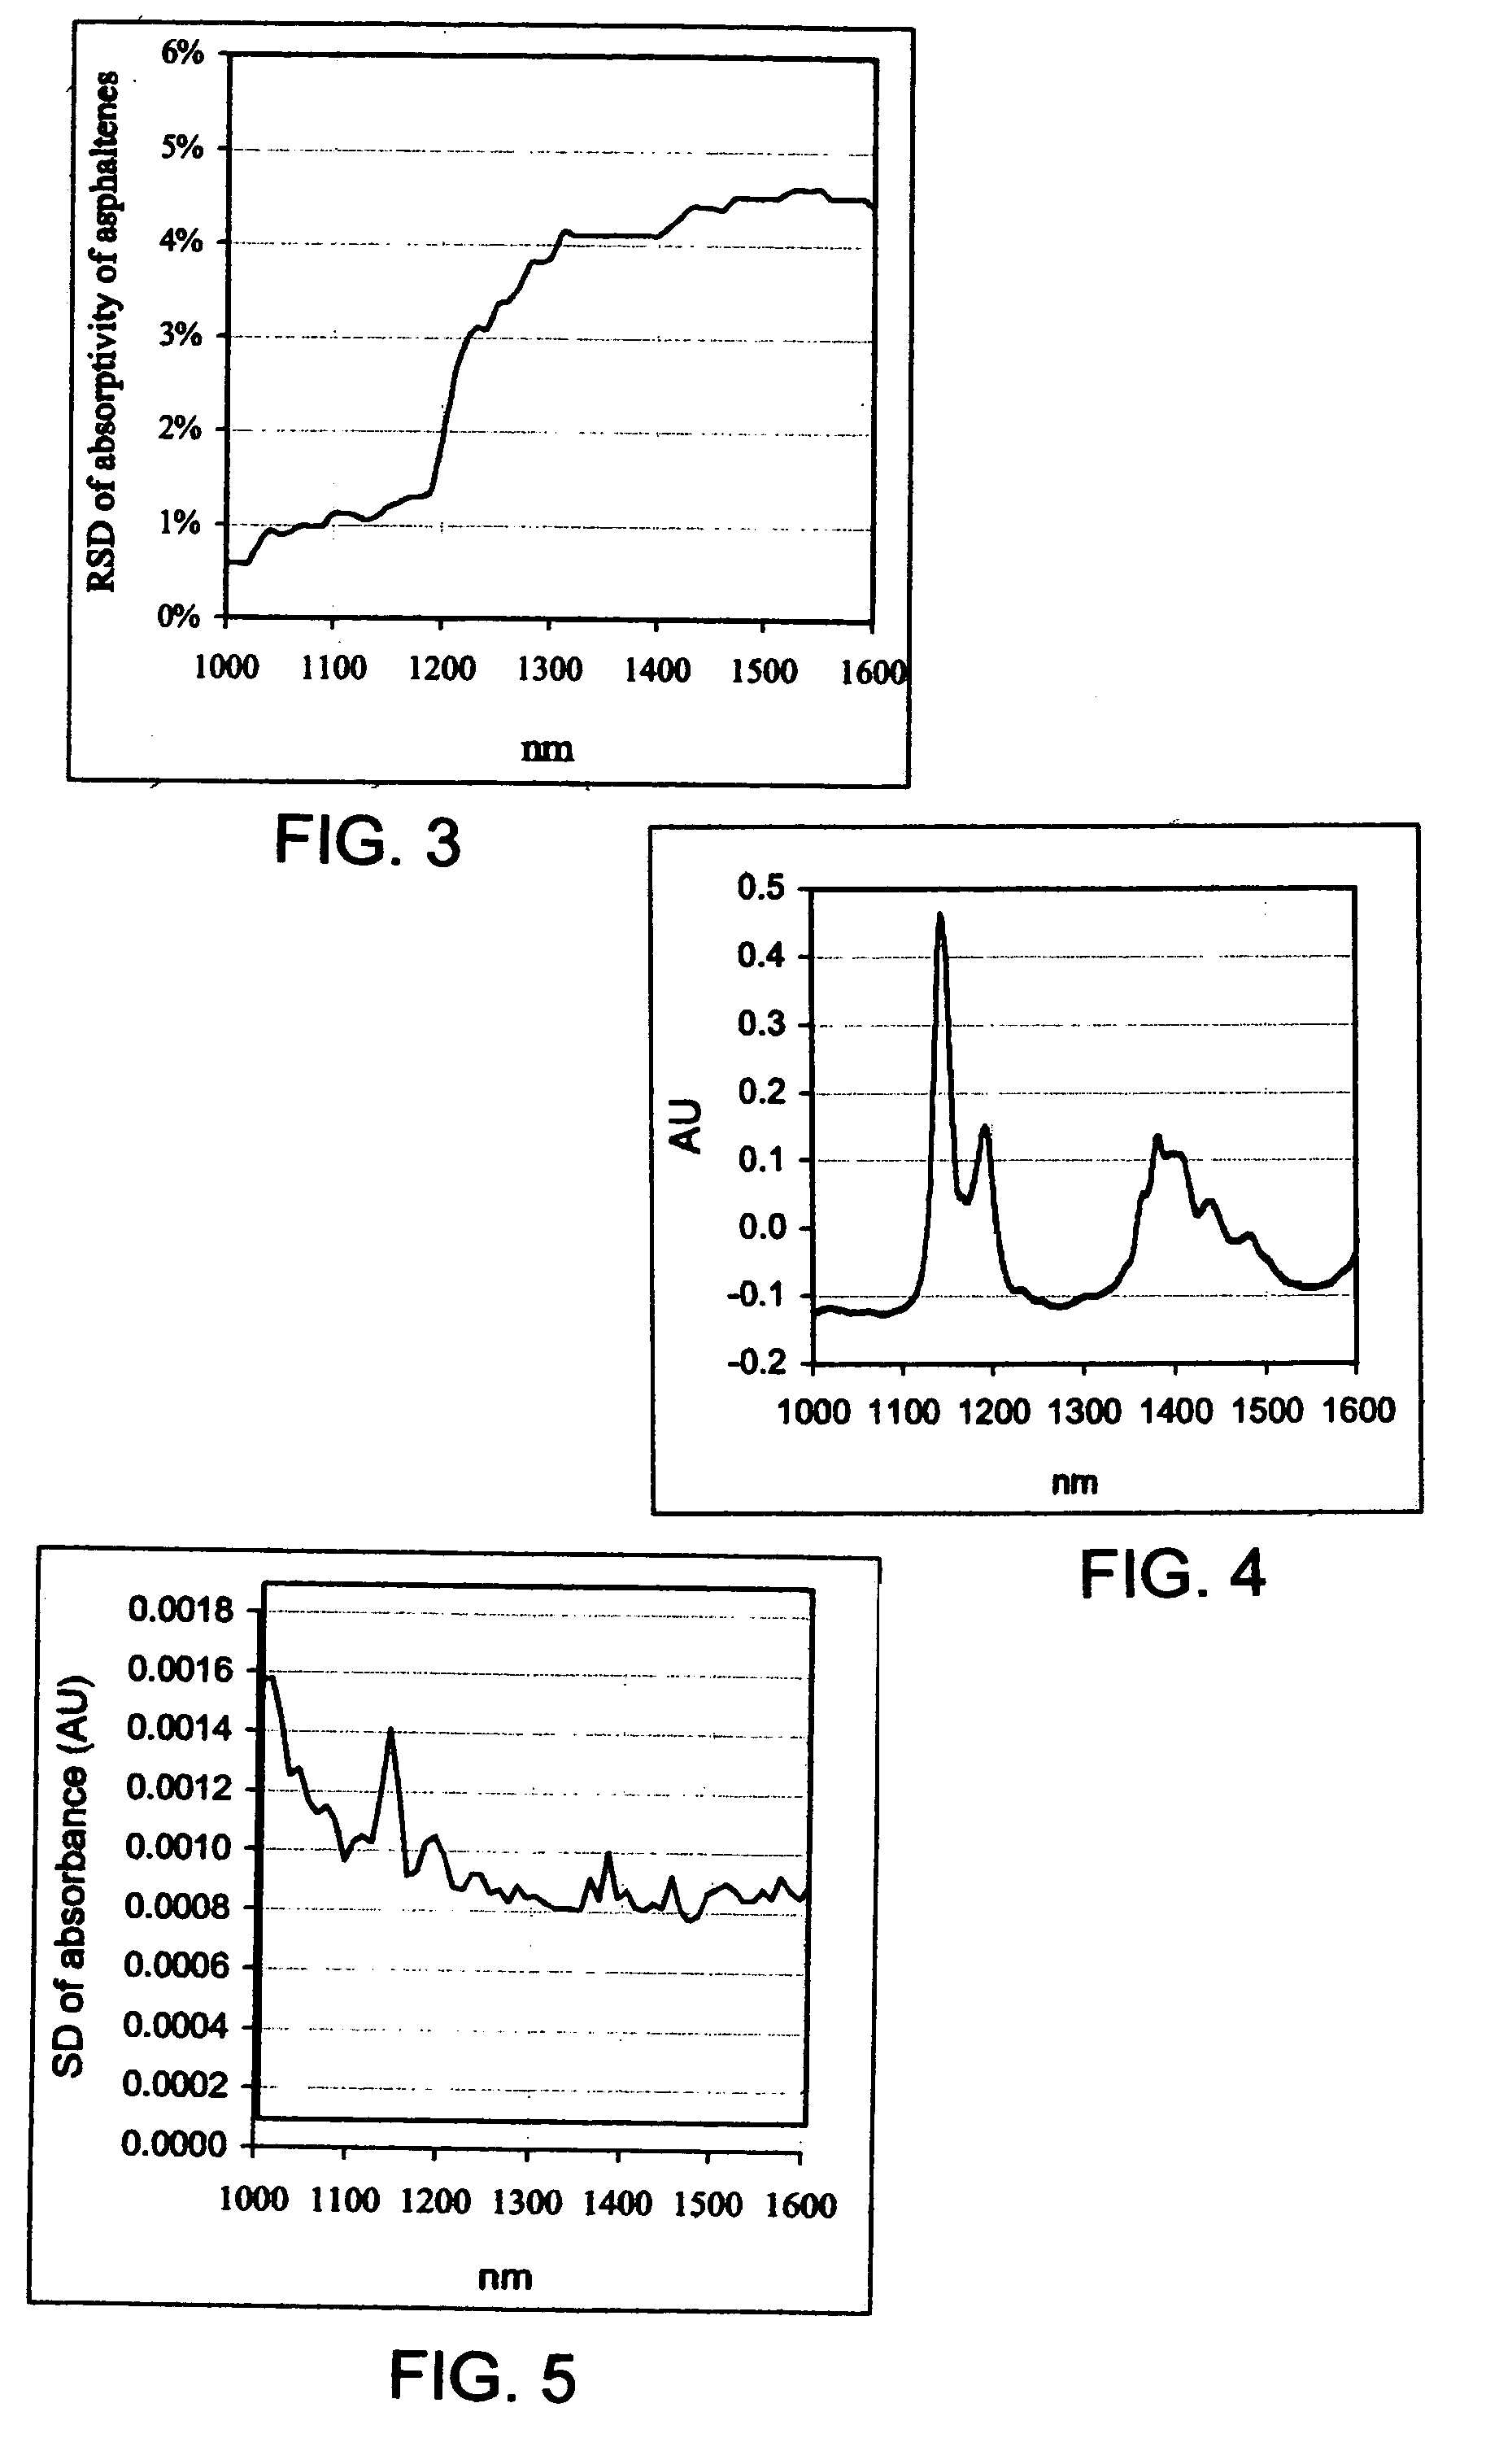
where Ki is the absorptivity of asphaltenes at wavelength i, Ai is the absorbance of the asphaltenes solution (subtracted toluene) at wavelength i, L is the light path length in centimeters, C is the asphaltenes concentration in grams of asphaltenes per 100 mL solution. The relative standard deviation (RSD) of Ki within the six asphaltenes solutions was then calculated. FIG. 3 shows the variation of Ki, in response to solvent dilution changes, as a function of wavelength. The RSD w...

example 3

[0043]The long-term stability of the NIR system is essential for the successful use of the instrument as an analytical tool. Several previous attempts to use spectroscopy to measure similar properties failed because lack of stability. FIG. 4 shows 40 toluene spectra acquired during a period of two weeks (4 spectra per day). High spectral reproducibility is clearly evident. The standard deviation (SD) of absorbance is presented in FIG. 5. An SD of less than 0.0015 absorbance units (AU) was observed. The RSD for the toluene peak at 1145 nm was 0.2%. The high reproducibility of the NIR system is believed to be due mainly to the highly stable spectrograph and the array detector, which have no moving parts, and the long light path length (10 mm) that prevents sample temperature variation during spectrum acquisition. The original spectra were therefore used directly for establishing calibration models.


PUM

PropertyMeasurementUnit
wavelengthaaaaaaaaaa

Abstract

A method is described for providing rapid on-line analyses of chemical compositions such as chemical process streams, utilizing near-infrared (NIR) spectroscopy in combination with chemometrics. In the method, for each type of analysis to be conducted, a database is provided by analyzing a series of samples using standard laboratory analytical procedures, utilizing the results as reference values to establish quantitative calibration models from NIR spectroscopy using chemometric techniques and storing this information in a computer database. An NIR spectroscopic system is also provided comprising a transflectance or a transmittance probe coupled via fiber-optic cables to a stable white light source and a spectrograph. The probe is inserted into a test sample or chemical process stream to be analyzed, a stable white light of selected wavelength range is beamed to the probe and the spectra obtained on the spectrograph are recorded. Finally the spectra obtained are correlated to the reference data stored in the computer to obtain a rapid measurement of the analysis desired.

Description

CROSS-REFERENCE TO RELATED APPLICATION[0001]This application claims the benefit of Provisional Application Ser. No. 60 / 423,975, filed Nov. 6, 2002.BACKGROUND OF THE INVENTION[0002]This invention relates to a NIR spectroscopy method for analysis of chemical process components, e.g. for analysis of bitumen and solvent-diluted bitumen from froth treatment during oil sands processing.[0003]In analytical or research activities, as well as in industrial chemical processes, there is a need for highly reliable real or near real time analysis of chemical components, e.g. for froth treatment during oil sands processing. In the extraction of bitumen from oil sands, froth treatment is an essential step for removing water and solids from bitumen froth to produce bitumen meeting product specifications. The bitumen froth usually contains about 60 wt % bitumen, 30 wt % water, and 10 wt % solids. Current commercial froth treatment employs naphtha dilution followed by multistage centrifugation, which...

Claims


Application Information

Patent Timeline
Patent Type & Authority Patents(United States)
IPC IPC(8): G01N21/33G01J5/02G01N21/35G01N21/85
CPCG01N21/359G01N21/3563G01N21/8507
Inventor LONG, YICHENGDABROS, TADEUSZHAMZA, HASSAN
Owner HER MAJESTY THE QUEEN & RIGHT OF CANADA REPRESENTED BY THE MIN OF NATURAL RESOURCES
Learn More