Automatic monitoring and statistical analysis of dynamic process metrics to expose meaningful changes

a dynamic process and statistical analysis technology, applied in the field of data processing, can solve the problems of high time-consuming and laborious process of manual scanning, and still requires significant user knowledge of alerting software in order to achieve the effect of detecting significant changes

Inactive Publication Date: 2006-07-04
MICROSOFT TECH LICENSING LLC
View PDF12 Cites 28 Cited by
  • Summary
  • Abstract
  • Description
  • Claims
  • Application Information

AI Technical Summary

Benefits of technology

[0017]Statistical Process Control (SPC) techniques are applied to business metrics, represented as measures in multidimensional data. These SPC techniques allow the system to filter out the normal day-to-day random variation in the metrics and test for underlying, fundamental changes in a business process. The system applies these techniques to metrics automatically, and determines the correct threshold that would determine the difference between normal random variation and fundamental changes. Thus, alerts may be triggered to notify the user that something has changed, without that user ever having to determine the specific thresholds. Moreover, users can monitor hundreds of metrics across dozens of processes for changing conditions without having to set specific alerts.

Problems solved by technology

People need to know when some input or output of a process has changed, because it threatens the predictability of an organization, and might indicate a need to alter the current processes in order to get the desired outcome.
Unfortunately, this process of manual scanning was highly time-intensive and required significant knowledge on the part of the manager.
Despite its advantages over earlier approaches, alerting software still requires significant user knowledge in order to set correct thresholds.
Setting a threshold too close to the historical average may result in many false alarms, i.e., an alert being triggered while in a normal state.
On the other hand, setting a threshold too far from typical values may result in an alarm never being generated, despite the occurrence of a fundamental change in a process.
Furthermore, conventional software only automates the periodic inspection of data.
Setting and maintaining all of the alerts can be extremely tedious.
Due to their complexity, multidimensional databases further exacerbate the monitoring problems discussed above.
Manually creating thresholds for monitoring processes (measures) across dimensions can be extremely burdensome or practically impossible in some cases.

Method used


Image

  • Automatic monitoring and statistical analysis of dynamic process metrics to expose meaningful changes
  • Automatic monitoring and statistical analysis of dynamic process metrics to expose meaningful changes
  • Automatic monitoring and statistical analysis of dynamic process metrics to expose meaningful changes

Examples


Embodiment Construction

[0018]Reference is now made to the figures in which like reference numerals refer to like elements. For clarity, the first digit of a reference numeral indicates the figure number in which the corresponding element is first used.

[0019]In the following description, numerous specific details of programming, software modules, user selections, network transactions, database queries, database structures, etc., are provided for a thorough understanding of the embodiments of the invention. However, those skilled in the art will recognize that the invention can be practiced without one or more of the specific details, or with other methods, components, materials, etc.

[0020]In some cases, well-known structures, materials, or operations are not shown or described in detail in order to avoid obscuring aspects of the invention. Furthermore, the described features, structures, or characteristics may be combined in any suitable manner in one or more embodiments.

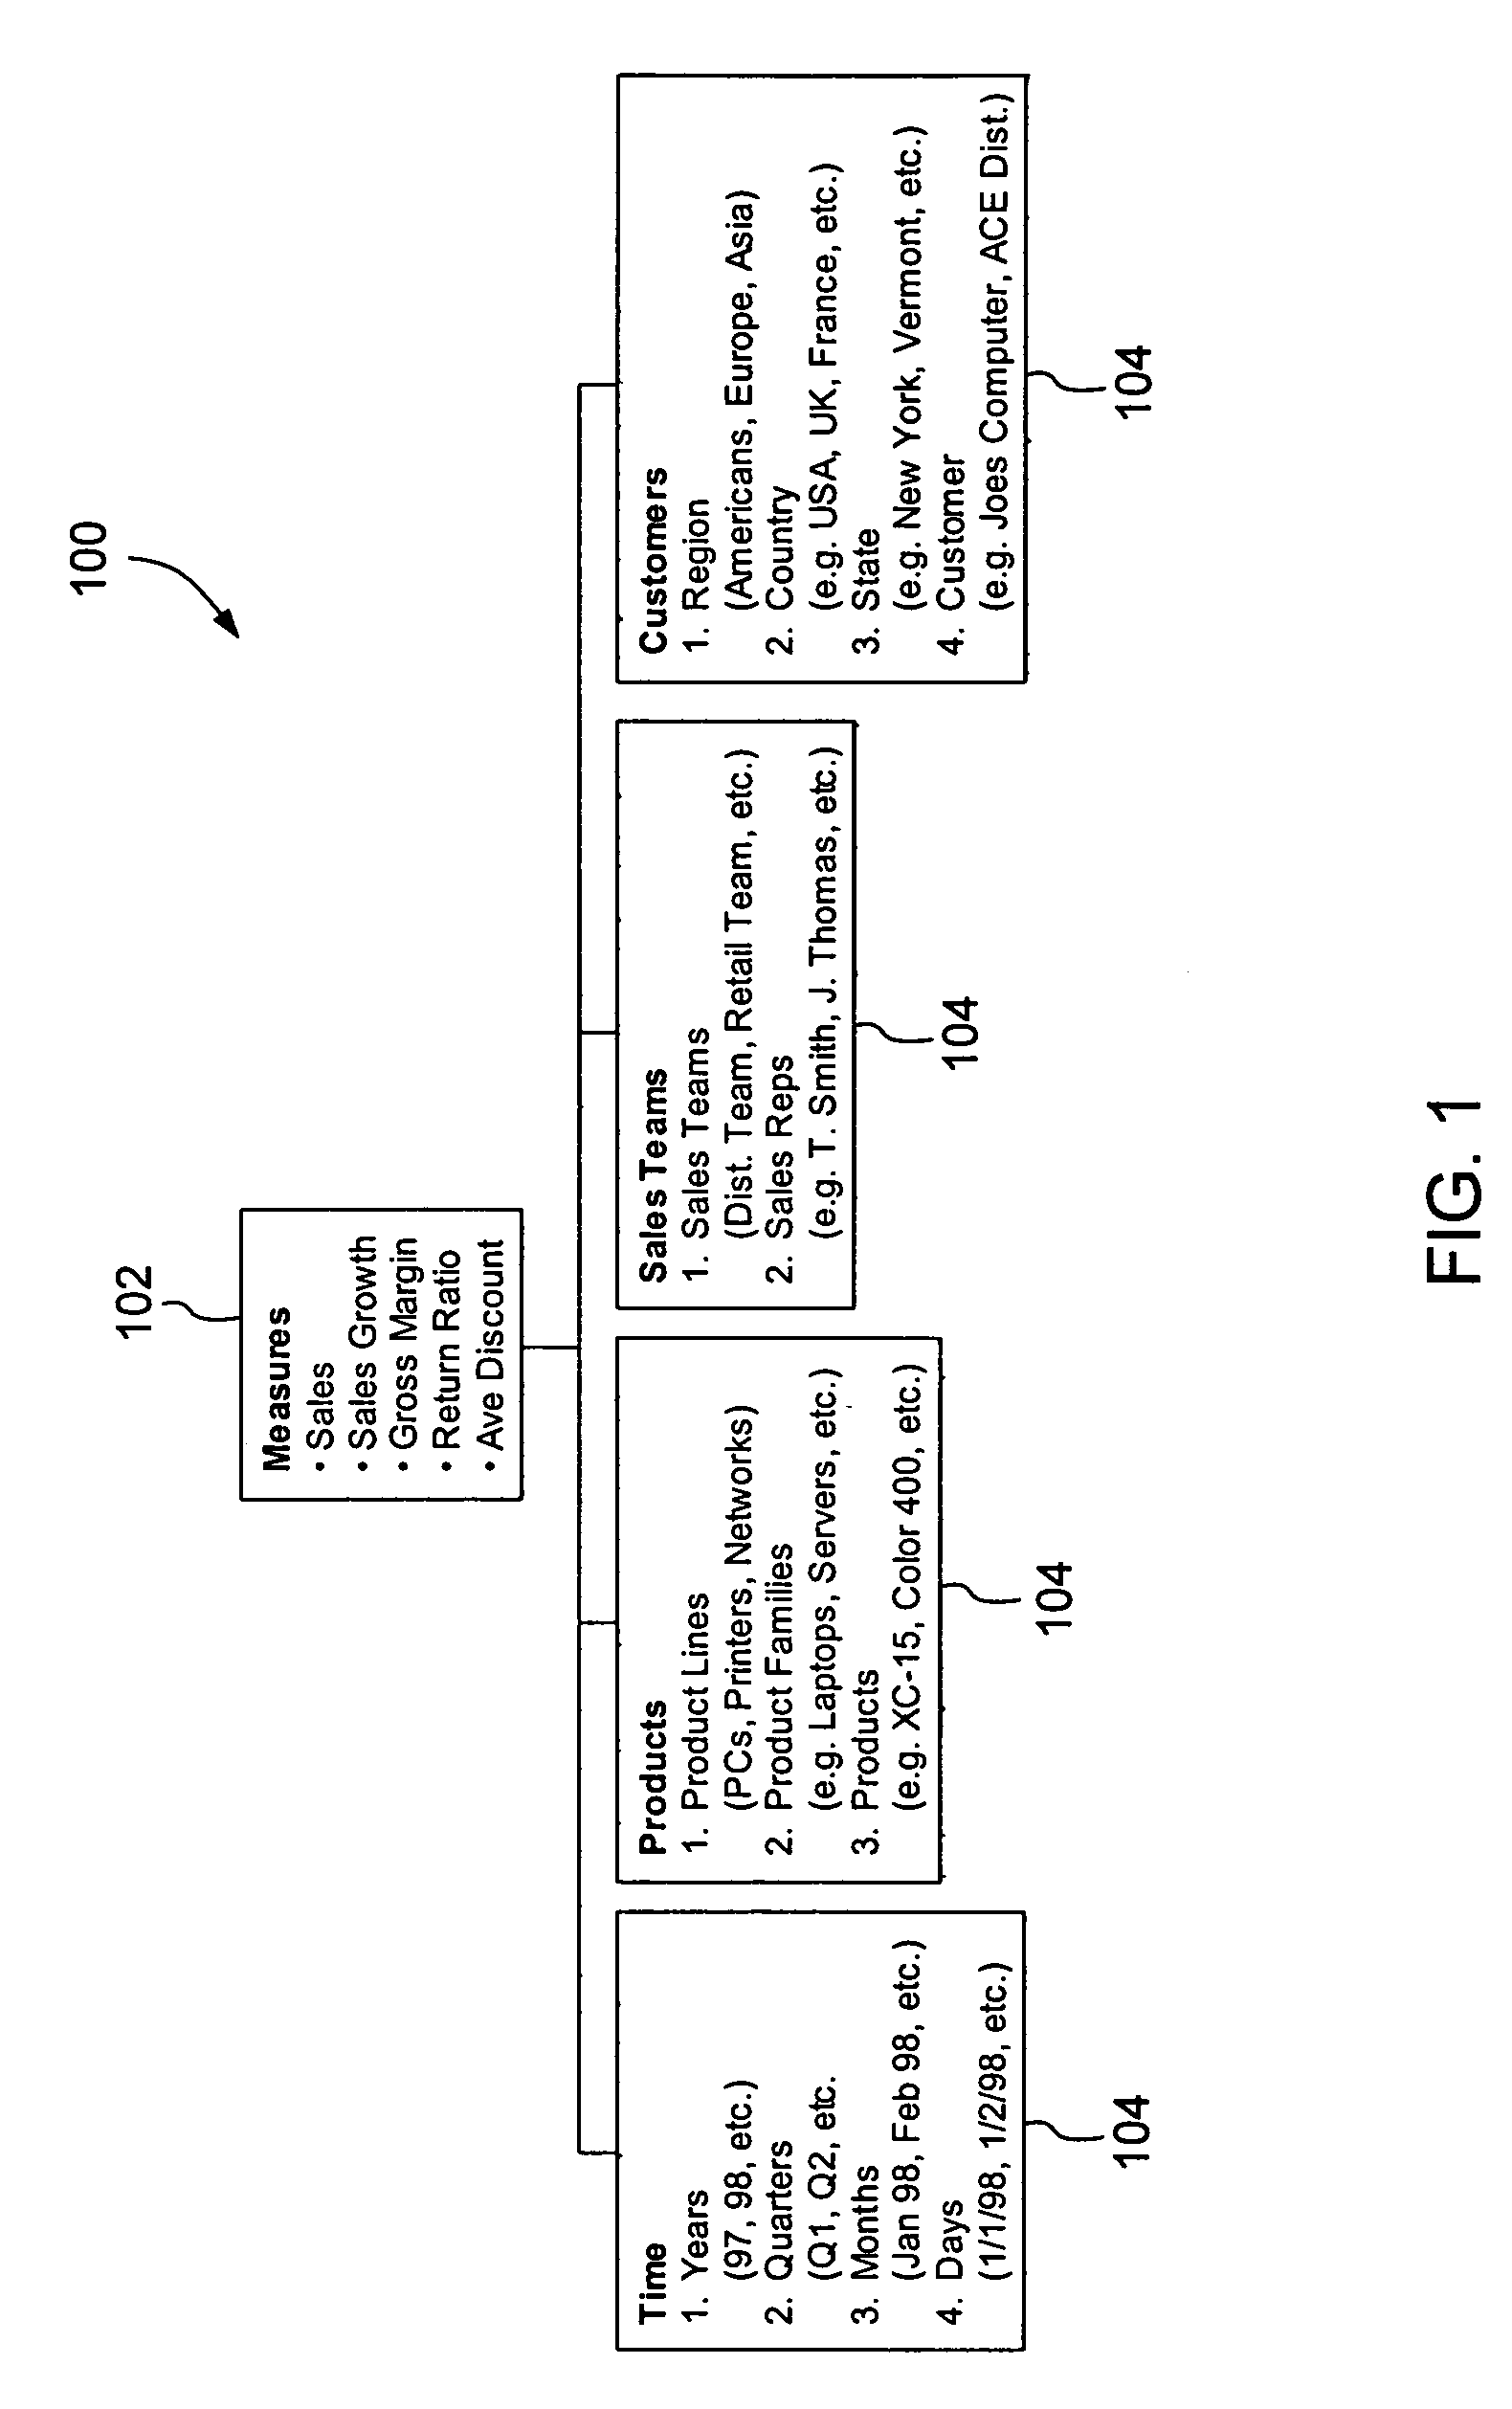
[0021]FIG. 1 is a schema for an On-...


PUM


Abstract

A selection module allows a user to specify at least one measure to be monitored in at least one dimension of a dimensional hierarchy. A control limit calculator extracts, for each specified measure and for each specified dimension, a time series from a multidimensional database for the specified measure in the specified dimension and automatically calculates one or more control limits for the specified measure in the specified dimension based on the extracted time series using a Statistical Process Control (SPC) technique. Thereafter, a monitoring module monitors newly acquired data including each specified measure in each specified dimension for an out-of-limits condition based on one or more automatically-calculated control limits. An alert module triggers an alert in response to an out-of-limits condition being detected.

Description

CROSS-REFERENCE TO RELATED APPLICATIONS[0001]This application claims the benefit of U.S. Provisional Application No. 60 / 531,347, filed Dec. 19, 2003, with inventor Robert C. Lokken, which application is incorporated herein by reference in its entirety.TECHNICAL FIELD[0002]The present invention relates generally to the field of data processing. More specifically, the present invention relates to techniques for analyzing multidimensional data.BACKGROUND OF THE INVENTION[0003]Business people tend to either manage processes or projects. Processes lend themselves to repeatable, systematic measures that allow the manager of the process to determine if that process is performing as usual or if something about the process has changed. At the highest level, a business itself is a “process”—taking input resources (time, capital, people, materials, etc.) and producing an output (sales and profits).[0004]Businesses build processes to systematically execute their plans and produce a predicable o...

Claims


Application Information

Patent Timeline
Patent Type & Authority Patents(United States)
IPC IPC(8): G06F17/30G05B11/01G10L15/00G06F11/34
CPCG06F17/30592G06F11/3452Y10S707/99942Y10S707/99943G06F16/283G06F7/00G10L15/00
Inventor LOKKEN, ROBERT C.
Owner MICROSOFT TECH LICENSING LLC
Why Eureka
Try Eureka