On-line measurement and control of polymer product properties by Raman spectroscopy

a technology of raman spectroscopy and measurement and control, applied in the direction of optical radiation measurement, instruments, spectrometry/spectrophotometry/monochromators, etc., can solve the problems of inconvenient sampling, testing and adjustment, and the slowness of periodic sampling

Inactive Publication Date: 2006-09-12
EXXONMOBIL CHEM PAT INC
View PDF64 Cites 19 Cited by
  • Summary
  • Abstract
  • Description
  • Claims
  • Application Information

AI Technical Summary

Problems solved by technology

This periodic sampling, testing and adjusting, however, is undesirably slow, since sampling and laboratory testing of polymer product properties such as melt index, molecular weight distribution, and density is time-consuming.
As a result, conventional processes can produce large quantities of “off-spec” polymer product before manual testing and control can effectively adjust the polymerization conditions.

Method used


Image

  • On-line measurement and control of polymer product properties by Raman spectroscopy
  • On-line measurement and control of polymer product properties by Raman spectroscopy
  • On-line measurement and control of polymer product properties by Raman spectroscopy

Examples


examples 1 – 2

Examples 1–2

[0088]Examples 1–2 were used to show the feasibility of embodiments of the invention. In Examples 1–2, measurements were made in the laboratory, simulating the measurements that would be made on-line in a polymerization reactor.

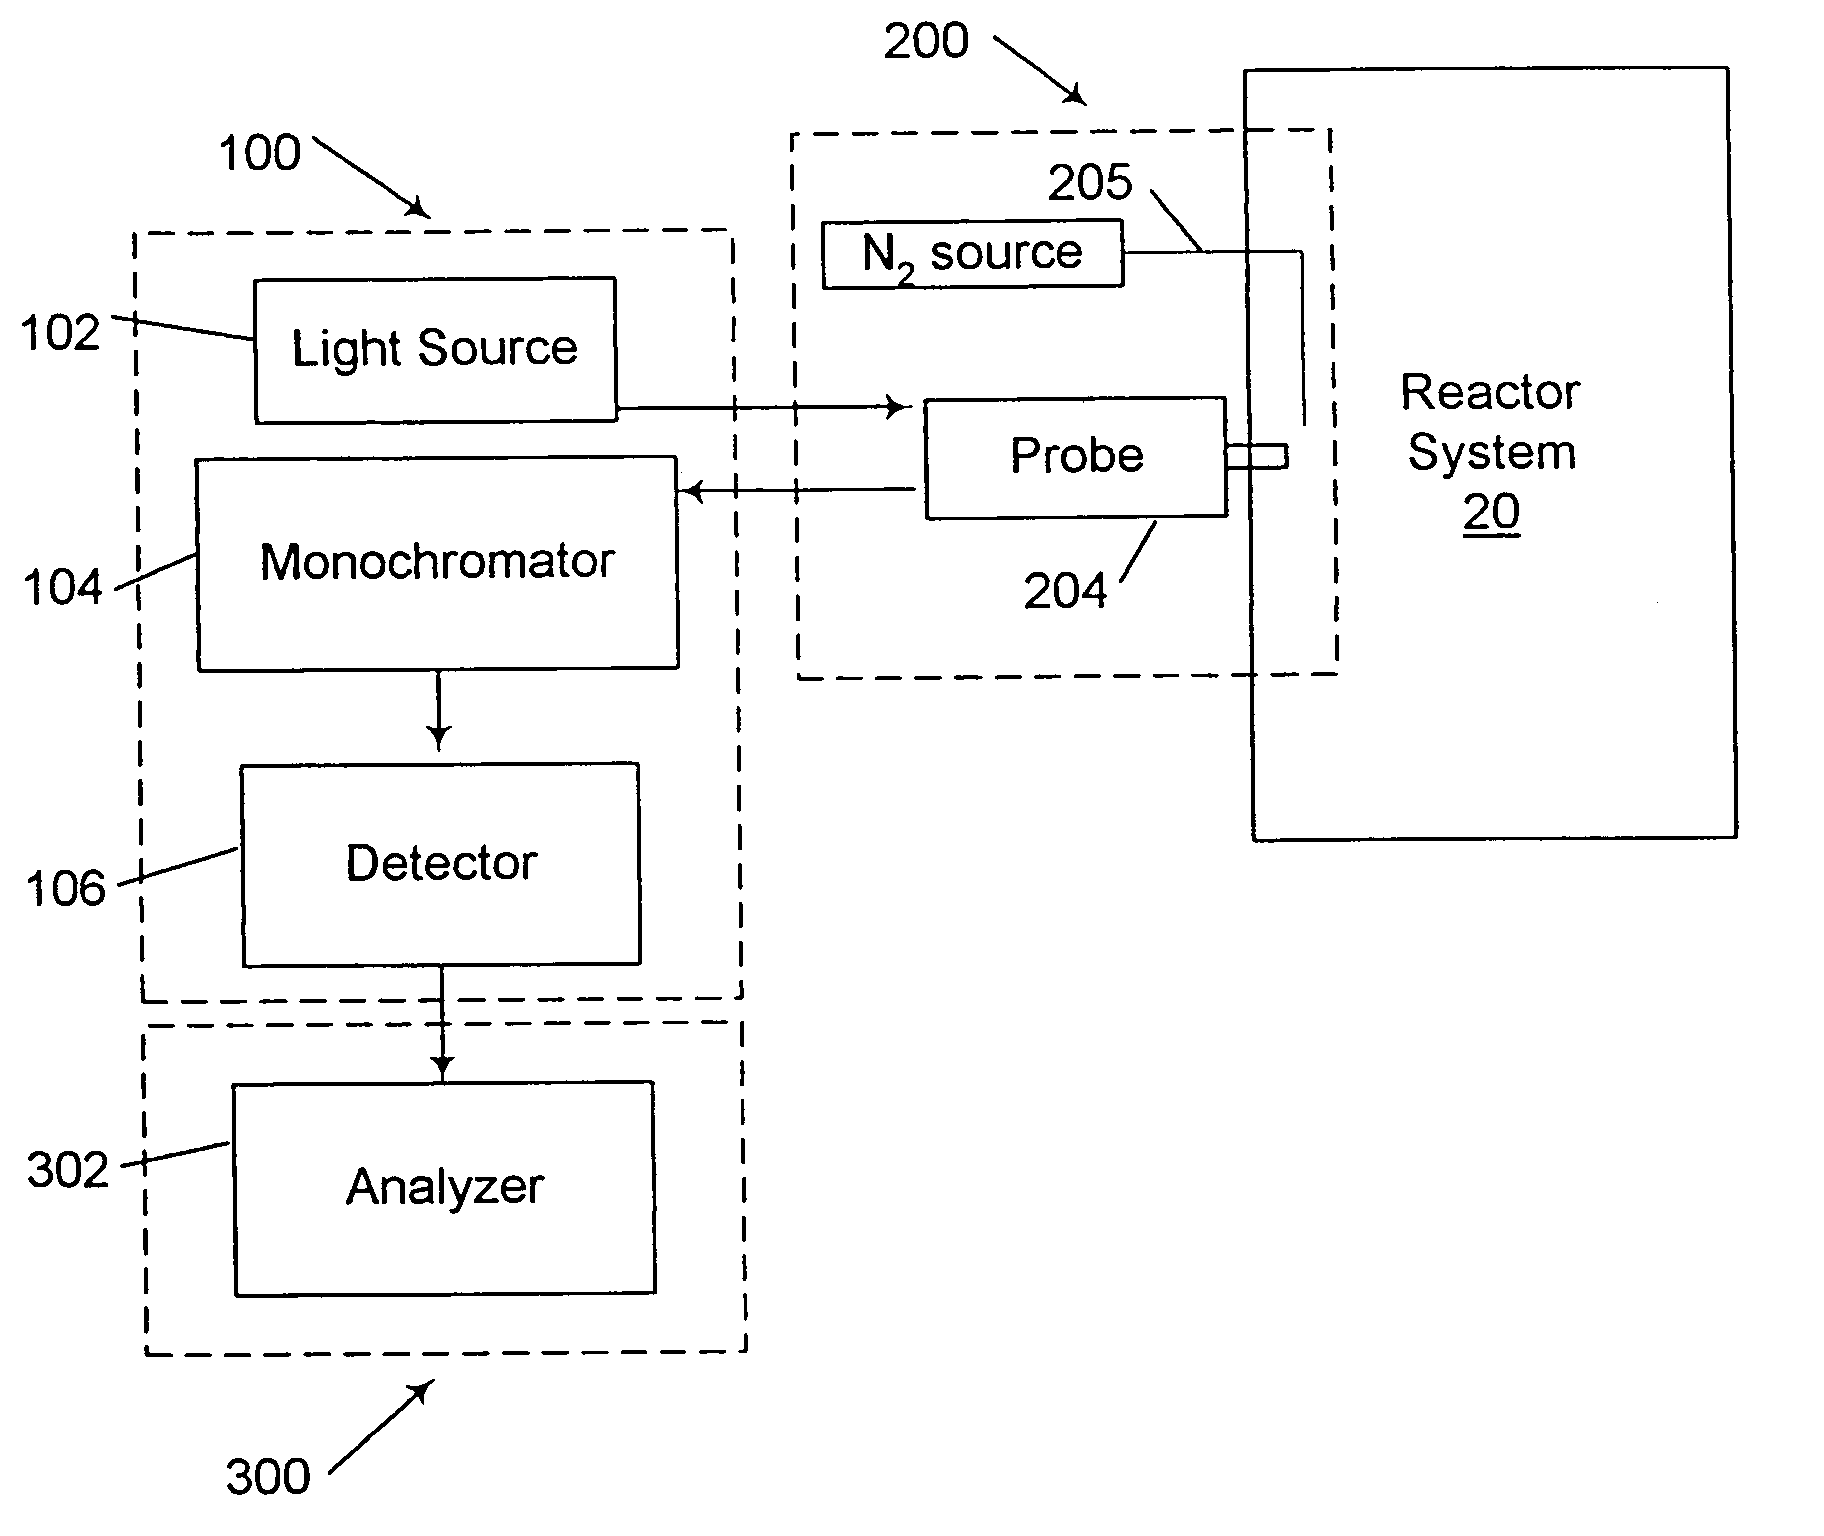
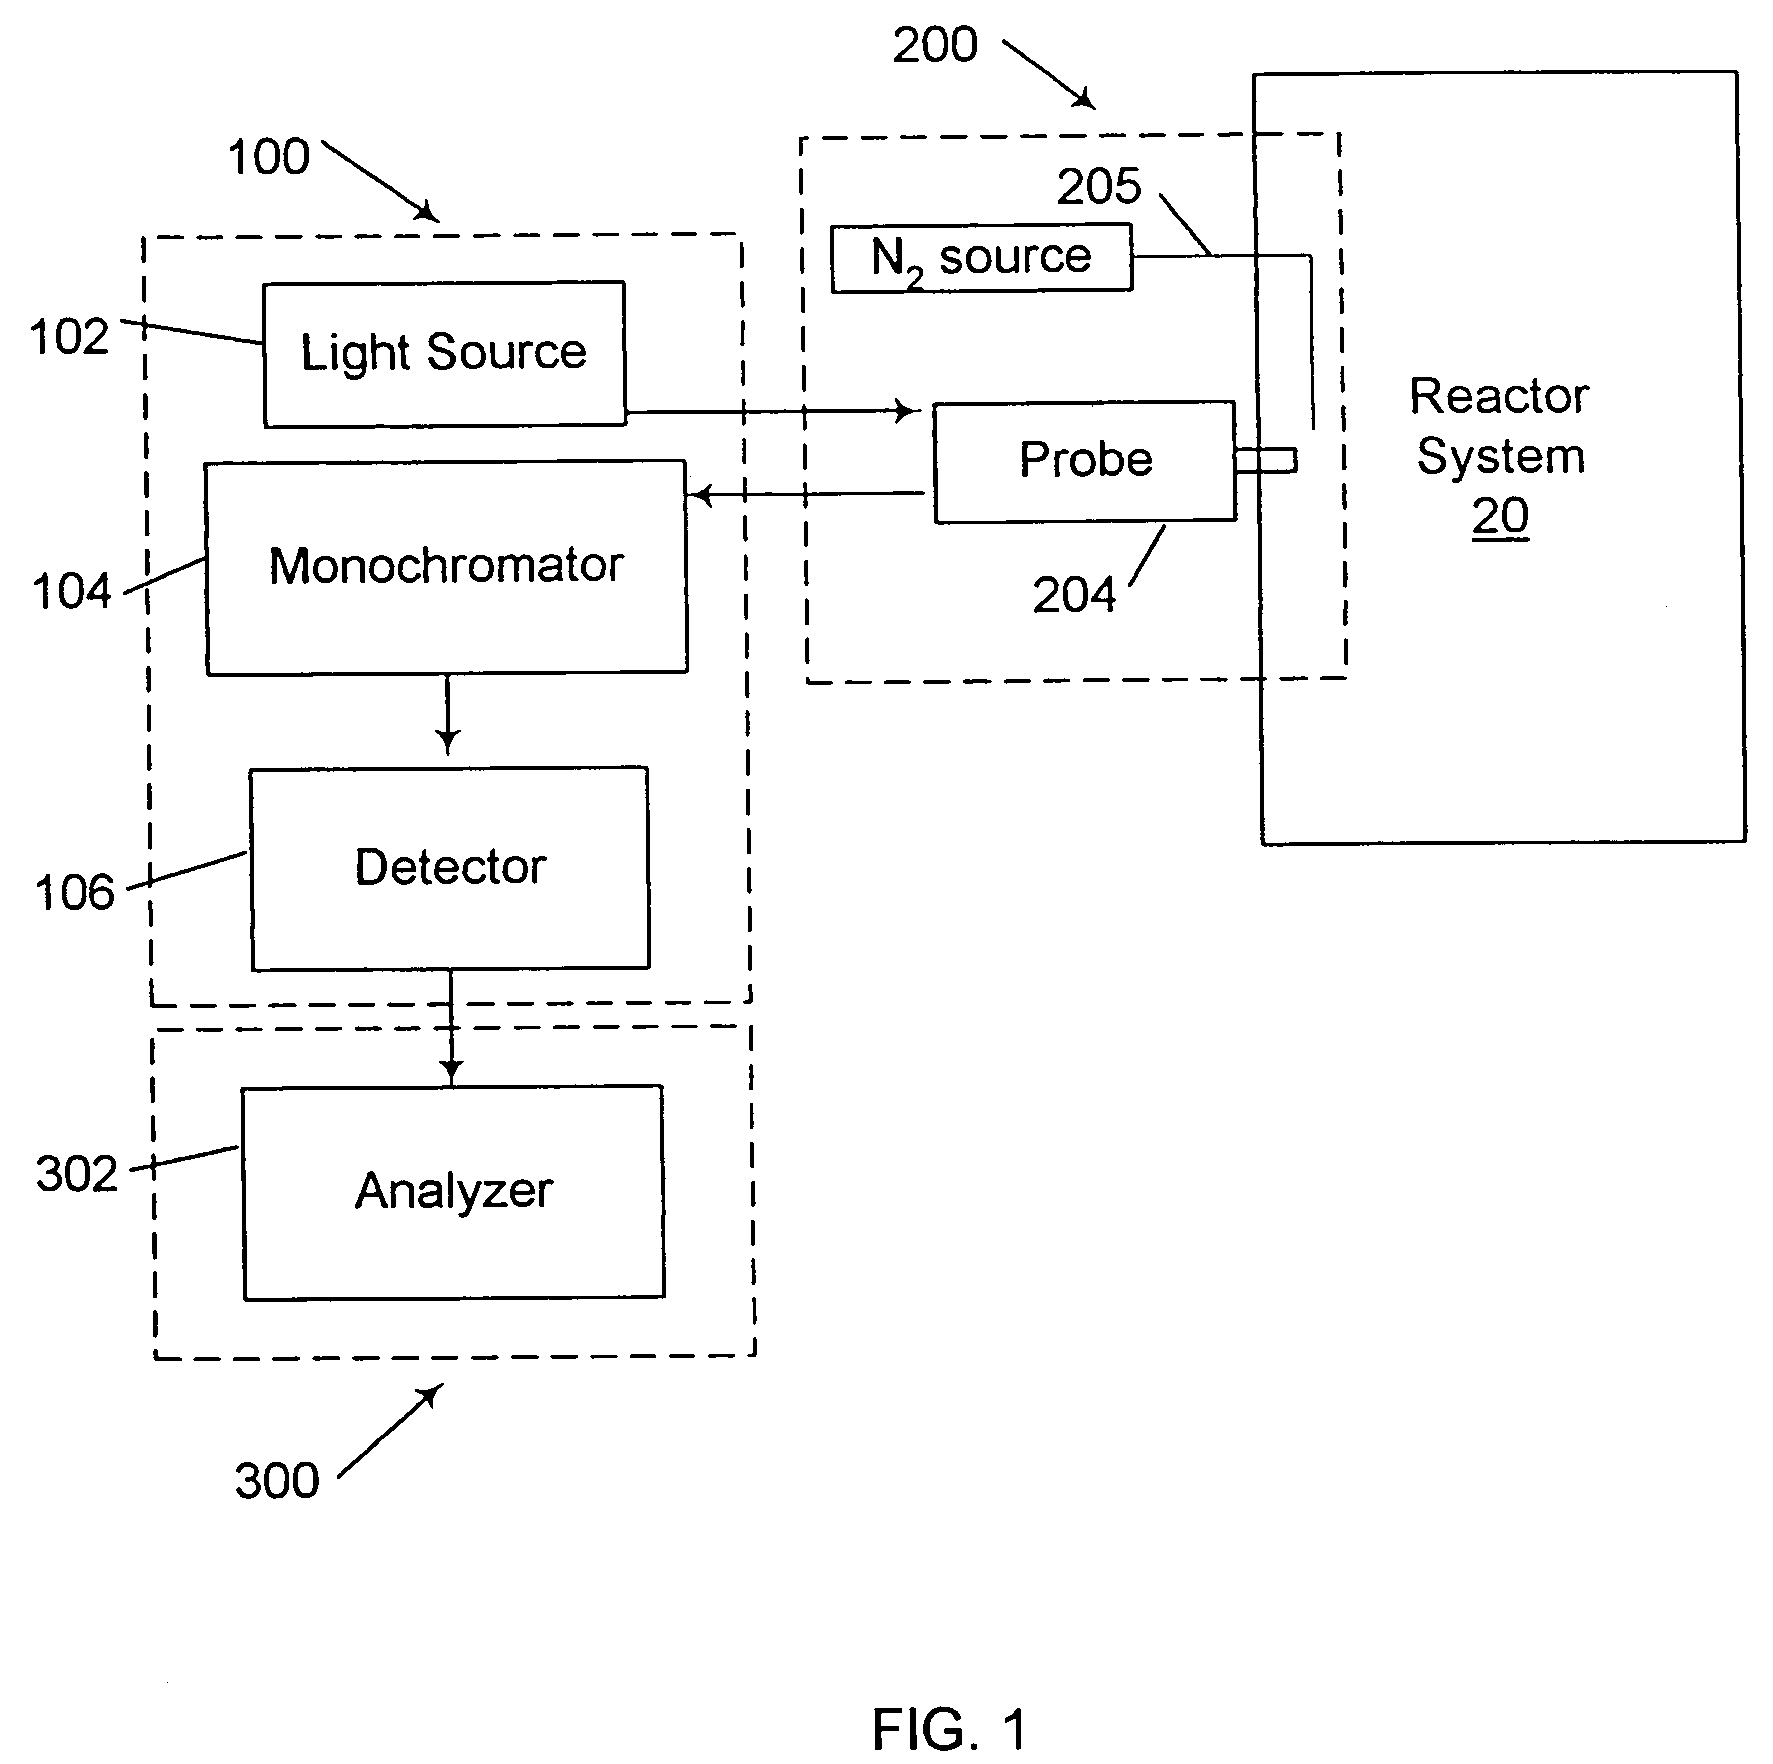
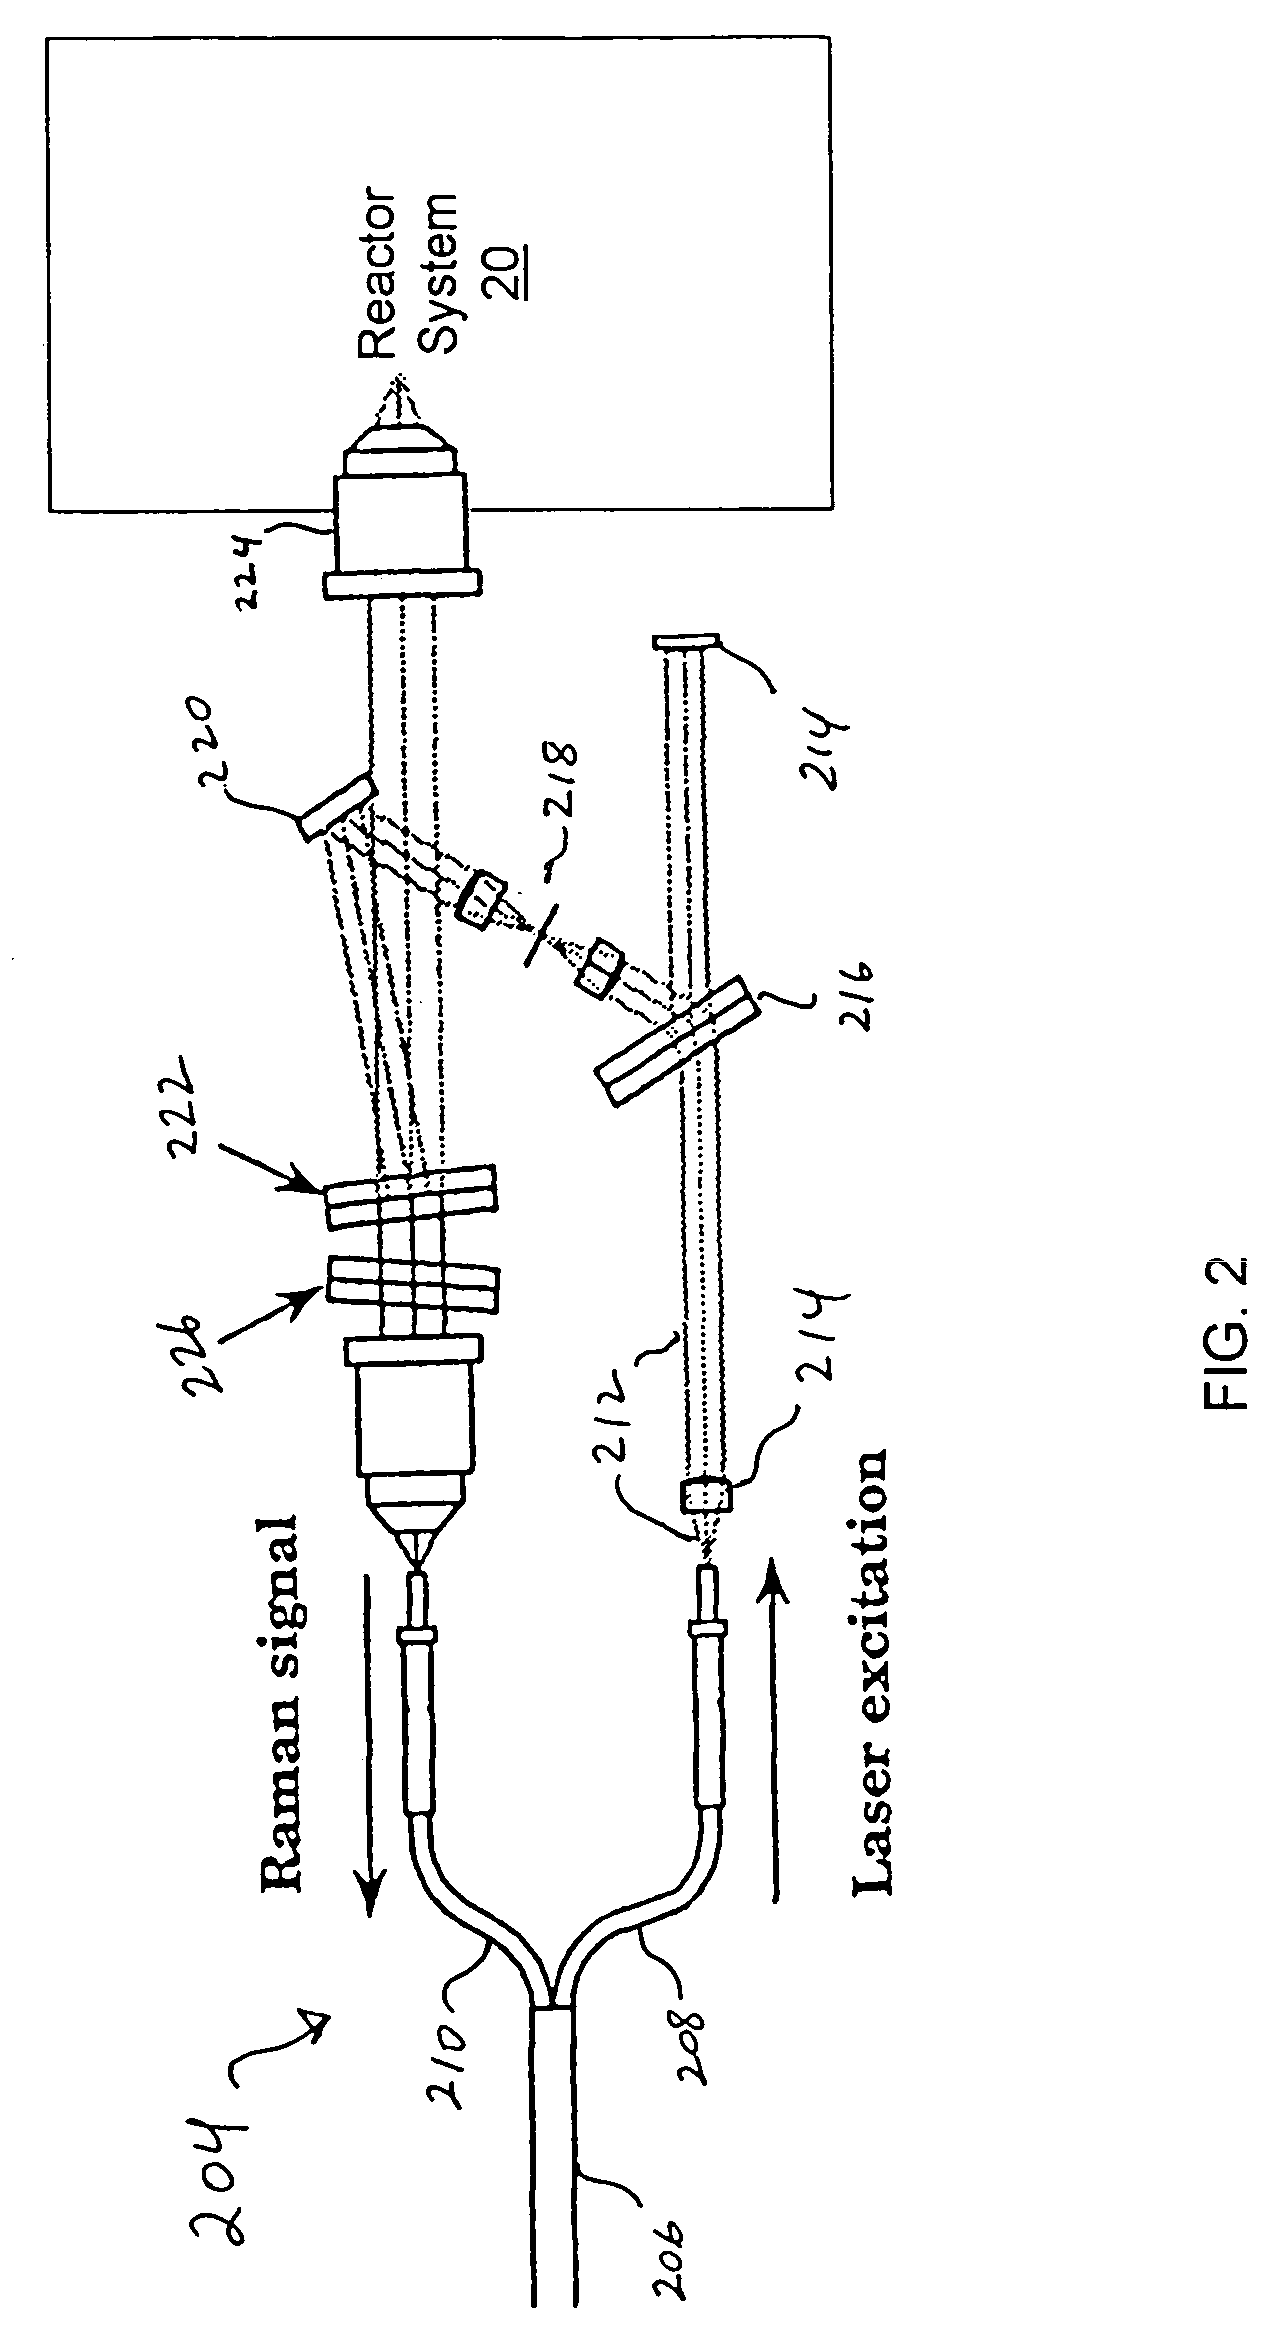
[0089]The Raman system used for Examples 1–2 was a Kaiser Optical Holoprobe Process Raman Analyzer, available from Kaiser Optical Systems, Inc., Ann Arbor, Mich. The Raman system used a 125 mW diode laser operating at 785 nm, and was equipped with a probe with 2.5 (6.3 cm) inch imaging optics fiber-optically coupled to the instrument, a holographic notch filter, holographic dispersion grating, cooled CCD detector (−40° C.), and computer for analyzer control and data analysis. A more complete description of this commercial instrument can be found in “Electro-Optic, Integrated Optic, and Electronic Technologies for Online Chemical Process Monitoring,”Proceedings SPIE, vol. 3537, pp. 200–212 (1998), the disclosure of which is incorporated herein by r...

example 1

Melt Index

[0093]Eighty-five polymer samples were used. Each sample was an HDPE resin, in a melt index range of from about 0.35 to about 0.65 g / 10 min, and a density range of about 0.952 to 0.963 g / cm3. Raman spectra and laboratory melt index measurements were collected as described above.

[0094]The lab values of melt index and the corresponding Raman spectra were used to create a locally-weighted regression model for melt index, using principal component loadings and principal component scores. The measured values of melt index (i.e., values obtained according to ASTM D-1238, condition 190° C., 2.16 kg), predicted values of melt index obtained from the model, and deviation (predicted minus measured, denoted “Δ MI”) are shown in Table 1. The results are also shown graphically in FIG. 3. The line in the Figure is the model prediction. The calculated R2 value was 0.994, with a standard error of 0.01 g / 10 min.

[0095]

TABLE 1Melt Index CalibrationMI (Lab)MI (Model)Δ MI(dg / min)(dg / min)(dg / mi...

example 2

Density

[0096]An analysis was carried out as in Example 1, using density rather than melt index as the predicted property. The same samples as in Example 1 were evaluated. Raman spectra and laboratory density measurements were collected as described above. The lab values of density (i.e., measured in accordance with ASTM D1505 and ASTM D1928, procedure C) and the corresponding Raman spectra were used to create a locally-weighted regression model for density, using principal component loadings and principal component scores. The measured densities, predicted densities, and deviations (i.e., predicted minus measured densities, denoted “Δρ”) are shown in Table 2. The results are also shown graphically in FIG. 4. The line in the Figure is the model prediction. The calculated R2 value was 0.997, with a standard error of 0.0003 g / cm3.

[0097]

TABLE 2Density Calibrationρ (Lab)ρ (Model)Δρρ (Lab)ρ (Model)Δρ(g / cm3)(g / cm3)(g / cm3)(g / cm3)(g / cm3)(g / cm3)0.95470.954800.000100.96090.960980.000080.95470....


PUM

PropertyMeasurementUnit
weight percentaaaaaaaaaa
densityaaaaaaaaaa
densityaaaaaaaaaa

Abstract

Methods are provided for determining and controlling polymer product properties on-line in a slurry reactor system, such as a stirred slurry or slurry loop reactor. The methods include obtaining a regression model for determining a polymer product property, the regression model including principal component loadings and principal component scores, acquiring a Raman spectrum of polymer product in the slurry reactor system, calculating a new principal component score from at least a portion of the Raman spectrum and the principal component loadings, and calculating the polymer product property by applying the new principal component score to the regression model. The property can be controlled by adjusting at least one polymerization parameter based on the calculated polymer product property.

Description

1. CROSS-REFERENCE TO RELATED APPLICATIONS[0001]The present application claims the benefit of U.S. Provisional Application No. 60 / 438,132, filed Jan. 6, 2003, said application incorporated herein by reference.2. FIELD OF THE INVENTION[0002]The present invention is directed generally to methods of measuring polymer product properties on-line in a slurry reactor, and using those measured properties to control the polymerization reaction. In particular, the present invention provides methods of measuring properties of polyolefins such as melt index and density on-line, using Raman spectroscopy, and methods of controlling a reactor using real-time, on-line polymer product property data provided by Raman spectroscopic measurements.3. BACKGROUND[0003]Slurry processes for the homopolymerization and copolymerization of monomers, especially olefin monomers, are well known in the art. Such processes can be conducted, for example, by introducing the monomer or monomers into a stirred and / or ci...

Claims


Application Information

Patent Timeline
Patent Type & Authority Patents(United States)
IPC IPC(8): G01J3/44G01N21/65C08F2/00C08F2/12C08F110/02
CPCB01J8/1809B01J8/20B01J19/2435C08F110/02C08F2/00C08F2400/02C08F2500/07C08F2500/12
Inventor MARROW, DAVID GEOFFREYCOCHRAN, ANDREW M.ROGER, SCOTT THOMAS
Owner EXXONMOBIL CHEM PAT INC
Why Eureka
Try Eureka