
Surveillance and table driven reporting tool

Inactive Publication Date: 2007-09-25
CINGULAR WIRELESS II LLC
View PDF11 Cites 81 Cited by
  • Summary
  • Abstract
  • Description
  • Claims
  • Application Information

AI Technical Summary

Benefits of technology

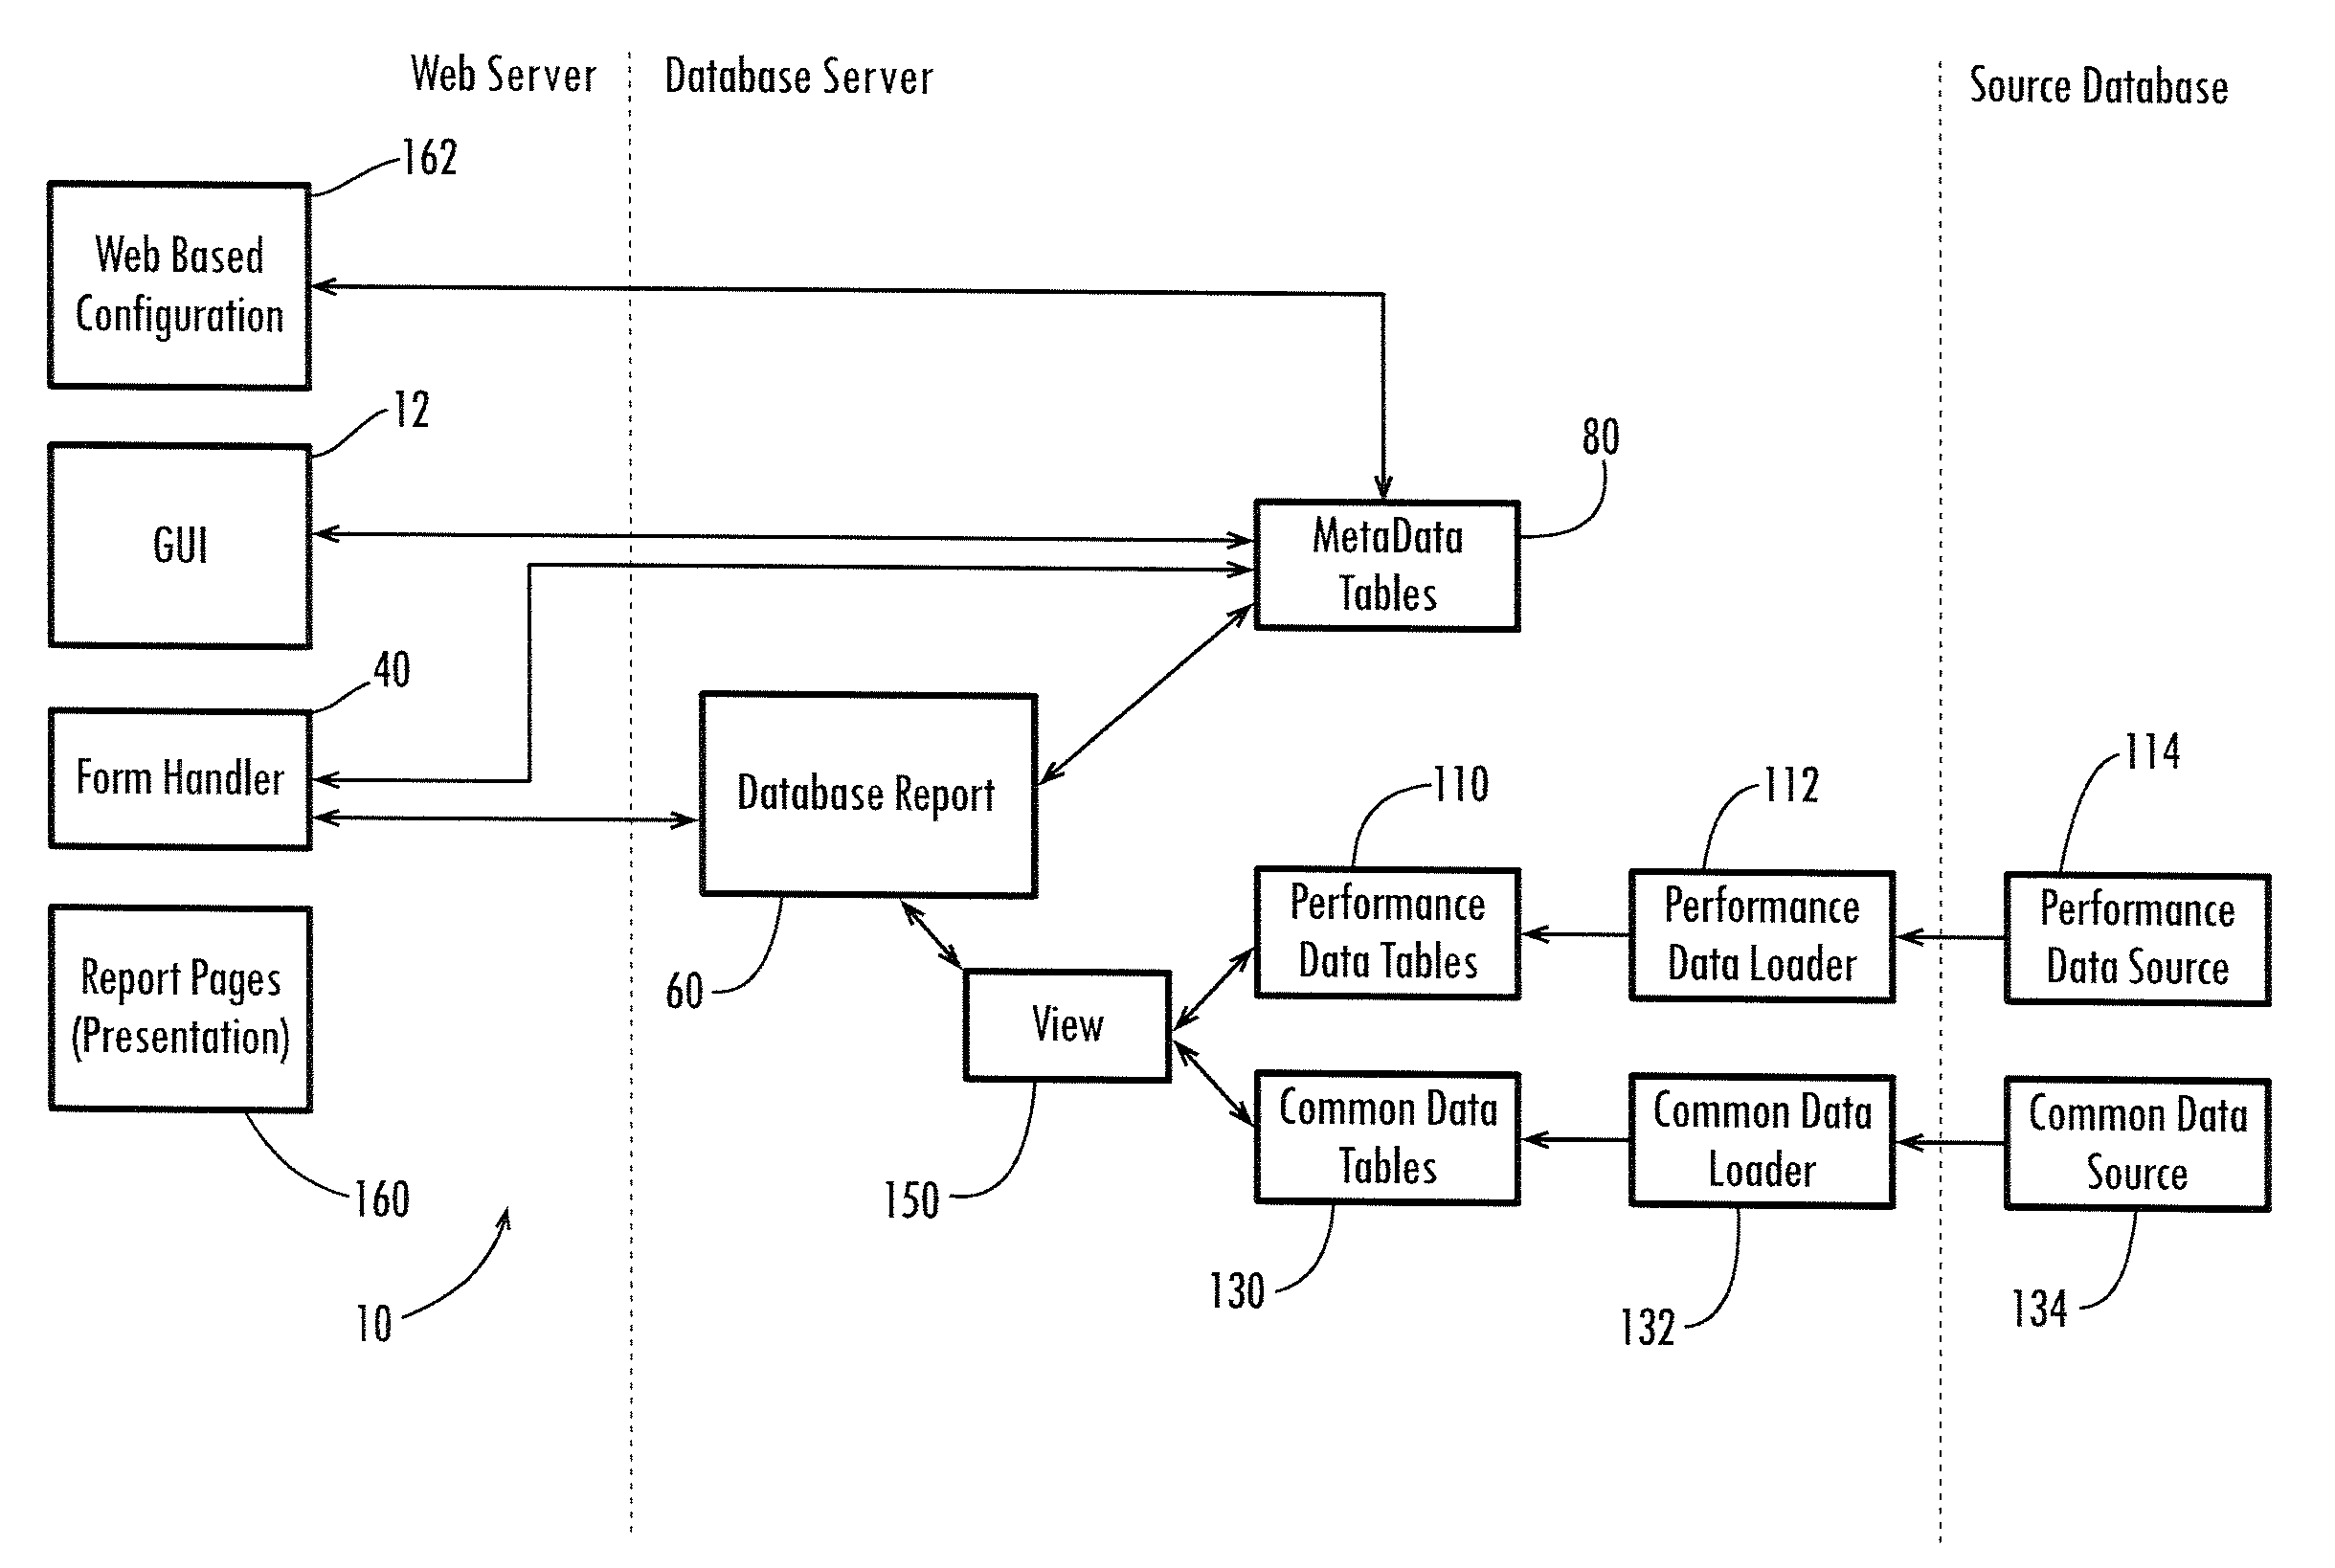
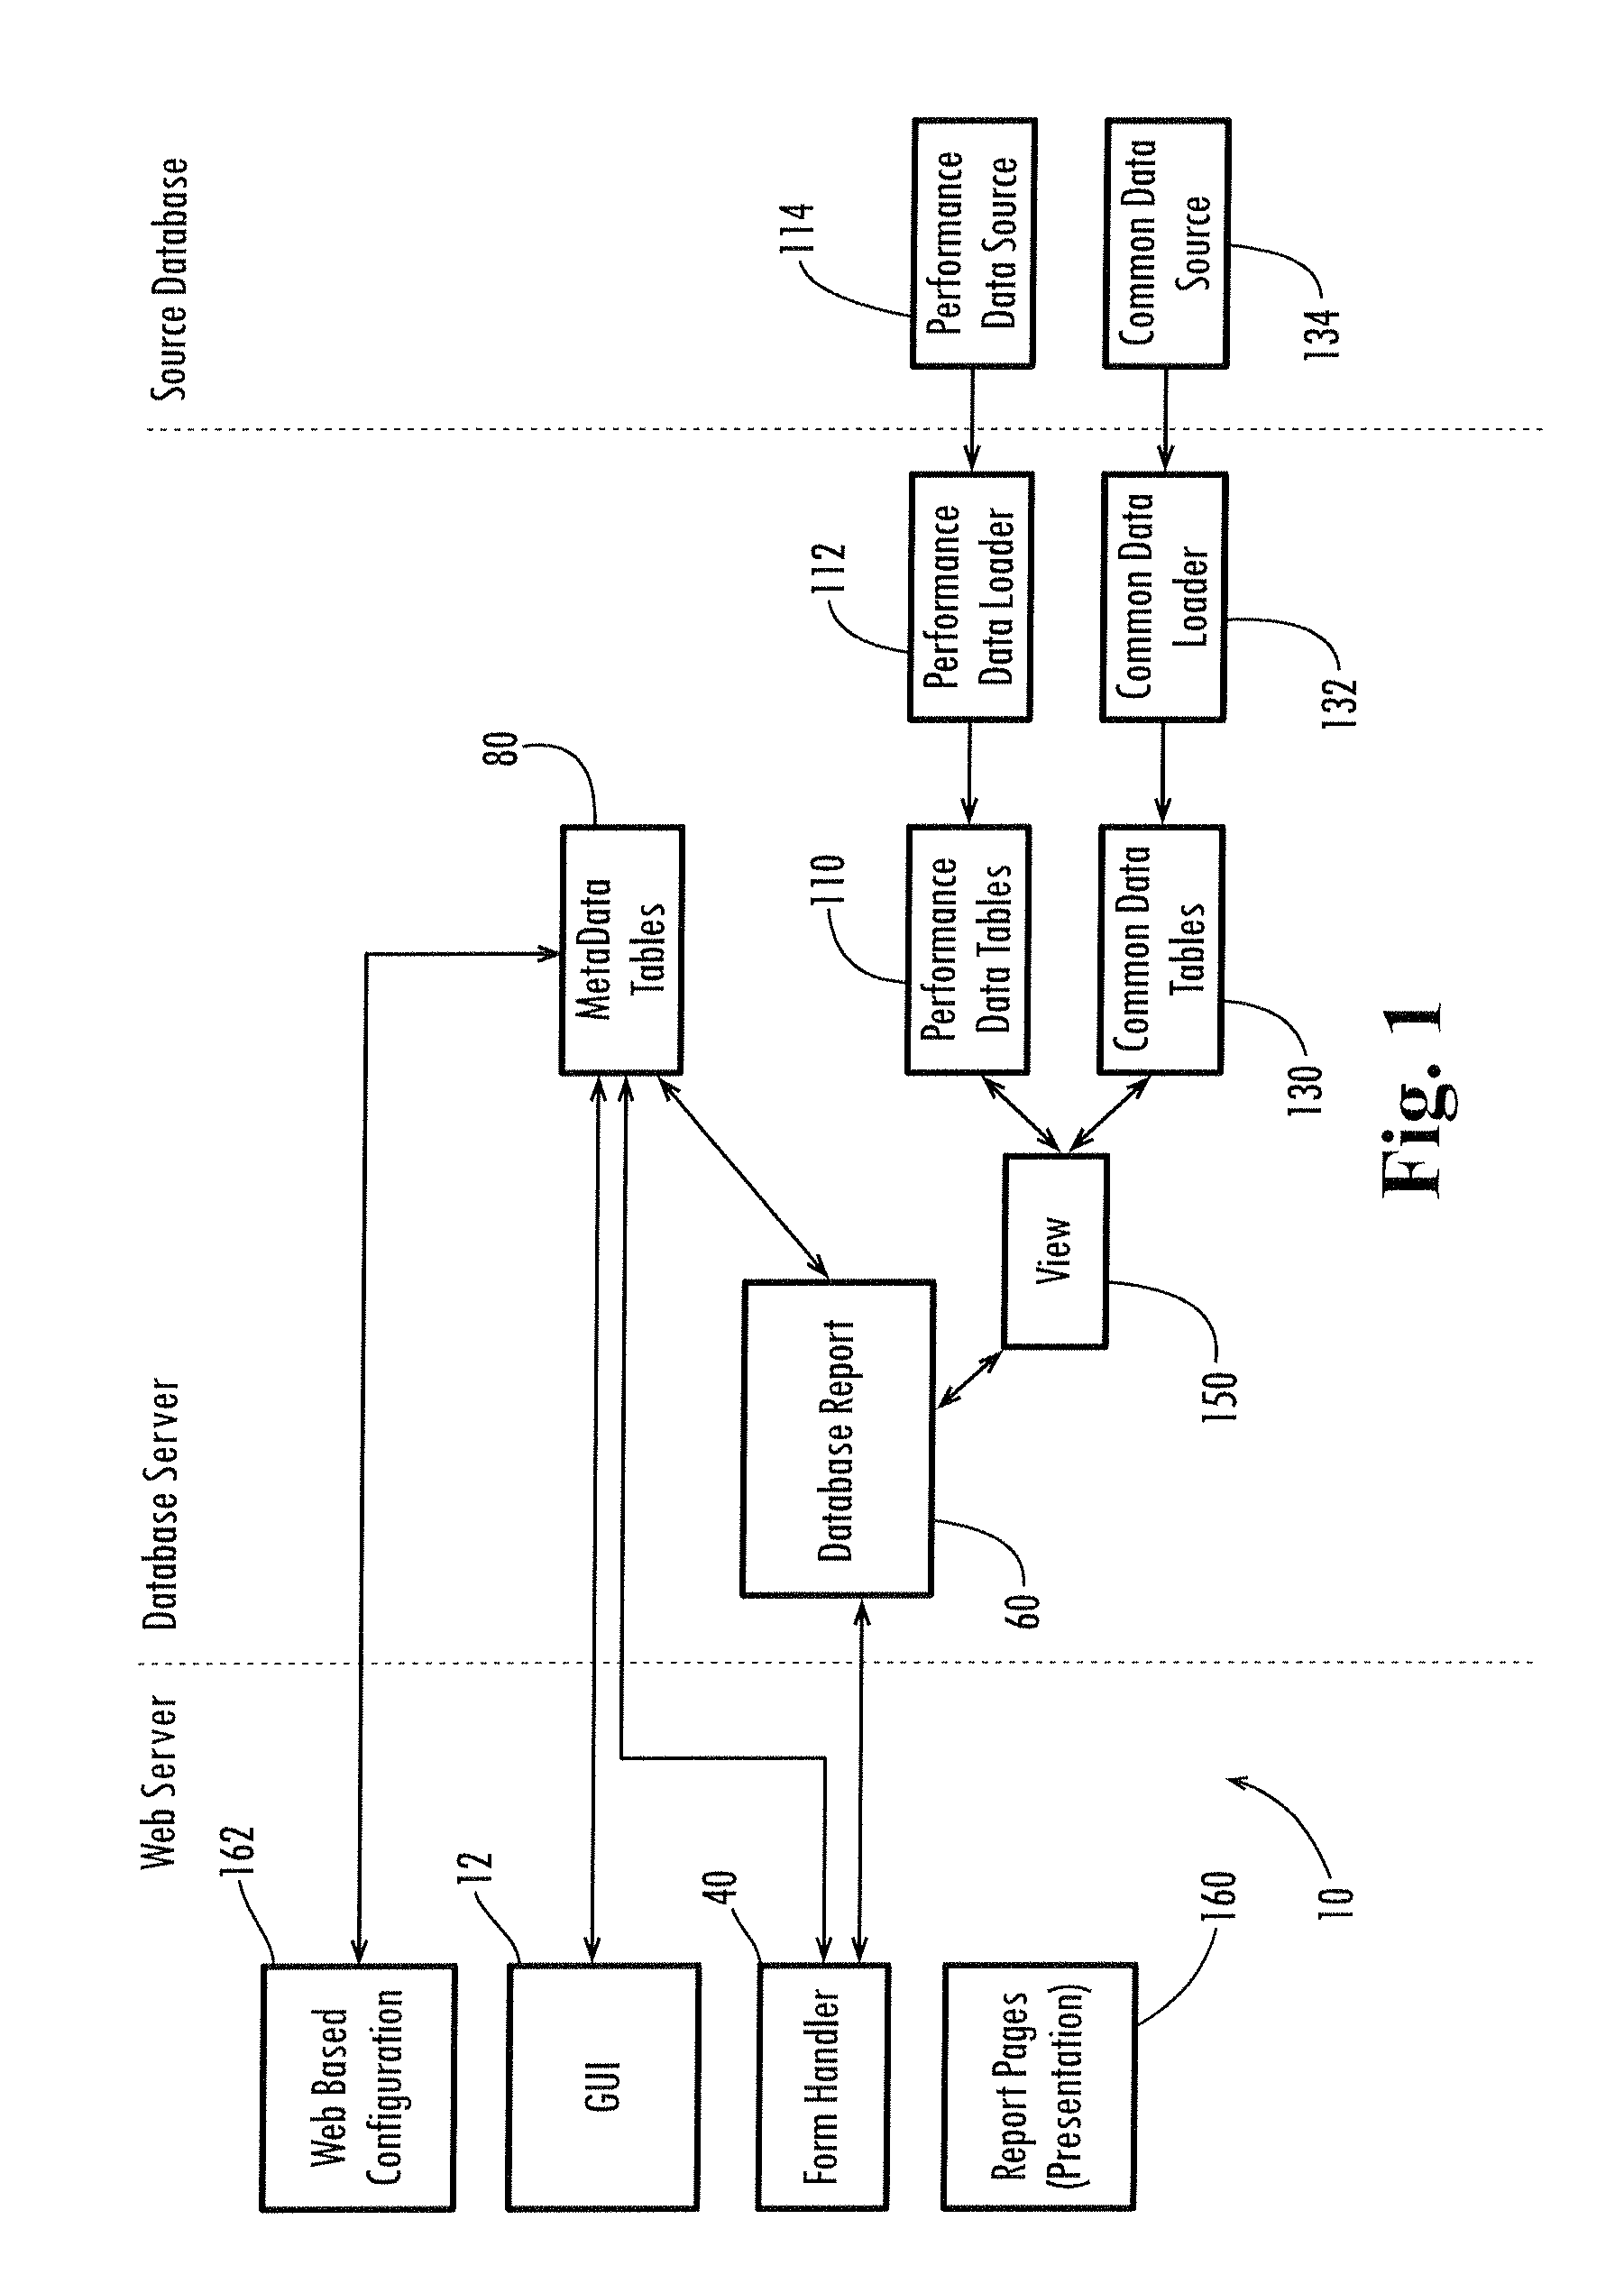
[0009]The problems identified above, and more, are solved by the Surveillance and Reporting System (SRS) described herein. The SRS is designed to provide web based reporting of statistical data relating to real time performance of network devices within one or more network systems of different types, combined with current identifying data for each of those network devices and systems, in a table based reporting system that enables customized network reports on real time system and device performance to be generated at selected, contemporaneous intervals (“pseudo” real time performance reports). The SRS allows the same reporting process to be used for multiple statistical data sources relating to different types of network systems and devices, each configured for reporting. Statistical data for each system is retrieved, restructured and aggregated in multiple ways based on user needs and practices, and stored on a database server, where it can be linked with related identifying data for the network devices within each system, and warehoused together on a data base server in a manner available for reporting in tabular form. The data can then be retrieved separately for each linked network device or combined with other data relating to other system devices to generate reports on network system performance. The SRS enables the web user to request customized reports for each different system, including the individual or aggregated devices within the system, using common database search elements that are adapted by the SRS to generate uniform reports from each different network system from which data is collected and stored.
[0012]The SRS also is highly enriched by the addition of a common data source to the statistical measurement data. This common data contains information about the reported network devices usually not available in the system statistical data, that allows the combined data to be grouped by and filter on various managed areas. Engineers can thus easily and quickly set the reporting to limit the reported network devices to only the ones within their responsibility. Managers likewise can generate either higher level summary report listing the same statistics for all of the network systems, the network system for which they have responsibility, or grouped by each network device or employee within their area of responsibility.
[0014]The SRS's table driven configuration data eliminates the need for constant code changes to accommodate changes in underlying statistical and common data. These changes are made in the underlying data bases and are incorporated into the stored tabular data as the stored tabular data is updated. Additionally, prior tables may be archived to provide reference to historical data, even though the underlying data bases have been changed.
[0018]The SRS's Web based output enables users flexibility in configuration of reports and provides multiple formats for report output. Additionally, the same report generation procedures are available for multiple types of report output.

Problems solved by technology

A problem that exists for these network management reporting systems is that the data pertaining to the identity of the sources may be incomplete or may change from time to time requiring the network management reporting program to be changed.
Such changes may require extensive reprogramming to accommodate changes in the underlying data and extensive revision of report procedures and changes in computer programming code.
Another problem associated with network management reporting systems is that adding additional sources also may require changes in programming.
Another problem of network management reporting systems is that in order to obtain custom reports, changes must be made in the programming of the report procedures to select new criteria and to enable sorting and filtering based upon these new criteria.
Programming changes are either time consuming to the database user (thereby creating an environment in which the currency or completeness of the underlying data may be questionable), or beyond the capability of typical end-user who simply wants report results.
Unless the network management reporting system data can be kept up to date and complete without undue time and expense, its value as a real time or contemporaneous reporting system is severely limited.

Method used


Image

  • Surveillance and table driven reporting tool
  • Surveillance and table driven reporting tool
  • Surveillance and table driven reporting tool

Examples


Embodiment Construction

[0029]Referring now in more detail to the drawings, wherein like numbers refer to like parts or steps throughout the several views, FIG. 1 shows a surveillance and reporting system (SRS) 10 embodying the present invention. For purposes of illustration and not limitation, the SRS 10 shown herein is configured to provide surveillance and web-based reporting of internal-based counter data related to the south region network architecture of a wireless communication provider such as the assignee of the present application.

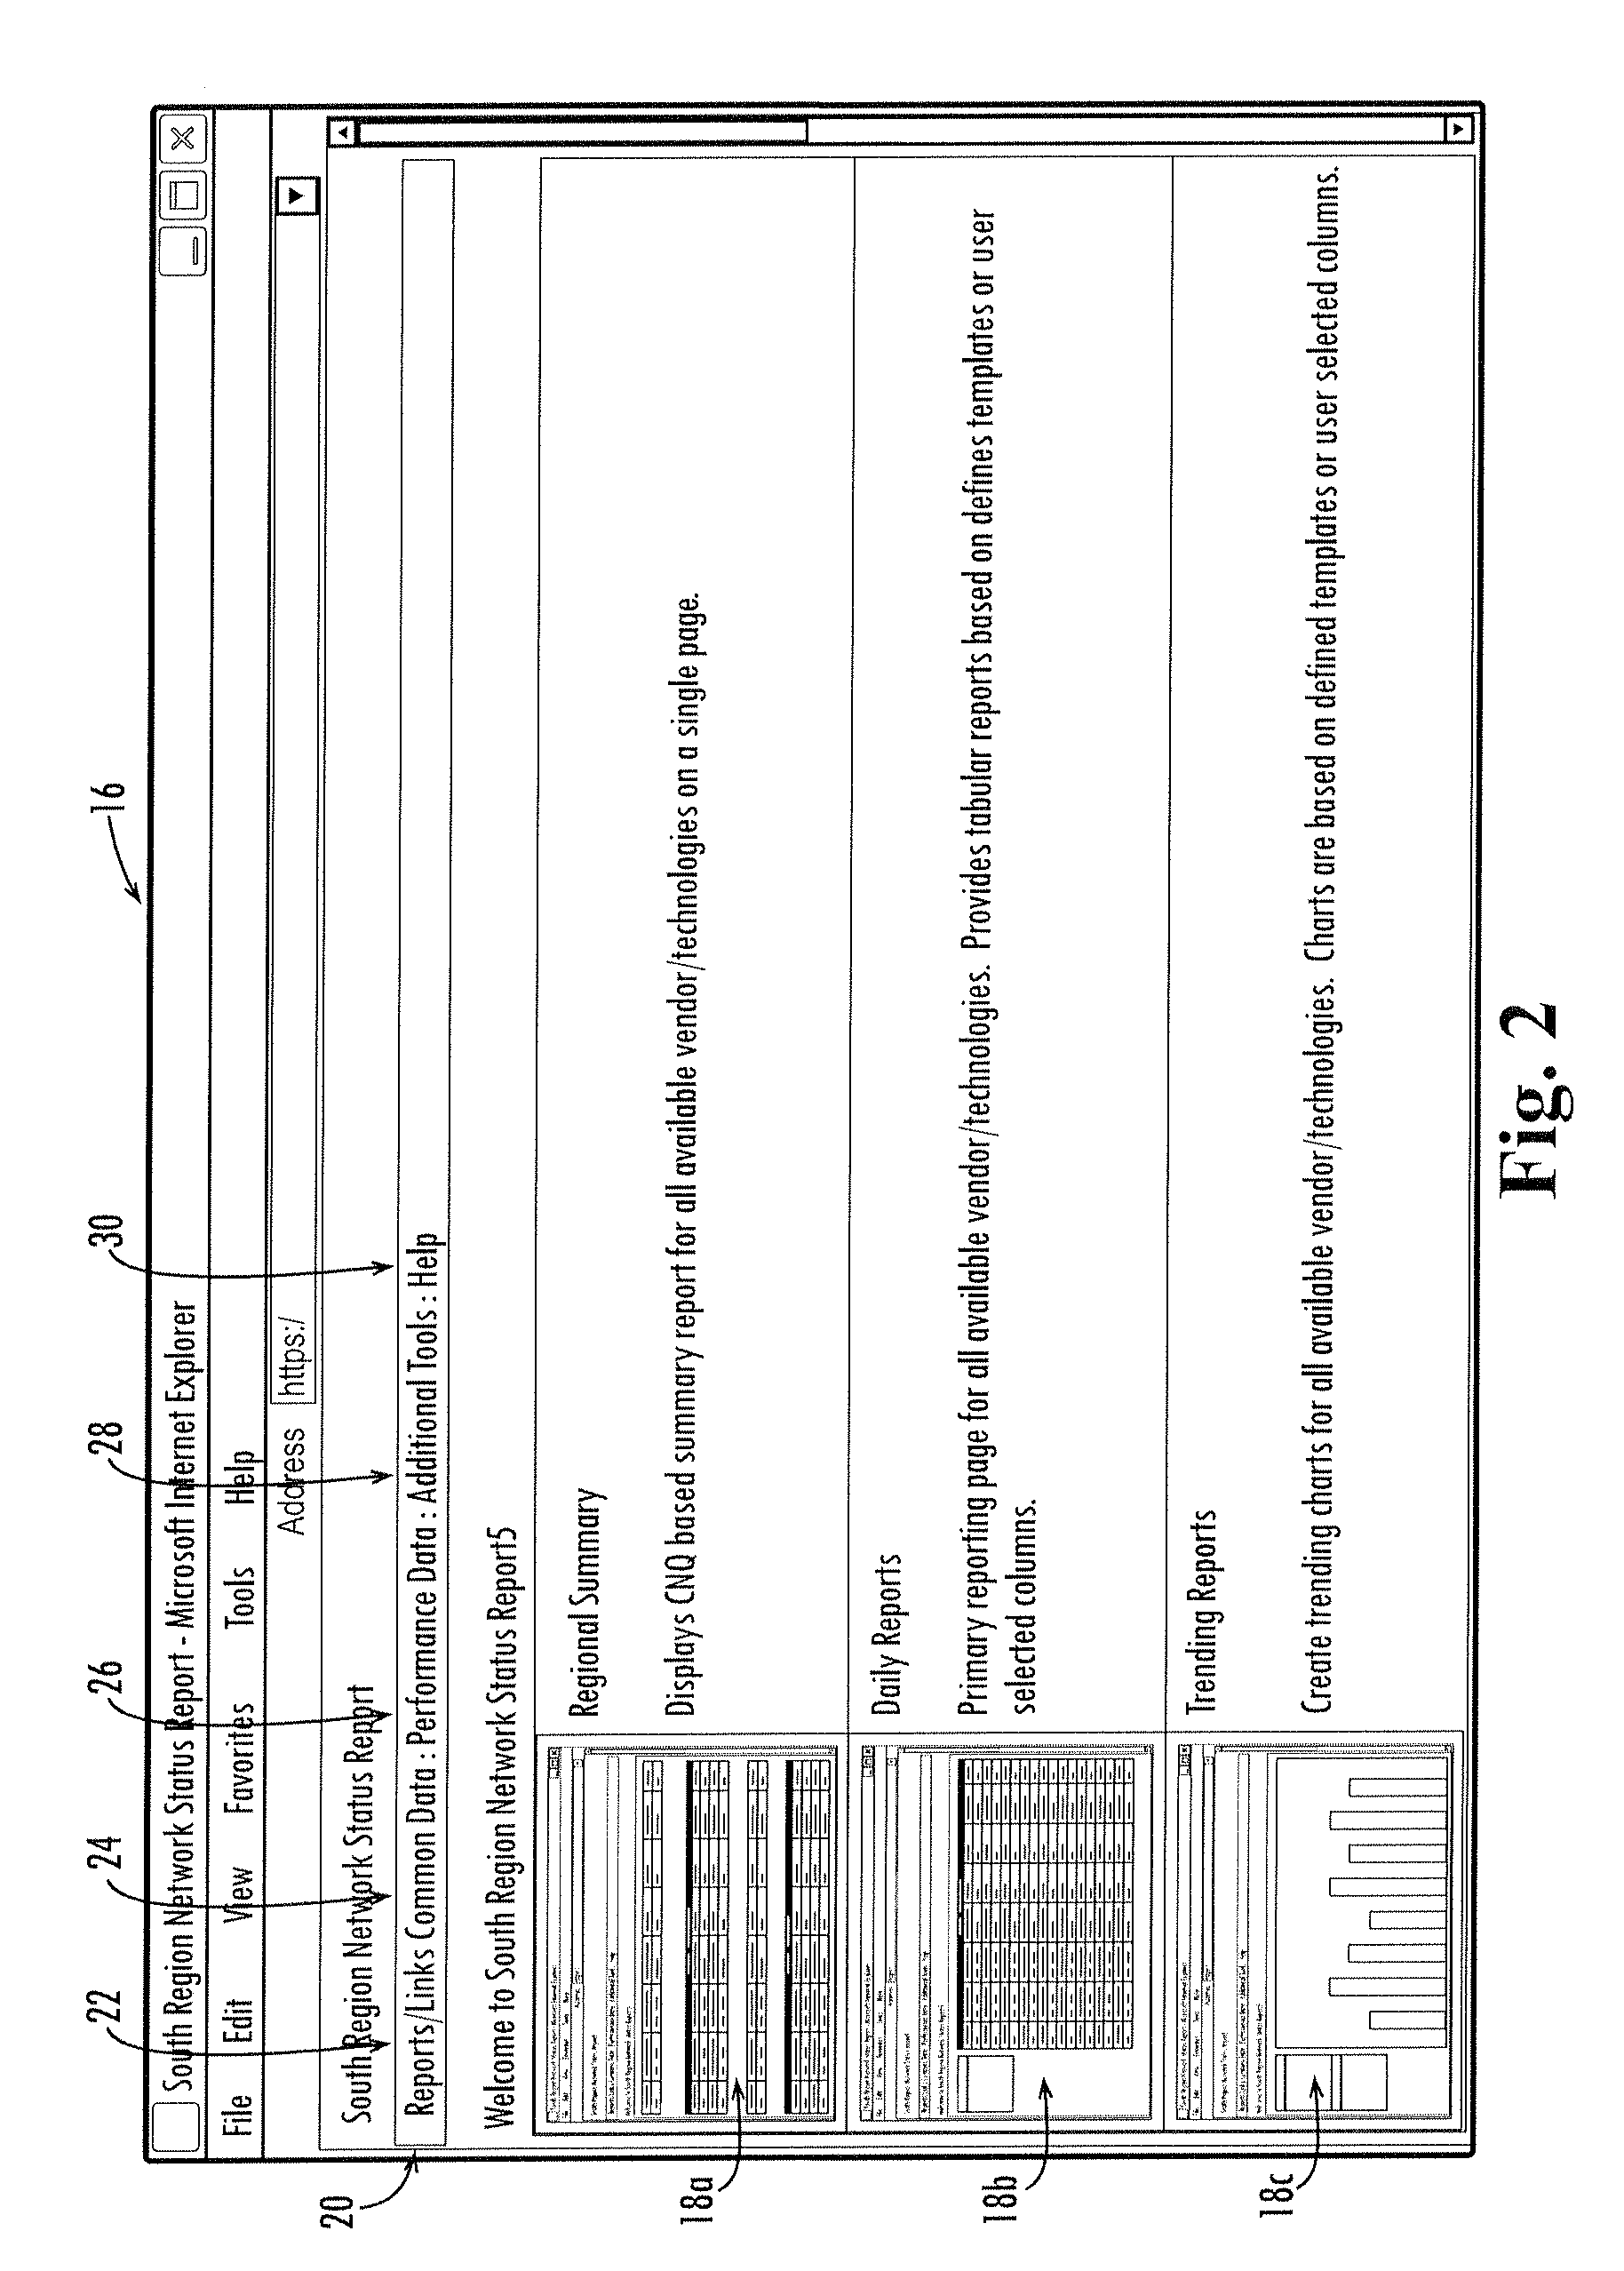
[0030]To initiate the reporting process, from the graphic user interface (GUI) 12, a user submits his or her request for an operational report through the HTML form 16 best illustrated in FIG. 2. The representative HTML form 16 provides a user the option of requesting and obtaining a pre-configured operational report 18a-c generated from a pre-selected data source category, such as but not limited to: Regional Summary, Daily Reports, Trending Reports, Delta Analysis (co...


PUM


Abstract

A surveillance and reporting system (SRS) is provided that enables a user to monitor and generate reports from multiple related sources pertaining to events associated with each of these sources. The SRS is internet based, thereby providing access to remote users. The SRS also provides for identification of the sources by combining multiple databases related to each source in a tabular form in order to enable generation of complete reports and in order to enable sorting and filtering based upon more extensive source identification criteria. The SRS also accommodates changes in the underlying identification data by revising or generating up to date tables containing current identifying data for each of the multiple sources in a tabular form, thereby avoiding the need to reprogram the report procedures as a result of changes in the underlying data. The internet user may configure reports from a control panel that allows the user to select and to group multiple sources and to filter and sort data relating to the statistical performance of those sources with the most recent up to date information generated from each of the multiple sources. The reports may be in the form of tables, graphs or charts. The user also may select to receive reports by electronic mail or some other medium for convenient reference.

Description

CROSS-REFERENCE TO RELATED APPLICATIONS[0001]This application claims priority to co-pending U.S. provisional application entitled “NETWORK STATUS REPORT TOOL,” having Ser. No. 60 / 407,071, filed Aug. 30, 2002, which is entirely incorporated herein by reference. This application also entirely incorporates by reference co-pending U.S. provisional application entitled, “NETWORK STATUS REPORT TOOL,” having Ser. No. 60 / 435,944, filed Dec. 20, 2002.BACKGROUND OF THE INVENTION[0002]1. Field of the Invention[0003]The present invention relates to the field of reporting statistical data pertaining to multiple sources and events. More specifically, the present invention relates to the generation of management reports relating to the performance of related devices or entities, whose identity and relationship may change over time.[0004]2. The Related Art[0005]Network management reporting systems exist as relational databases to generate reports relating to multiple sources and events. The known s...

Claims


Application Information

Patent Timeline
IPC IPC(8): G06F17/30
CPCH04L43/045Y10S707/99933
Inventor GARDNER, MICHAELSNYDER, BRADZEILER, TODD
Owner CINGULAR WIRELESS II LLC
Learn More