Statistical quality control of alarm occurrences

a technology of statistical quality control and alarm occurrences, applied in the direction of testing/monitoring control systems, instruments, horology, etc., can solve the problems of fundamental difficulty in interpreting the plot of alarm occurrences, loss of effectiveness at controlling the plant, and inability to accurately indicate the number of alarms.

Inactive Publication Date: 2007-10-30
HUGO ALAN J
View PDF5 Cites 13 Cited by
  • Summary
  • Abstract
  • Description
  • Claims
  • Application Information

AI Technical Summary

Benefits of technology

[0027]It is a feature of the present invention to provide a method to effectively indicate the number of alarms presented to an operator of a process control system over time that accurately reflects the operating loading for these alarms. Another feather of the present invention is that the tracking system satisfies the requirements of standard statistical quality control techniques. Yet another feature is to provide a method to track the number of chattering alarms.
[0028]The techniques of this invention require transformations of the alarm data so that trends in the data are more apparent and the data follows more closely a normal distribution or a Poisson distribution. These transformations are based on sound engineering and ergonomic principles and have a strong intuitive appeal.

Problems solved by technology

A common problem in many plants is that many alarms from different measurements may occur close to one another in time, so that the operator is overwhelmed with alarms and loses effectiveness at controlling the plant.
Indeed, a contributing or direct cause of many plant upsets have been due to the overwhelming number of alarms that have been presented to the operator.
Statistical quality control techniques also imply a probabilistic quality to the measurement—a measurement may be outside acceptable limits due to chance alone, and not to some actual shift in the process.
There is a fundamental difficulty in interpreting the plot of alarm occurrences over time.
Interpretation of the run chart or control chart is difficult with the inclusion of the alarm chatters.
It is difficult to see any trend in the data, and the plot scaling is such that the number of alarms during “normal” operation are too small to be observed on the plot.
However, the run chart does not differentiate between a multitude of alarms from a chattering alarm and a multitude of alarms from different measurements, and therefore does not represent the true load on the operator.
It is possible to develop statistical quality control charts for certain non-normal distributions (Jacobs, 1990), but these are generally of the uni-modal distributions (i.e., Gamma or Poisson); there are no suitable statistical quality control techniques for multi-modal distributions such as shown in FIG. 2.
Furthermore, a chattering alarm may be thought of as an equipment failure, and these equipment failures are not apparent from the run chart of all alarm counts.
However, this technique looked at only a single alarm setting and process measurement at a time, did not consider the case of chattering alarms, and did not consider the total amount of alarms presented to the operator.

Method used


Image

  • Statistical quality control of alarm occurrences
  • Statistical quality control of alarm occurrences
  • Statistical quality control of alarm occurrences

Examples


Embodiment Construction

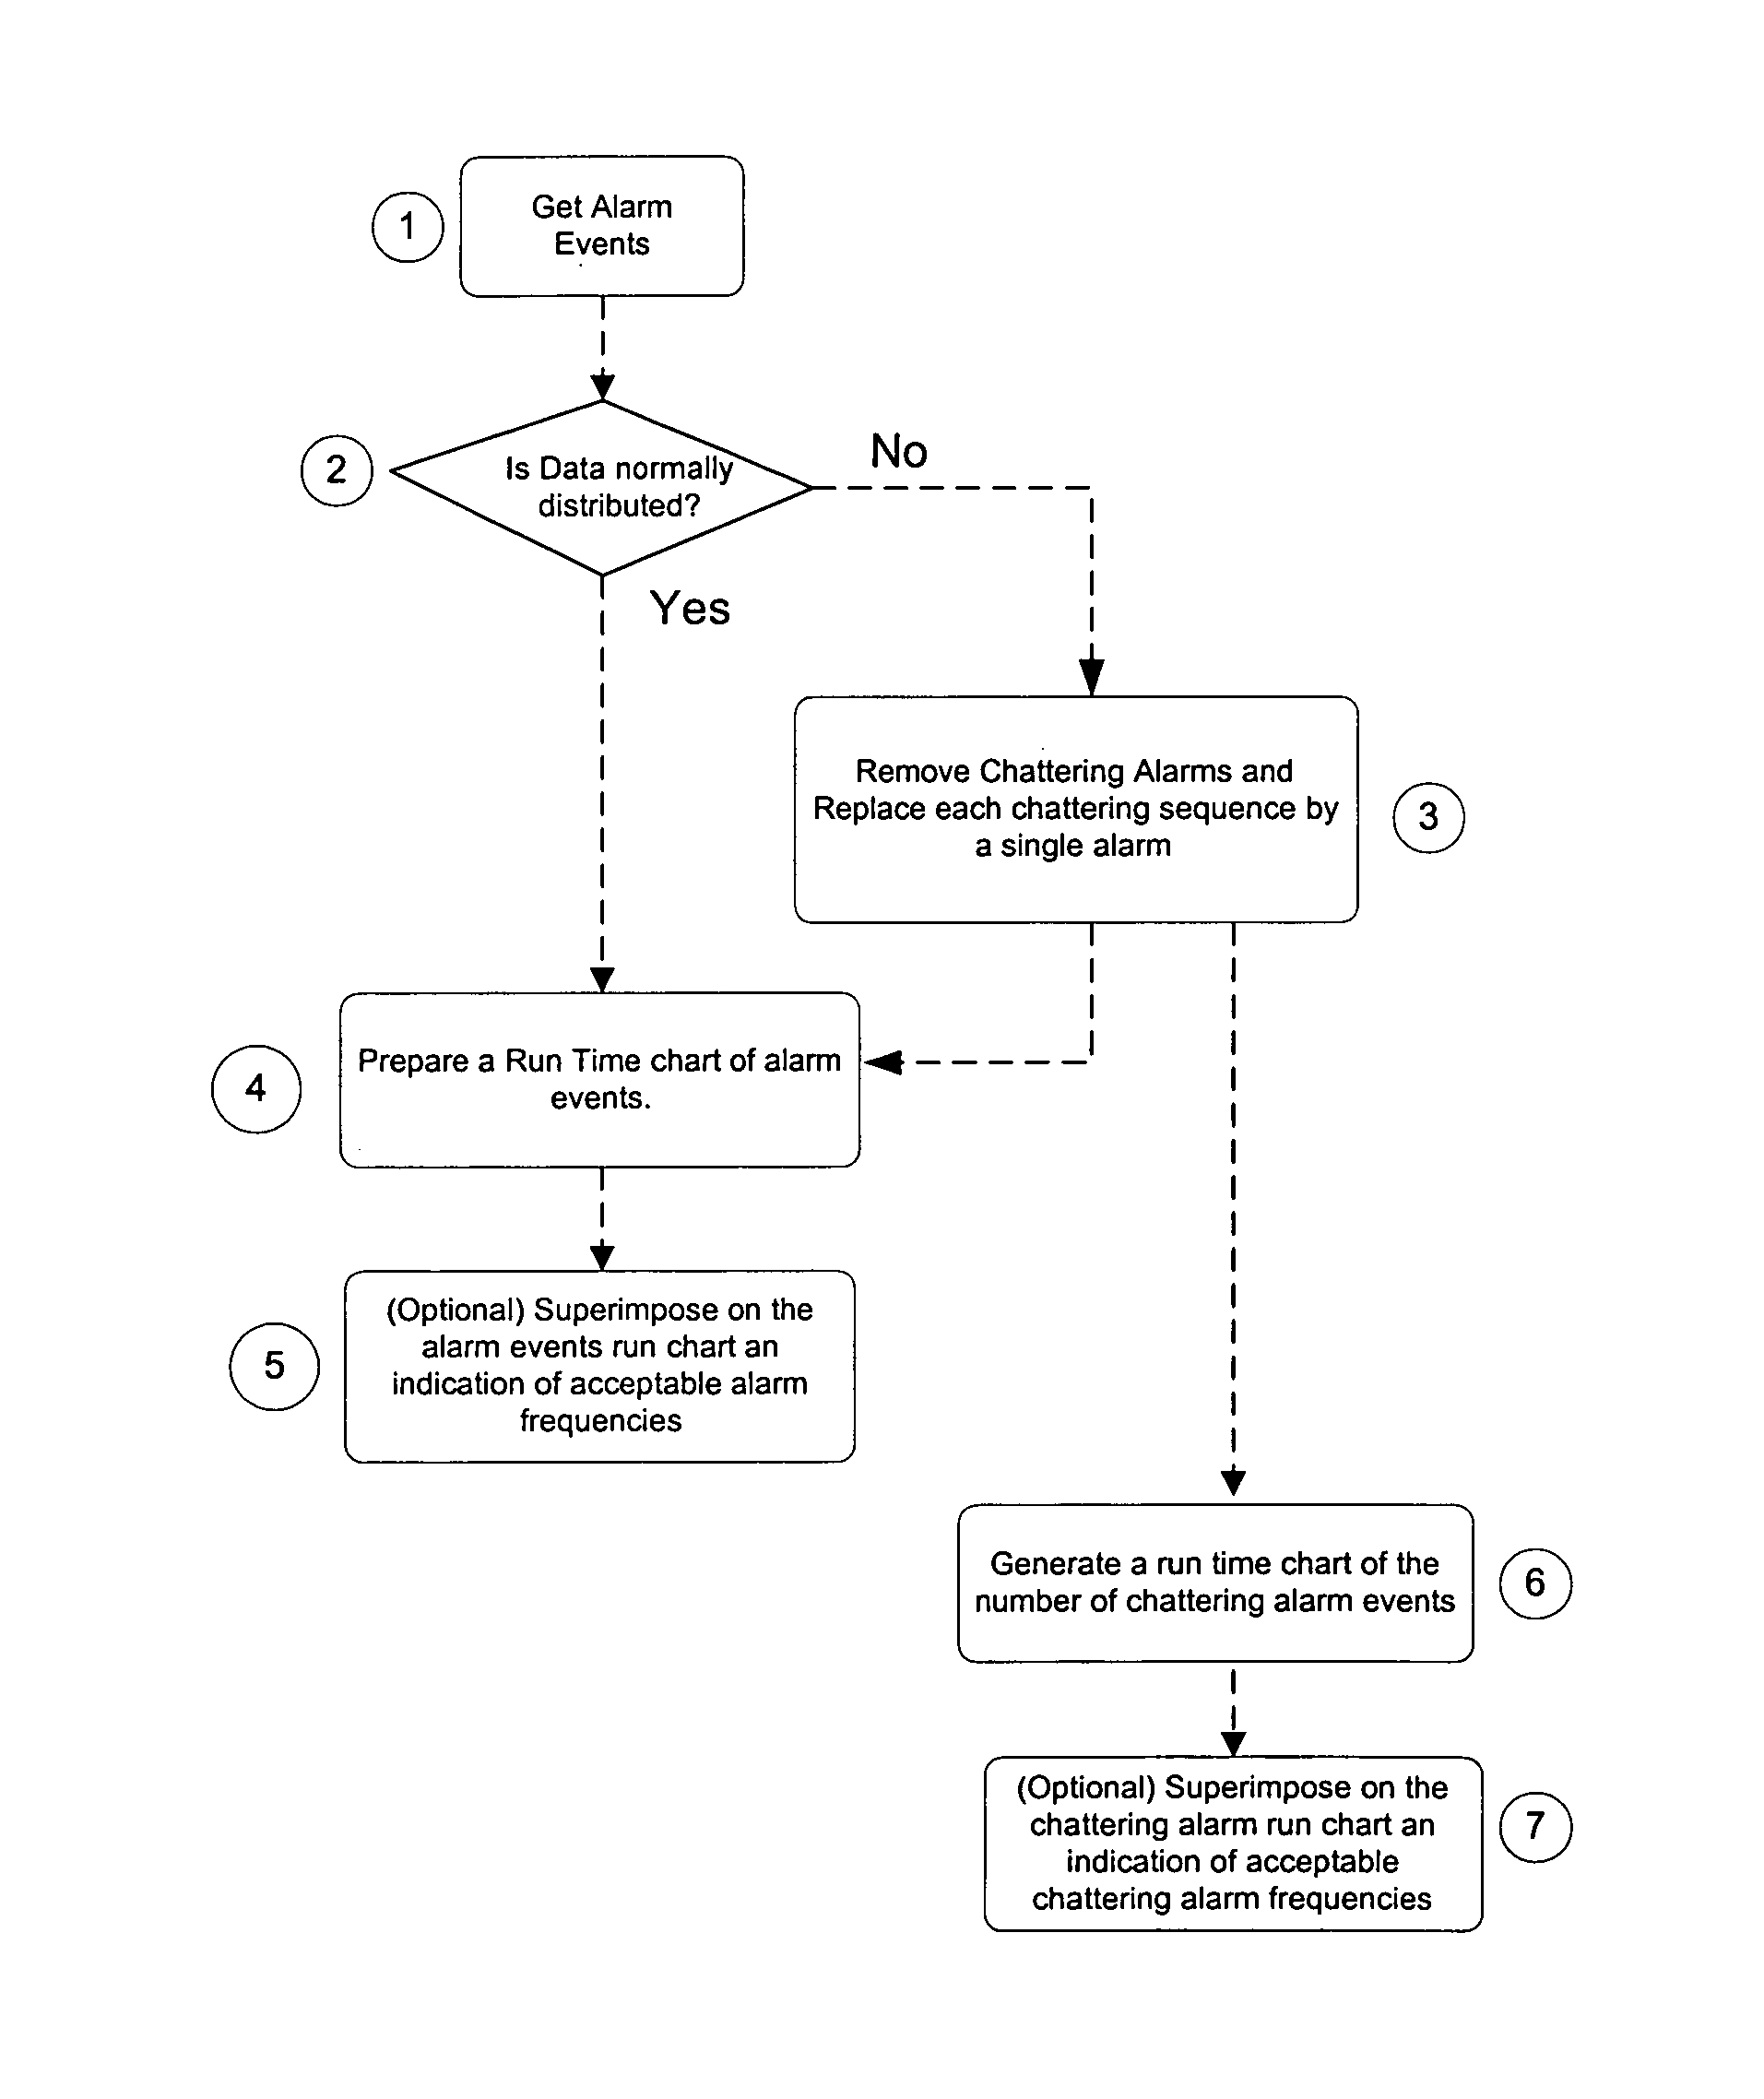
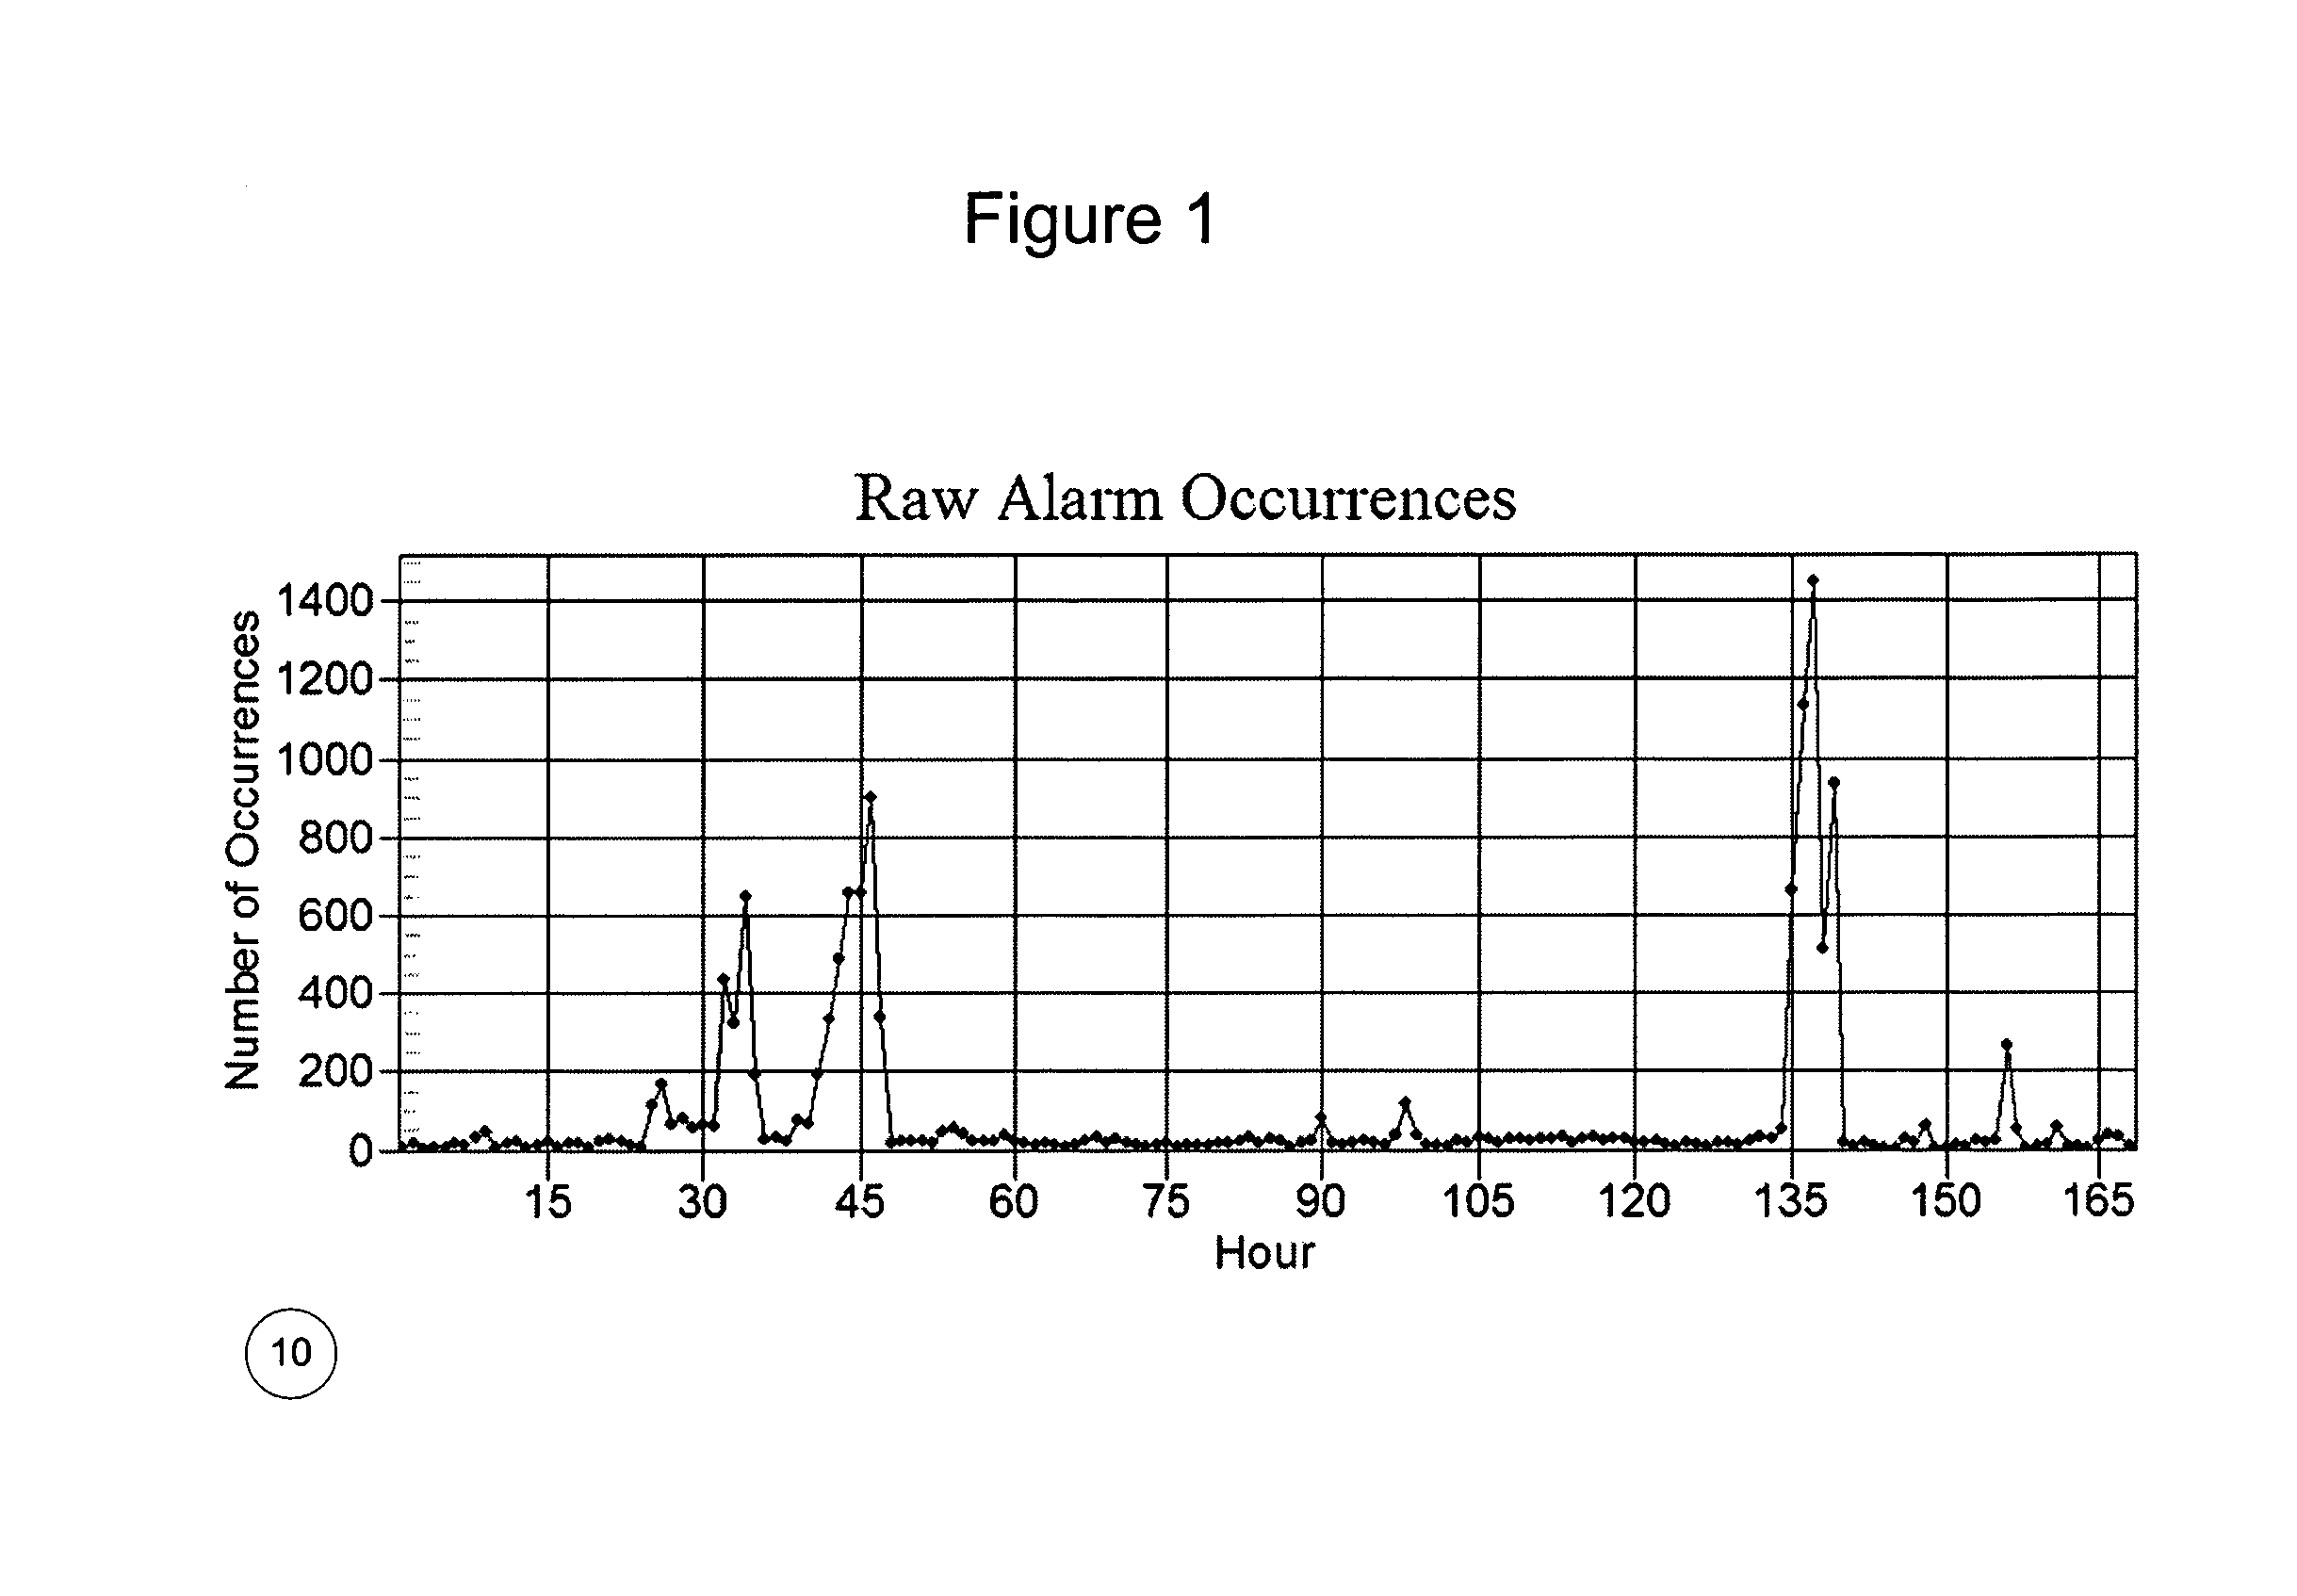
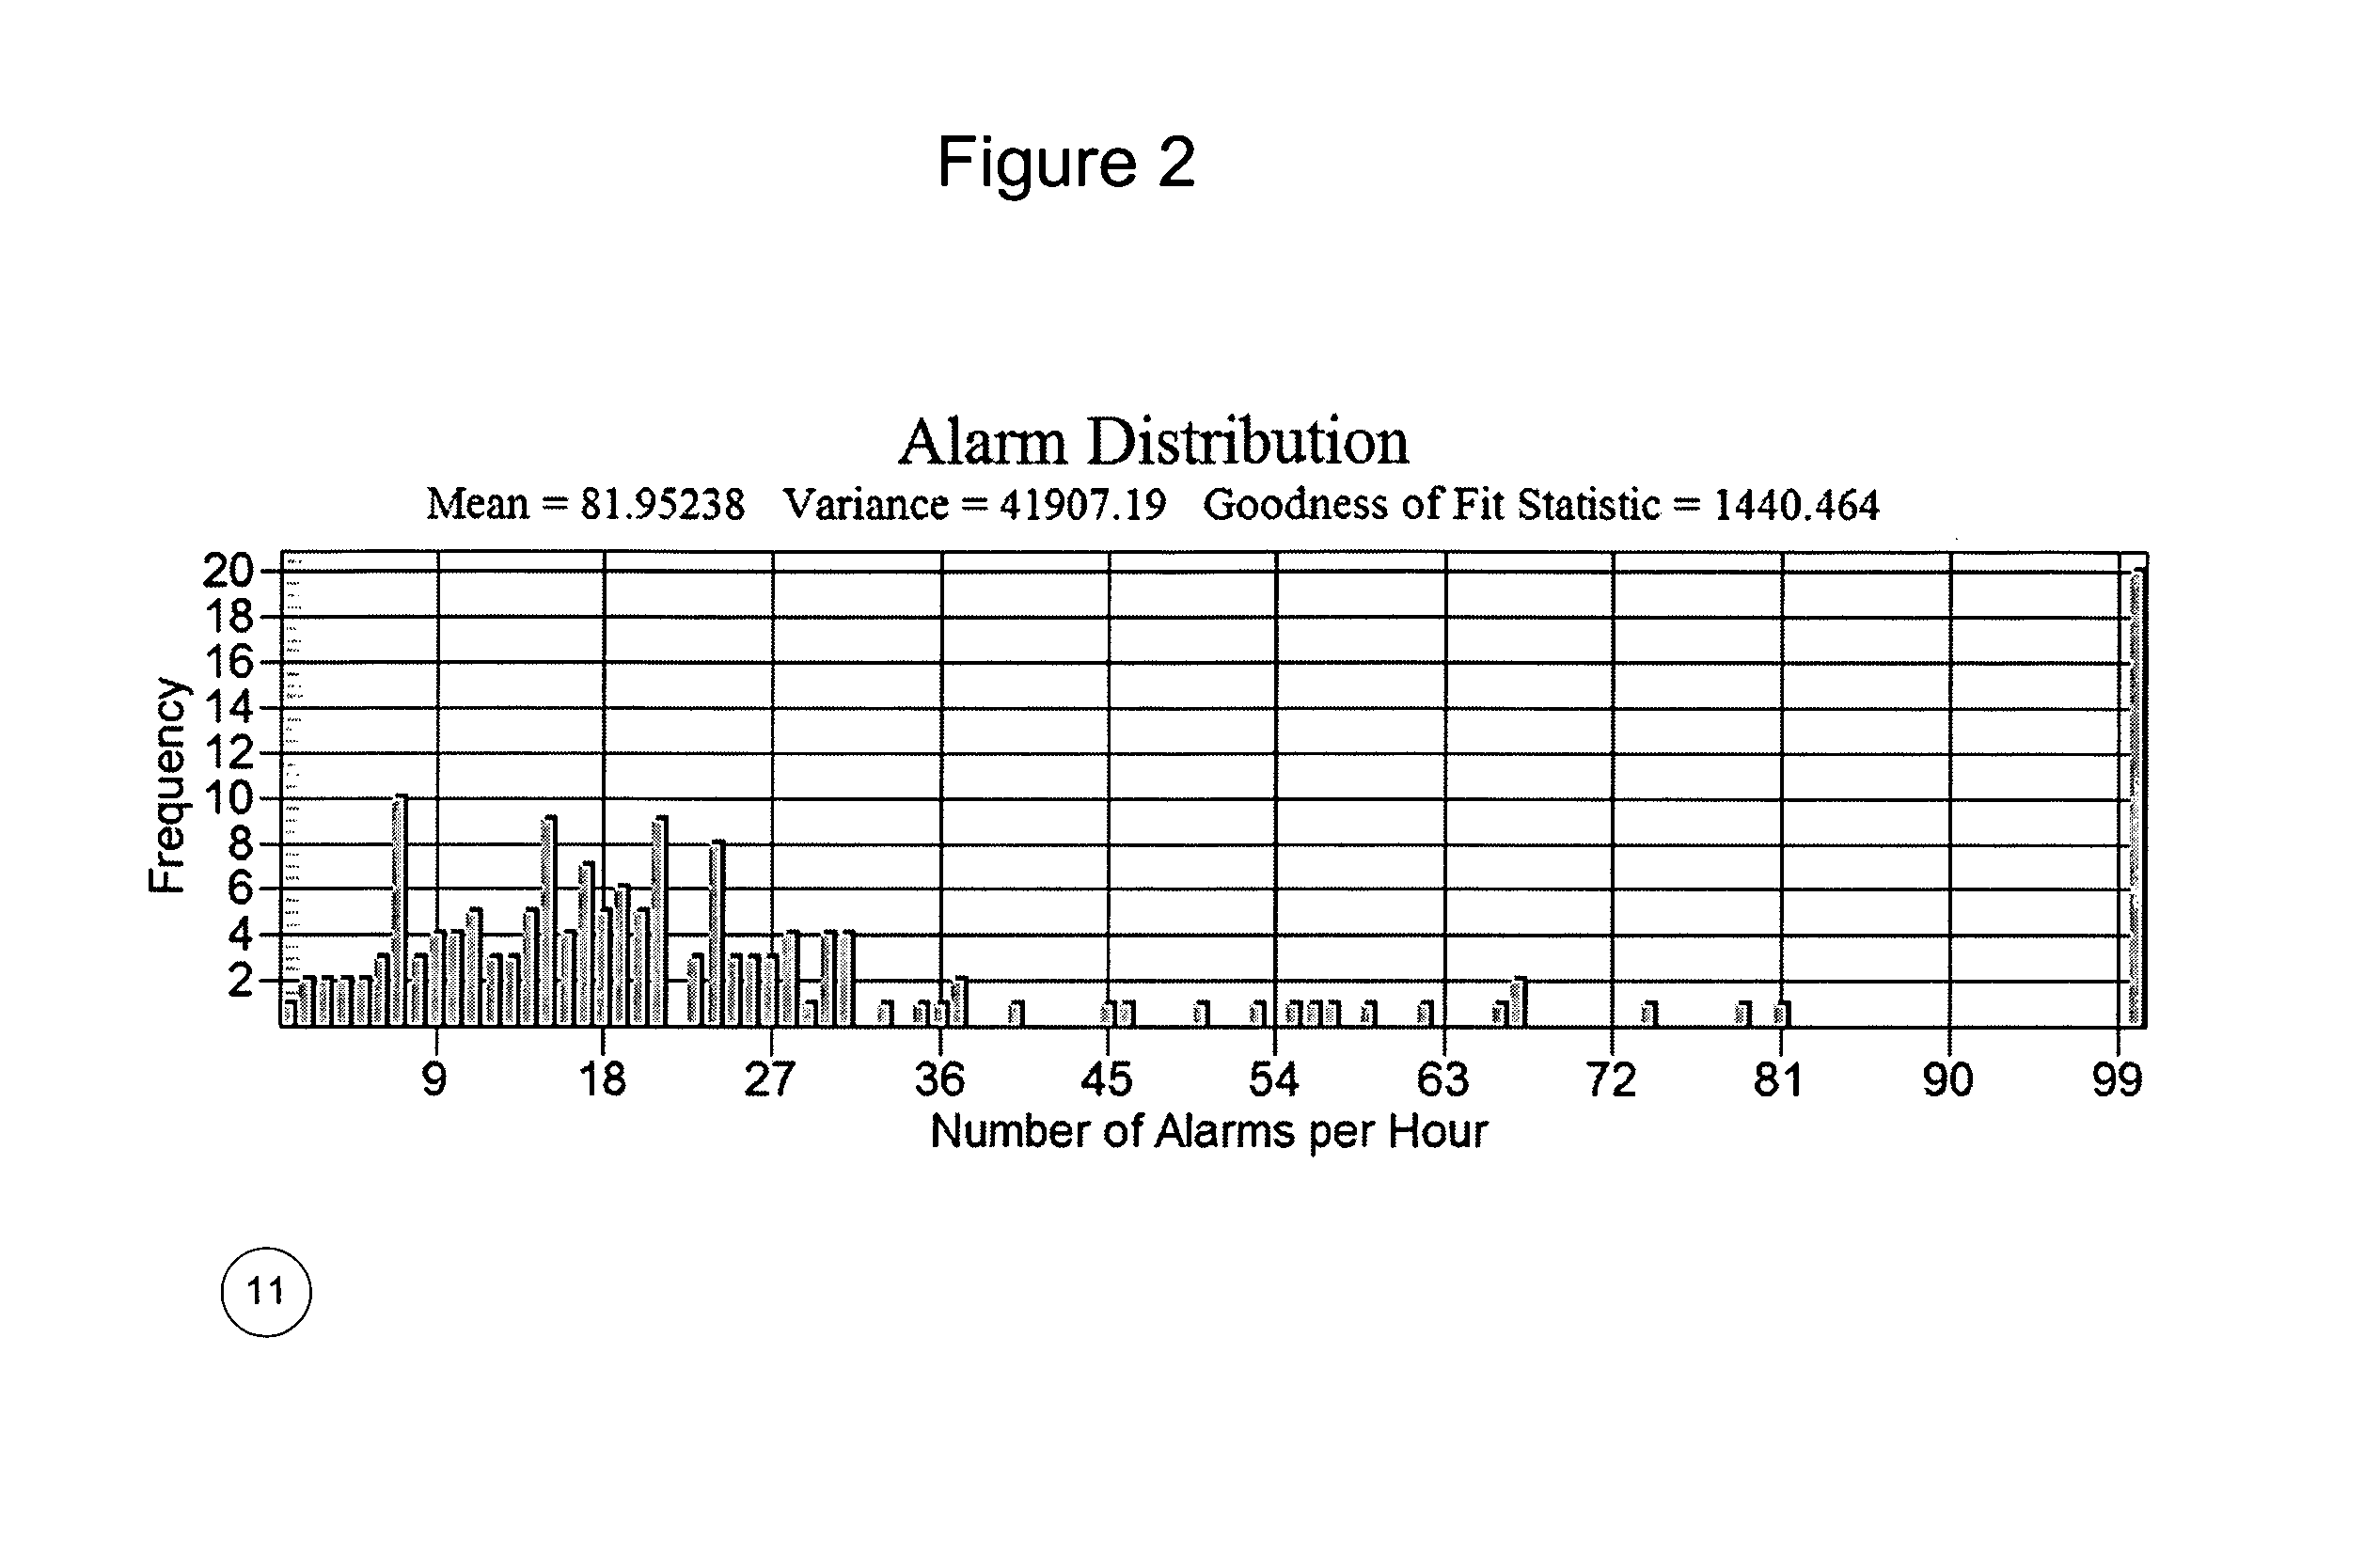
[0042]Statistical quality control of alarm occurrences requires historized values of the alarm times over a suitably long period 1, which are usually stored in a computer historian or database 8. From this data, a standard statistical quality control run chart of the number of alarms per time period 10 and standard histogram of the alarm frequencies 11 may be generated and drawn using a general purpose computer 9. Superimposed on the run chart may be indications of acceptable values of the alarm frequency. Some standard goodness-of-fit metric may also be generated to indicate the normality of the alarm frequency distribution.

[0043]If a standard statistical goodness of fit tests indicate non-normality 2, a transformation of the data set is done by removing any chattering alarms and leaving in place the single alarm that occurred at the time that the chattering sequence started 3. A chattering alarm is defined as one that is preceded within some short period of time by an alarm of the...


PUM


Abstract

A method for evaluating an alarm system for continuous or semi-continuous processes that gives an indication of the actual loading on the operator. A transformations is applied to a data set consisting of alarms and associated times, resulting in the data being much more amenable to common techniques of statistical quality control. The technique requires only a history of alarm events, and the transformation has a strong intuitive appeal.

Description

CROSS-REFERENCE TO RELATED APPLICATIONS[0001]NoneSTATEMENT REGARDING FEDERALLY SPONSORED RESEARCH AND DEVELOPMENT[0002]N / AOTHER REFERENCES[0003]Levinson, W., Understand the Basics of Statistical Process Control Chemical Engineering Progress; pp. 28-37, November 1990.[0004]Jacobs, D. C., Watch Out For Nonnormal Distributions, Chemical Engineering Progress, pp., 19-27, November 1990.[0005]Alarm Systems, A Guide to Design, Management, and Procurement EEMUA, 1999BACKGROUND[0006]1. Field of Invention[0007]This invention relates to a transformation of industrial process alarm occurrence data so that it will be suitable for standard statistical quality control analysis.[0008]2. Discussion of Prior Art[0009]Industrial processes are typically monitored and controlled by computers, which scan hundreds or thousands of process measurements. Associated with each measurement may be one or more alarm limits, which notify the plant operator that the plant requires special attention when the measure...

Claims


Application Information

Patent Timeline
Patent Type & Authority Patents(United States)
IPC IPC(8): G04F1/00G06F17/18
CPCG05B23/0272G05B23/024
Inventor HUGO, ALAN J.
Owner HUGO ALAN J
Why Eureka
Try Eureka