Method for analysis of pain images

a pain diagram and analysis method technology, applied in the field of recording and analyzing pain diagrams, can solve the problems of large correlation between pain measured and larger areas, lack of diagnostic information or analysis of paper pain diagrams used in ordinary clinical practice, and limited value of previous attempts to automate analysis of pain diagrams

Inactive Publication Date: 2008-05-20
TAYLOR MICROTECH
View PDF16 Cites 77 Cited by
  • Summary
  • Abstract
  • Description
  • Claims
  • Application Information

AI Technical Summary

Problems solved by technology

Previous attempts to automate analysis of pain diagrams have been of limited value and have not provided detailed quantitative evaluation or been applicable to all of the many body image designs used in medical practice.
However, it does not provide diagnostic information or analysis of the paper pain diagrams used in ordinary clinical practice.
Using a grid system, larger areas of pain measured have been correlated with greater disease severity and poorer response to treatment.
Such methods have not hitherto been applied to match pain diagrams of different designs.

Method used


Image

  • Method for analysis of pain images
  • Method for analysis of pain images
  • Method for analysis of pain images

Examples


Embodiment Construction

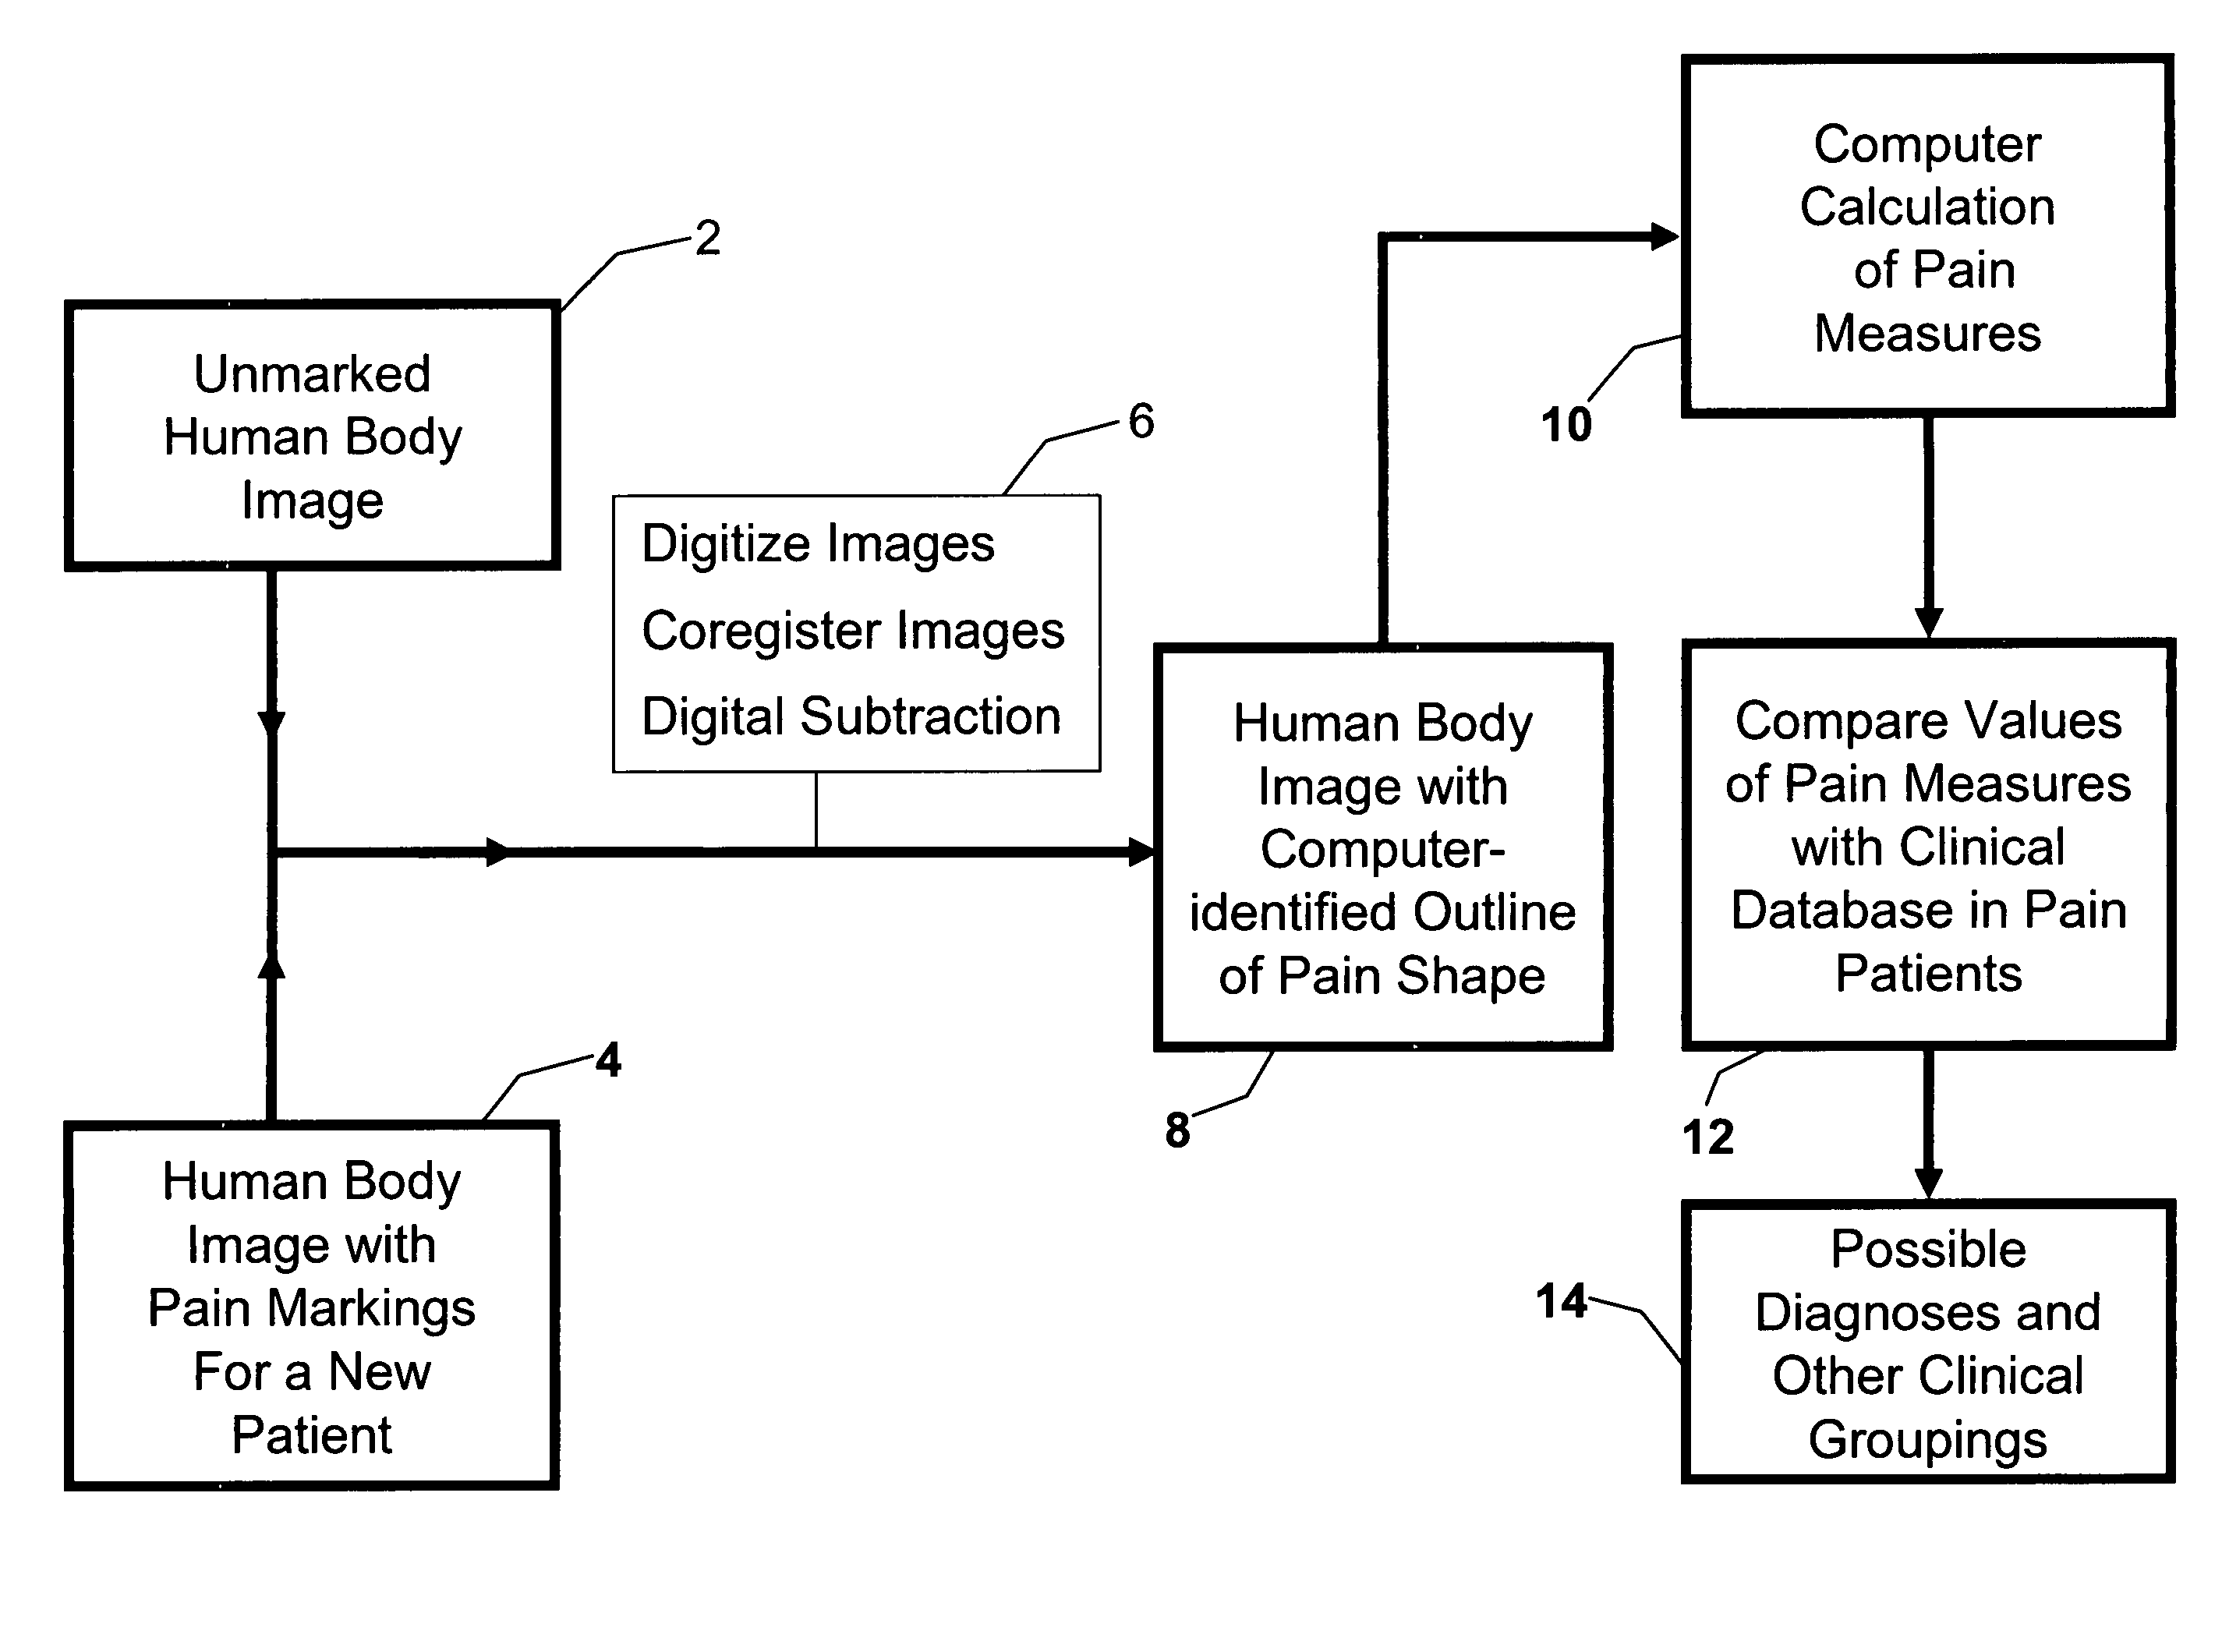
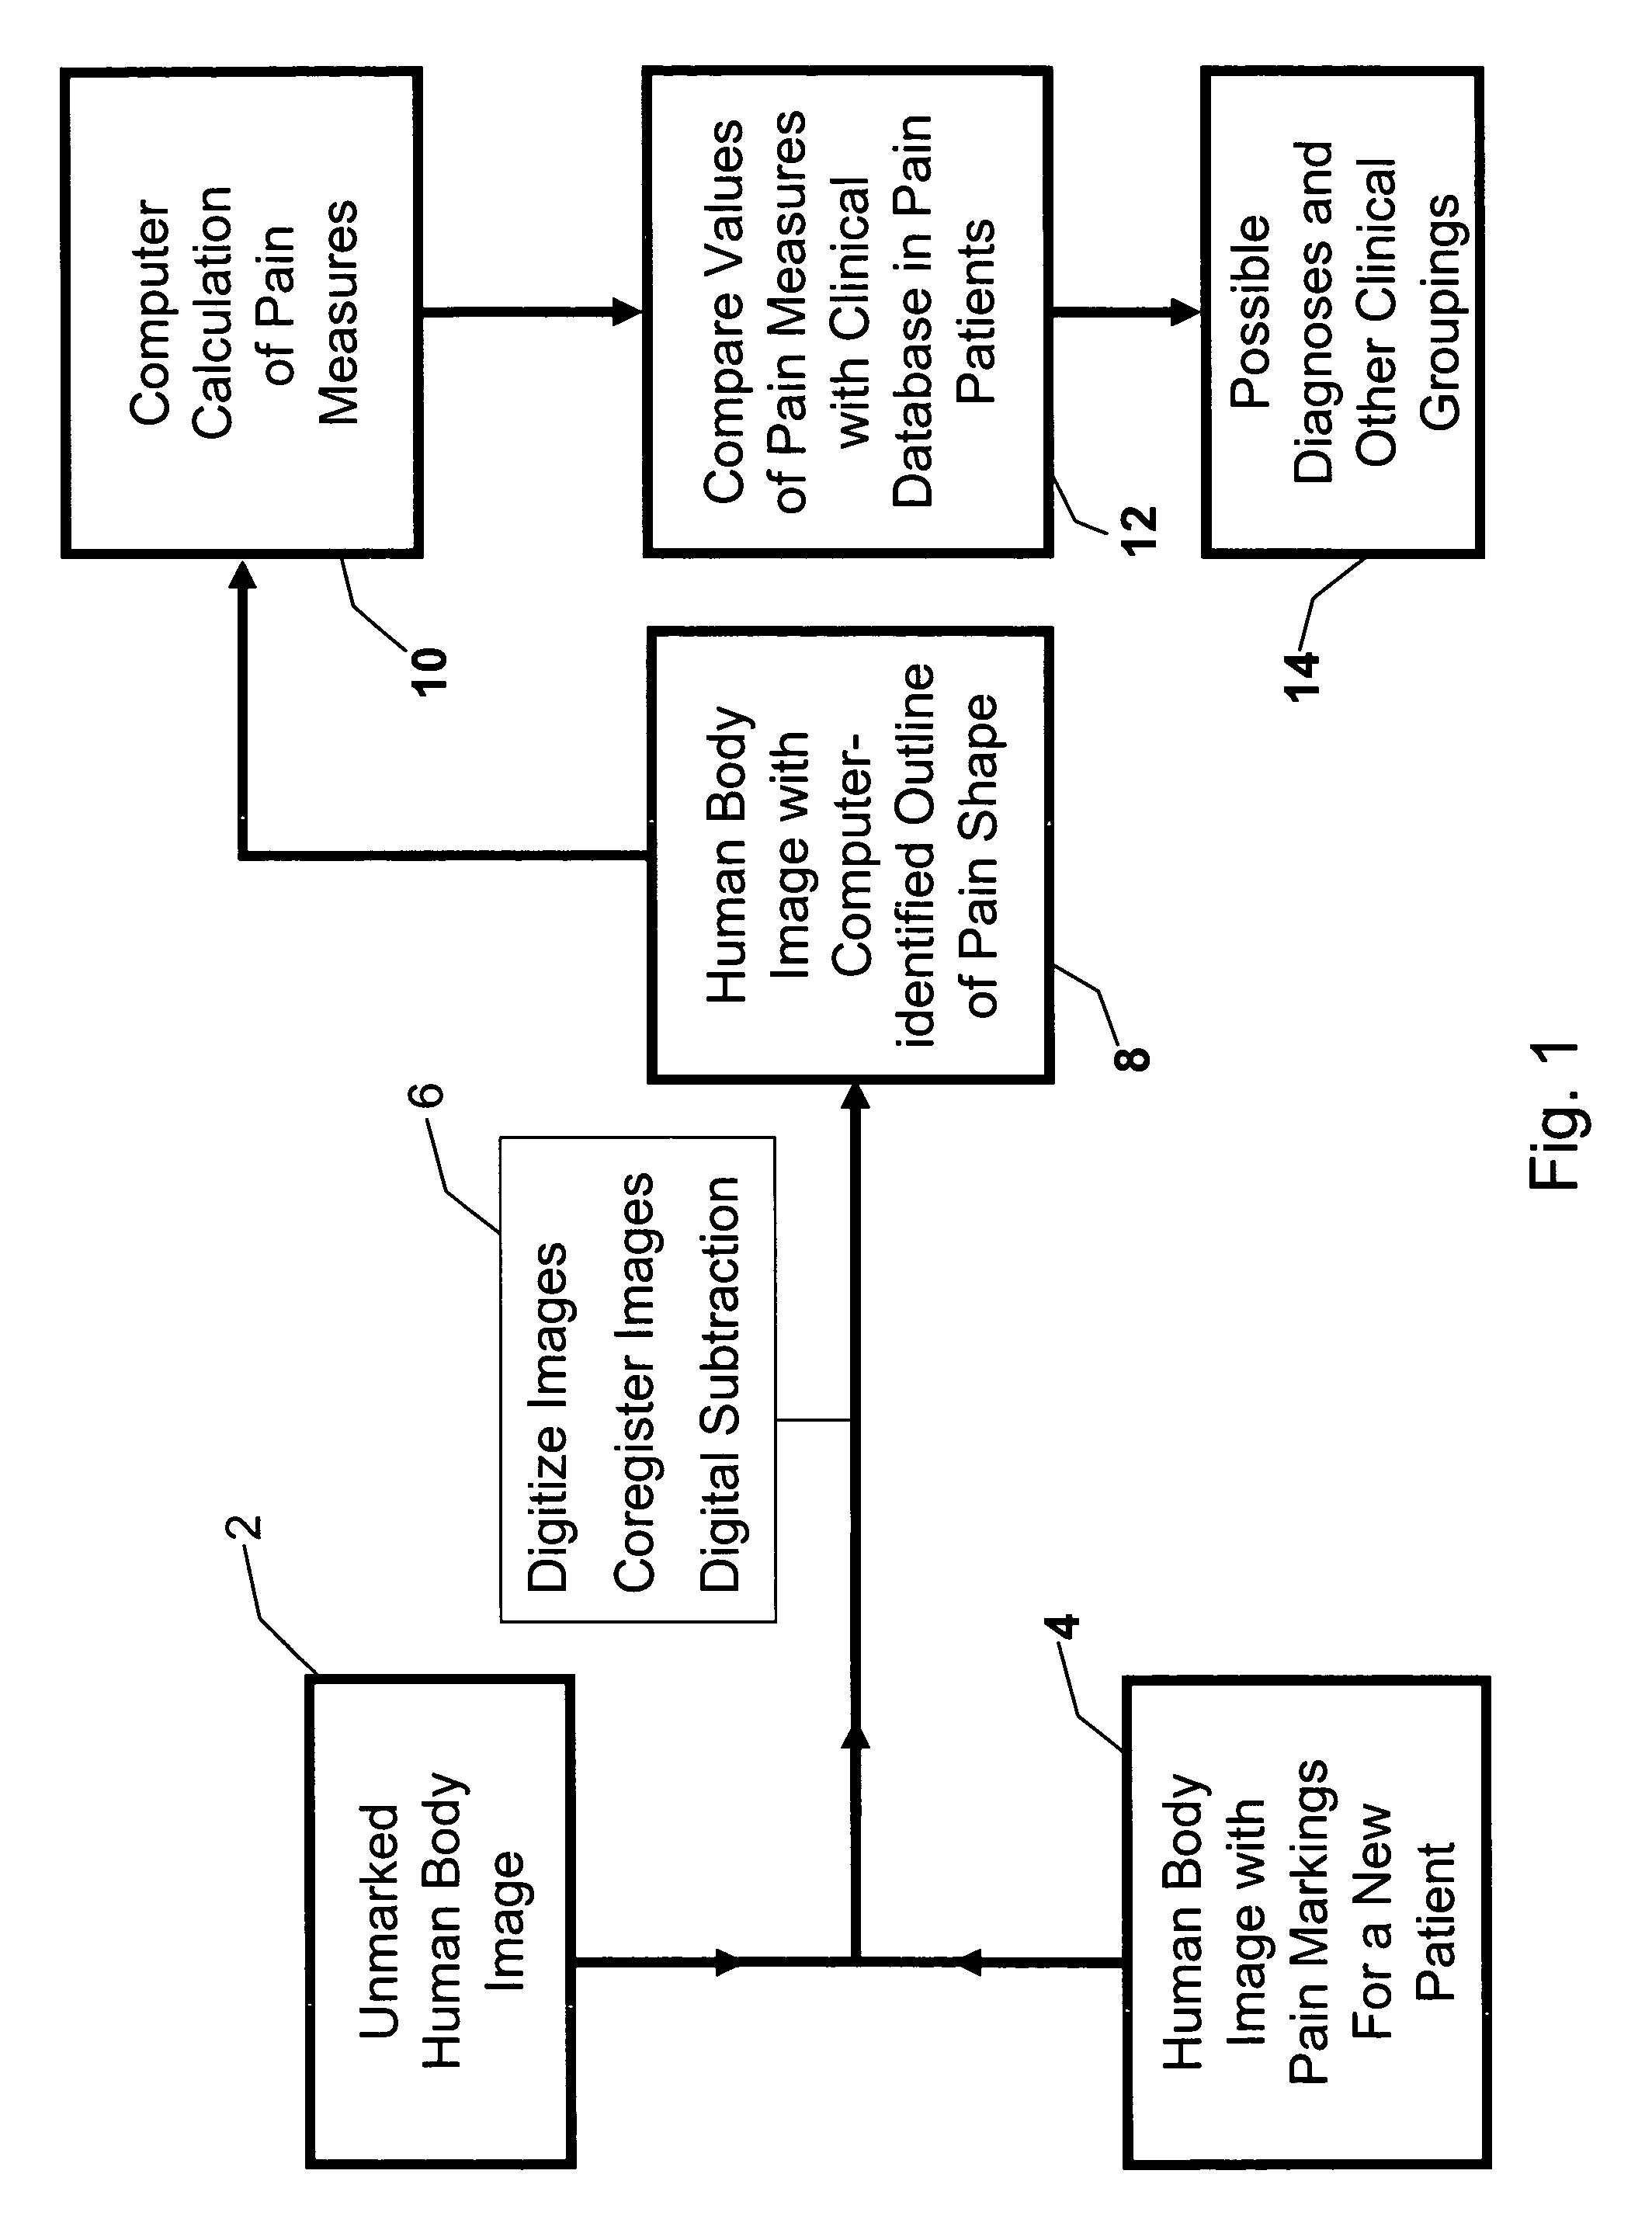
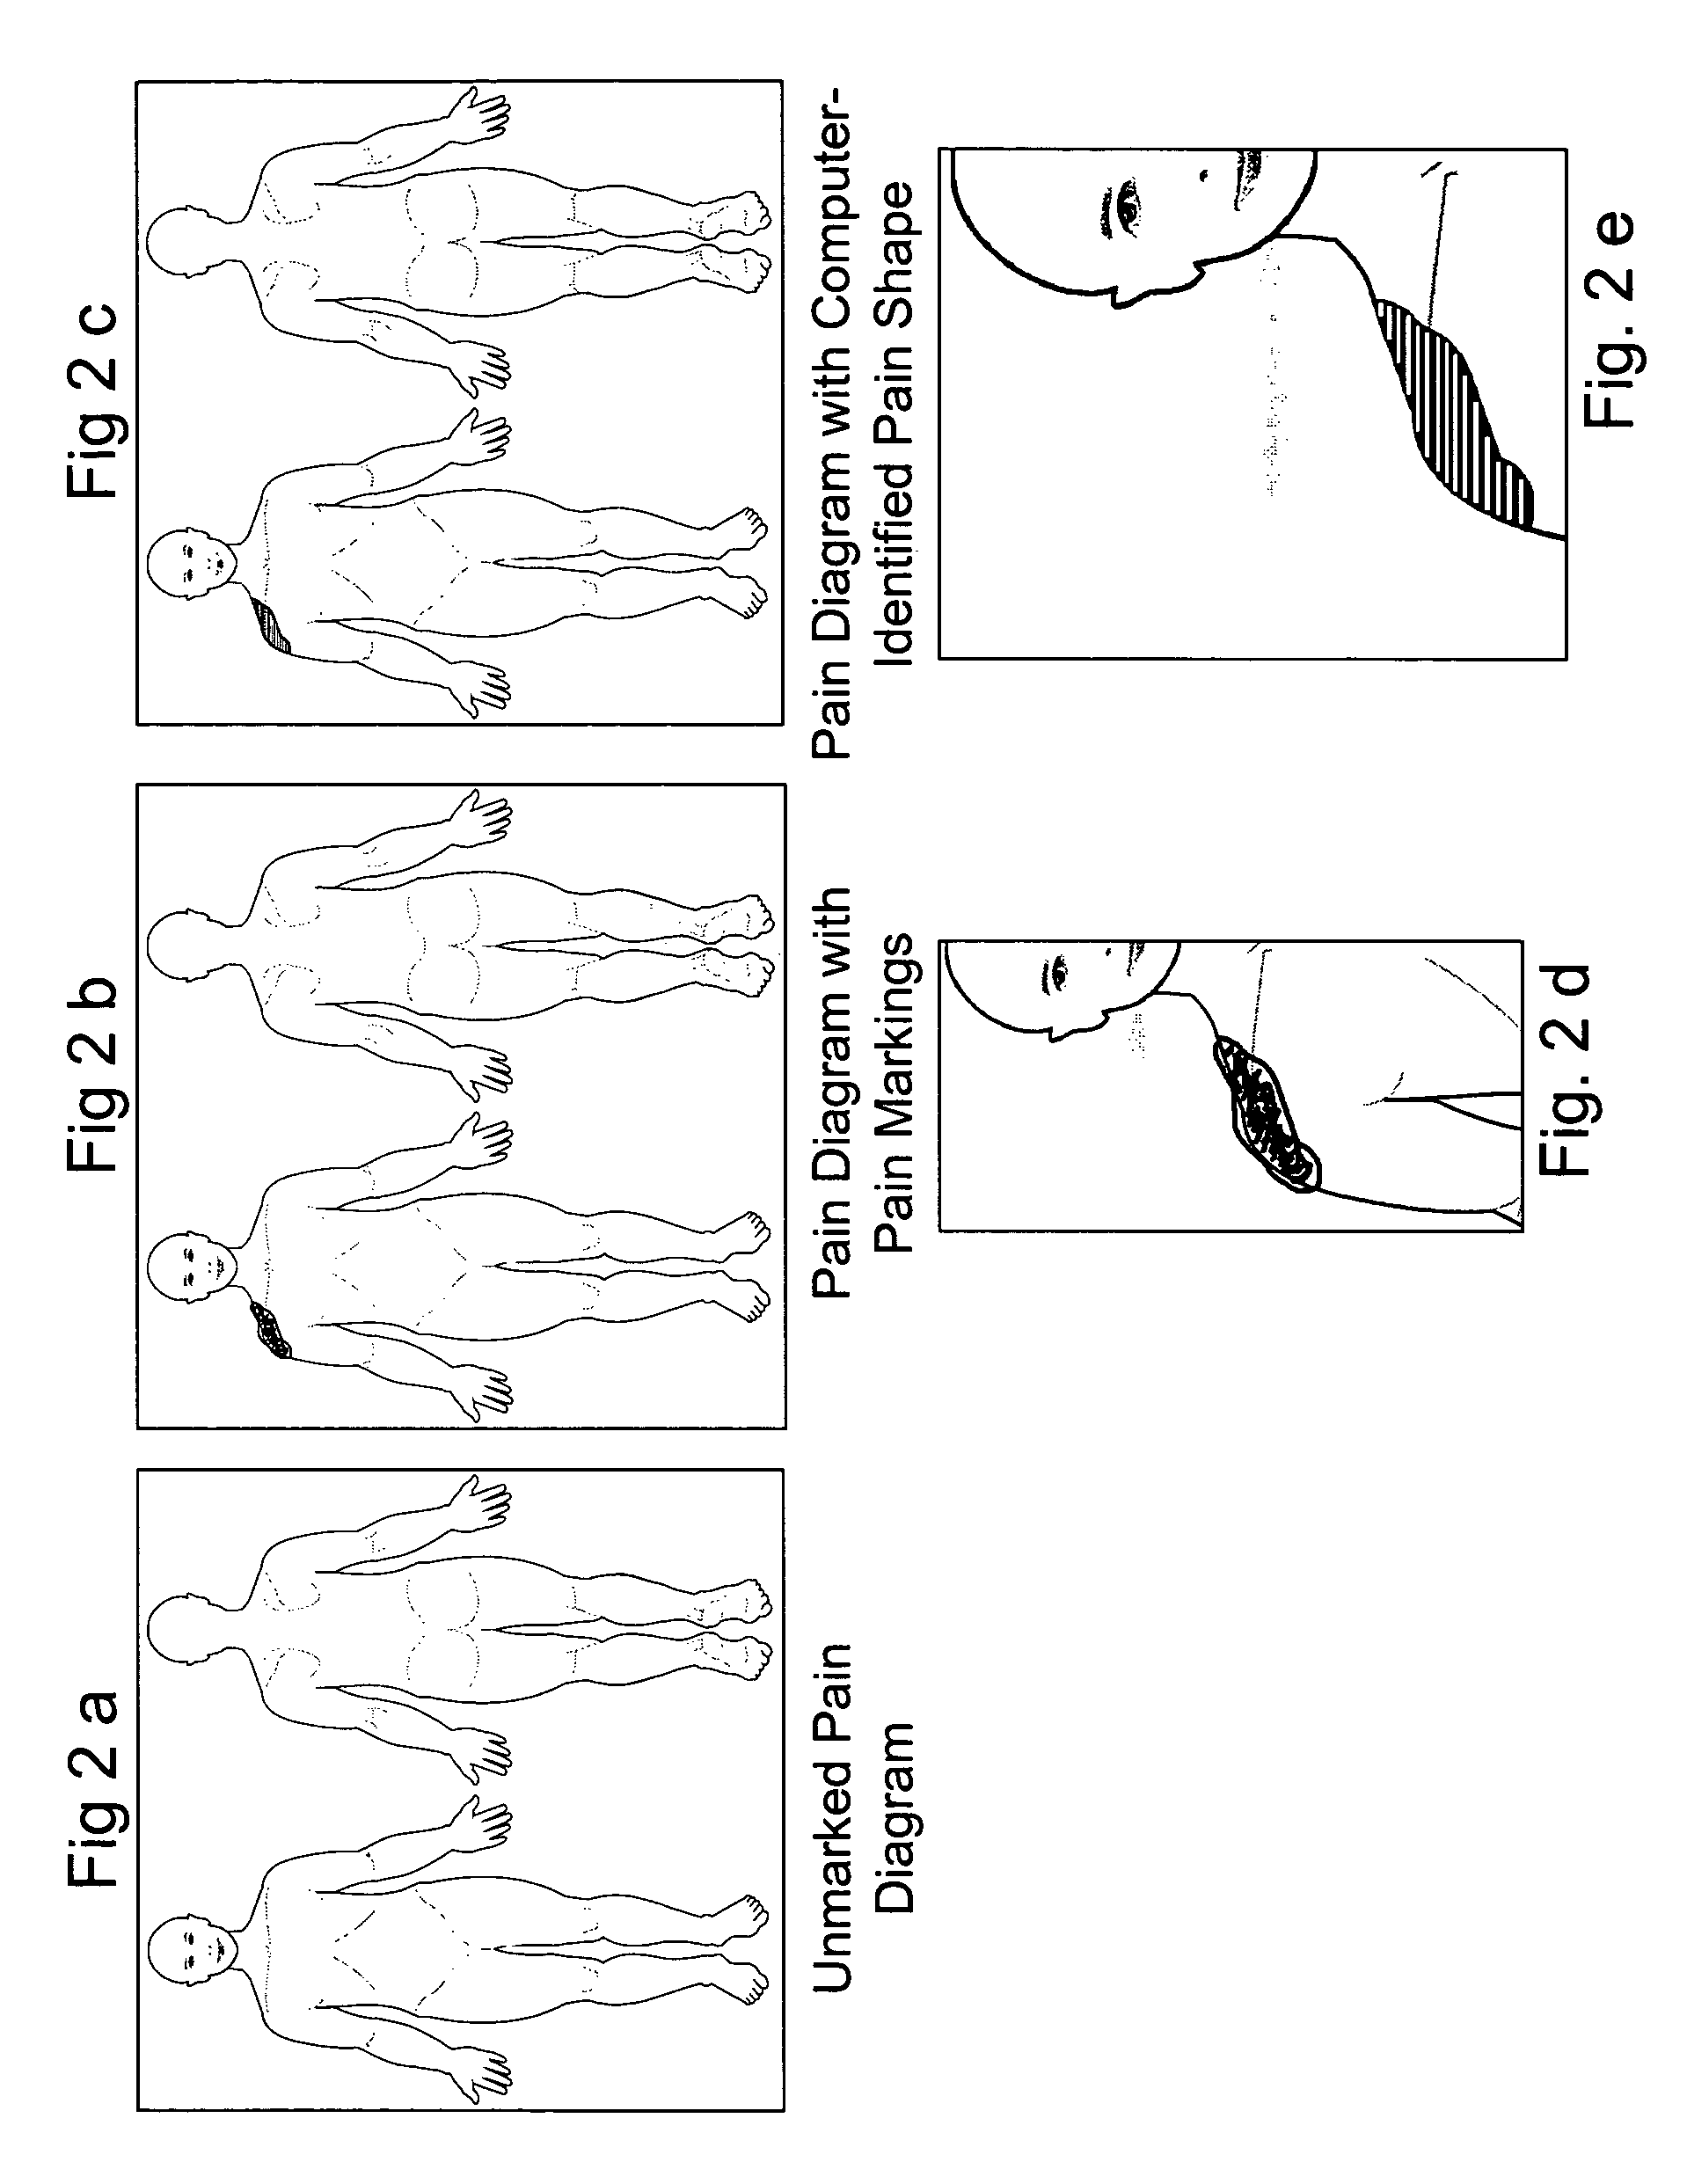
[0087]The present invention relates to a method for recording and analyzing the locations where pain is experienced by a patient, as recorded by a patient or physician drawing on a body image.

Definitions of Key Terms:

[0088]Affine Transformation: A mathematical transformation that is a combination of single transformations such as translation or rotation or reflection on an axis. In a typical affine transformation, given a matrix M, and a Vector V in homogeneous coordinates (e.g. V=(X Y 1)′), then V′=MV where V′ is the new vector in the transformed space.[0089]Centroid and Meta-Centroid: As it applies to visual images, a centroid represents the mean position of the points making up a visual object. A meta-centroid is the point representing the mean position of a group of visual objects, and may be calculated as the mean position of the individual un-weighted centroids or as the mean position of all the points making up the group of visual objects.[0090]Composite Image: An image that ...


PUM

PropertyMeasurementUnit
pain shapeaaaaaaaaaa
distanceaaaaaaaaaa
distancesaaaaaaaaaa

Abstract

A method uses body images and computer hardware and software to collect and analyze clinical data in patients experiencing pain. Pain location information is obtained by the drawing of an outline of the pain on a paper copy or electronic display of the body image. Composite images are generated representing aggregate data for specified patient groups. The coordinates of common anatomic landmarks on differently designed body images are mapped to each other, permitting integrated analysis of pain data, e.g., pain shape, centroid, meta centroid, from multiple body image designs and display of all pain data on a single body image design. Differences and similarities between groups of patients are displayed visually and numerically, and are used to assign the probability of a given patient belonging to a particular diagnostic group or category of disease severity.

Description

BACKGROUND OF THE INVENTION[0001]The present invention relates to a method for recording and analyzing pain diagrams in which a patient or physician draws on a body image the location of pain suffered by the patient. Pain diagrams have been used for many years but are normally used merely for quick visual review to identify anatomic locations of pain.[0002]Pain diagrams are routinely used in pain specialist offices and in clinical trials of pain therapy. Previous attempts to automate analysis of pain diagrams have been of limited value and have not provided detailed quantitative evaluation or been applicable to all of the many body image designs used in medical practice.[0003]North et al (“Automated ‘pain drawing’ analysis by computer-controlled, patient-interactive neurological stimulation system”, Pain. 1992 July; 50:51-7 and “Patient-interactive, computer-controlled neurological stimulation system: clinical efficacy in spinal cord stimulator adjustment, J Neurosurg. 1992 June; 76...

Claims


Application Information

Patent Timeline
Patent Type & Authority Patents(United States)
IPC IPC(8): A61B5/00G01N33/48
CPCA61B5/00A61B5/4824A61B5/4528A61B5/743
Inventor TAYLOR, COLIN R.
Owner TAYLOR MICROTECH
Why Eureka
Try Eureka