Chart display device and program for the same

a display device and program technology, applied in the field of charts, can solve the problems of deteriorating the appearance of the display sheet, and consuming a lot of time and energy, so as to save the burden on operators and improve the effect of carrying out adjustmen

Inactive Publication Date: 2008-09-02
I N INFORMATION SYST
View PDF6 Cites 33 Cited by
  • Summary
  • Abstract
  • Description
  • Claims
  • Application Information

AI Technical Summary

Benefits of technology

[0006]The present invention was made to solve such problems described above, and to provide a chart (or graph) display device and system which can save burdens on operators who prepare documents, by improving in creating a plurality of graphs on a graph display sheet and by improving in carrying out adjustment of the size of the graphs displayed on the graph display sheet.
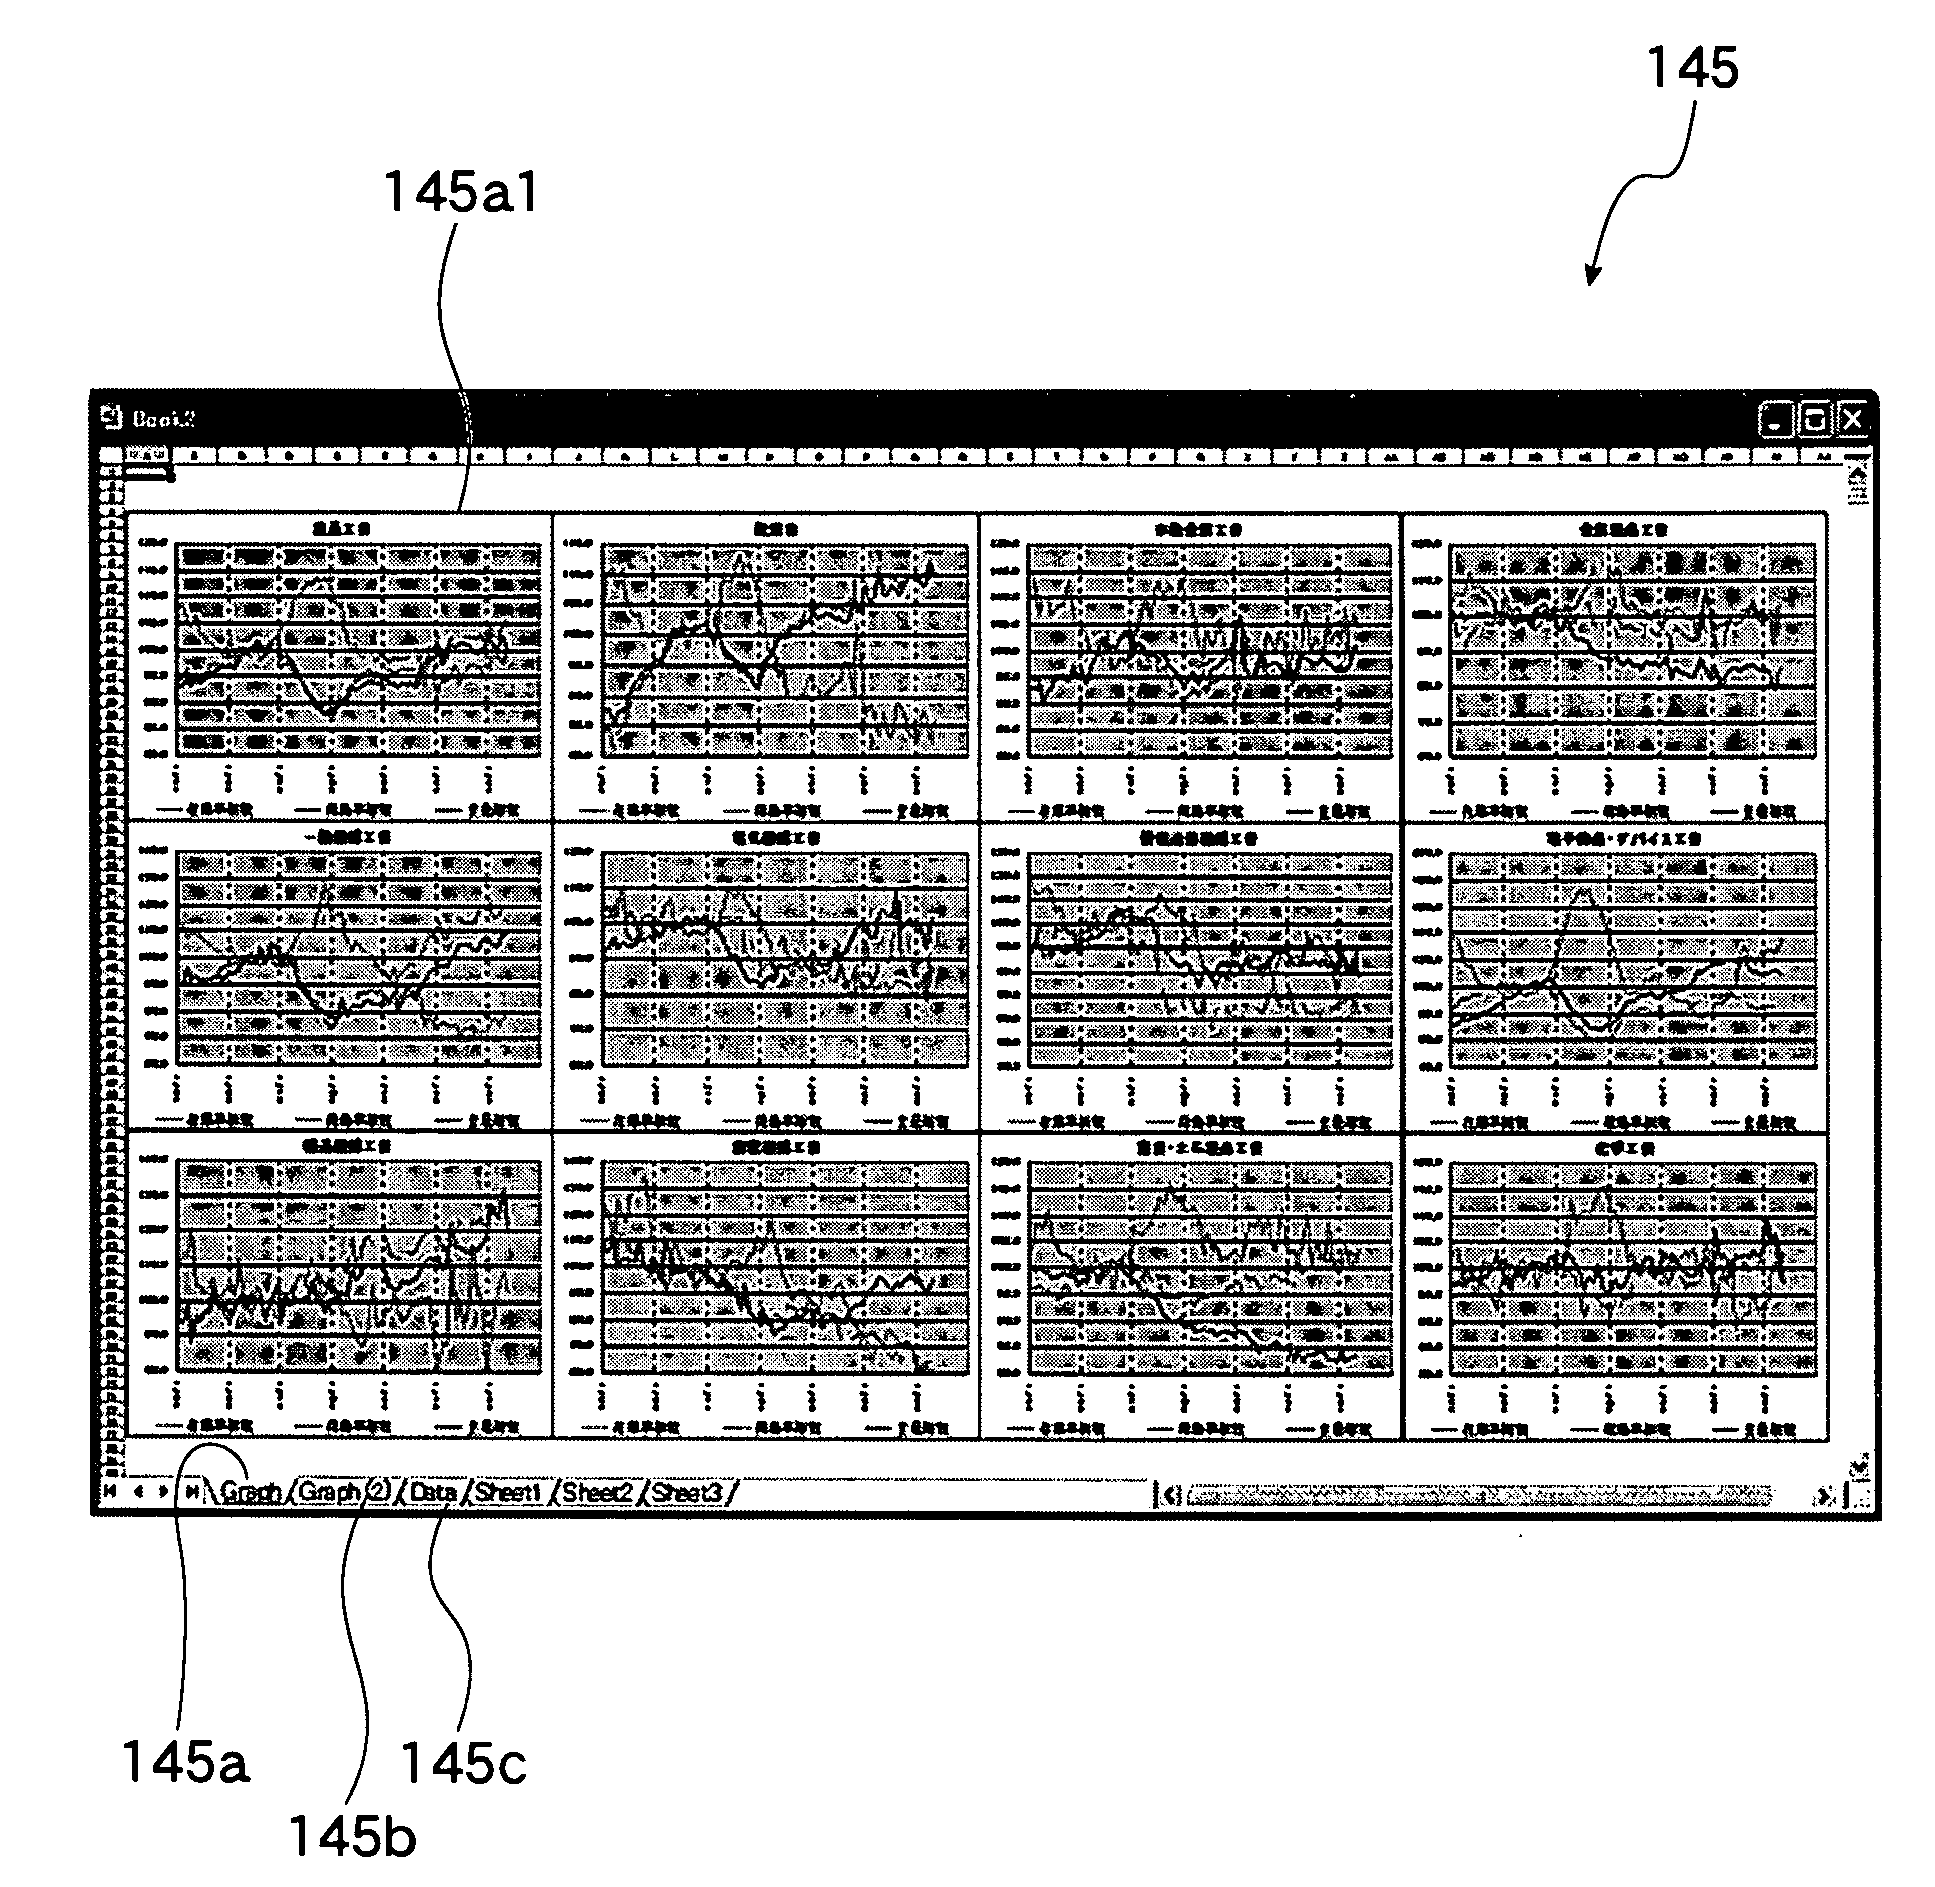
[0023]Thereby, a plurality of the graph-model forms are displayed on the graph display sheet, and the predetermined numerical-value information is graphically displayed on these graph-model forms respectively. Therefore a plurality of the graphs can be displayed on the same graph sheet, being able to reduce a burden on operators who prepare documents.
[0024]According to the second aspect of the present invention, the display size and the display position of the graph-model form are decided based on the information on the number of the category which corresponds to the forming unit of the graph, so that the size and position of the graph to be displayed on the graph display sheet can be decided based on the number of graphs. Therefore, all graphs can be displayed in such a well-balanced manner that the graphs are adjusted in size and position in the graph display sheet based on the number of graphs. Furthermore, the predetermined numerical-value information which corresponds to the category is displayed on the graph-model forms on the graph display sheet so that the numerical-value information of each category can be displayed on each graph respectively, which is displayed using the same graph-model form. Therefore the numerical-value information of a plurality of categories can be displayed in an easy-to-read style.
[0026]According to the fourth aspect of the present invention, the display size of a plurality of graphs displayed on the graph display sheet is adjusted to have approximately the same size. The size of the plot area can be adjusted to have the same size, even though the size of the plot area of each graph is different. Thus a plurality of graphs can be displayed on the same screen in an easy-to-ready style. And burdens on operators who prepare documents can be reduced.

Problems solved by technology

Such work consumes a lot of time and energy.
In addition, in the case where new data are freshly added, after alignment of these graphs is completed, sizes of the plot areas of some graphs must be changed in concert with an increase in the volume of the data to be freshly added, causing deterioration in appearance of the display sheet.
In such case in the above-mentioned prior art, operators of the computer must manually re-adjust the size and location of the graphs in the display sheet on the computer screen, consuming a lot of time and energy, too.

Method used


Image

  • Chart display device and program for the same
  • Chart display device and program for the same
  • Chart display device and program for the same

Examples


Embodiment Construction

[0042]The present invention will be explained more precisely.

Embodiment of the Present Invention

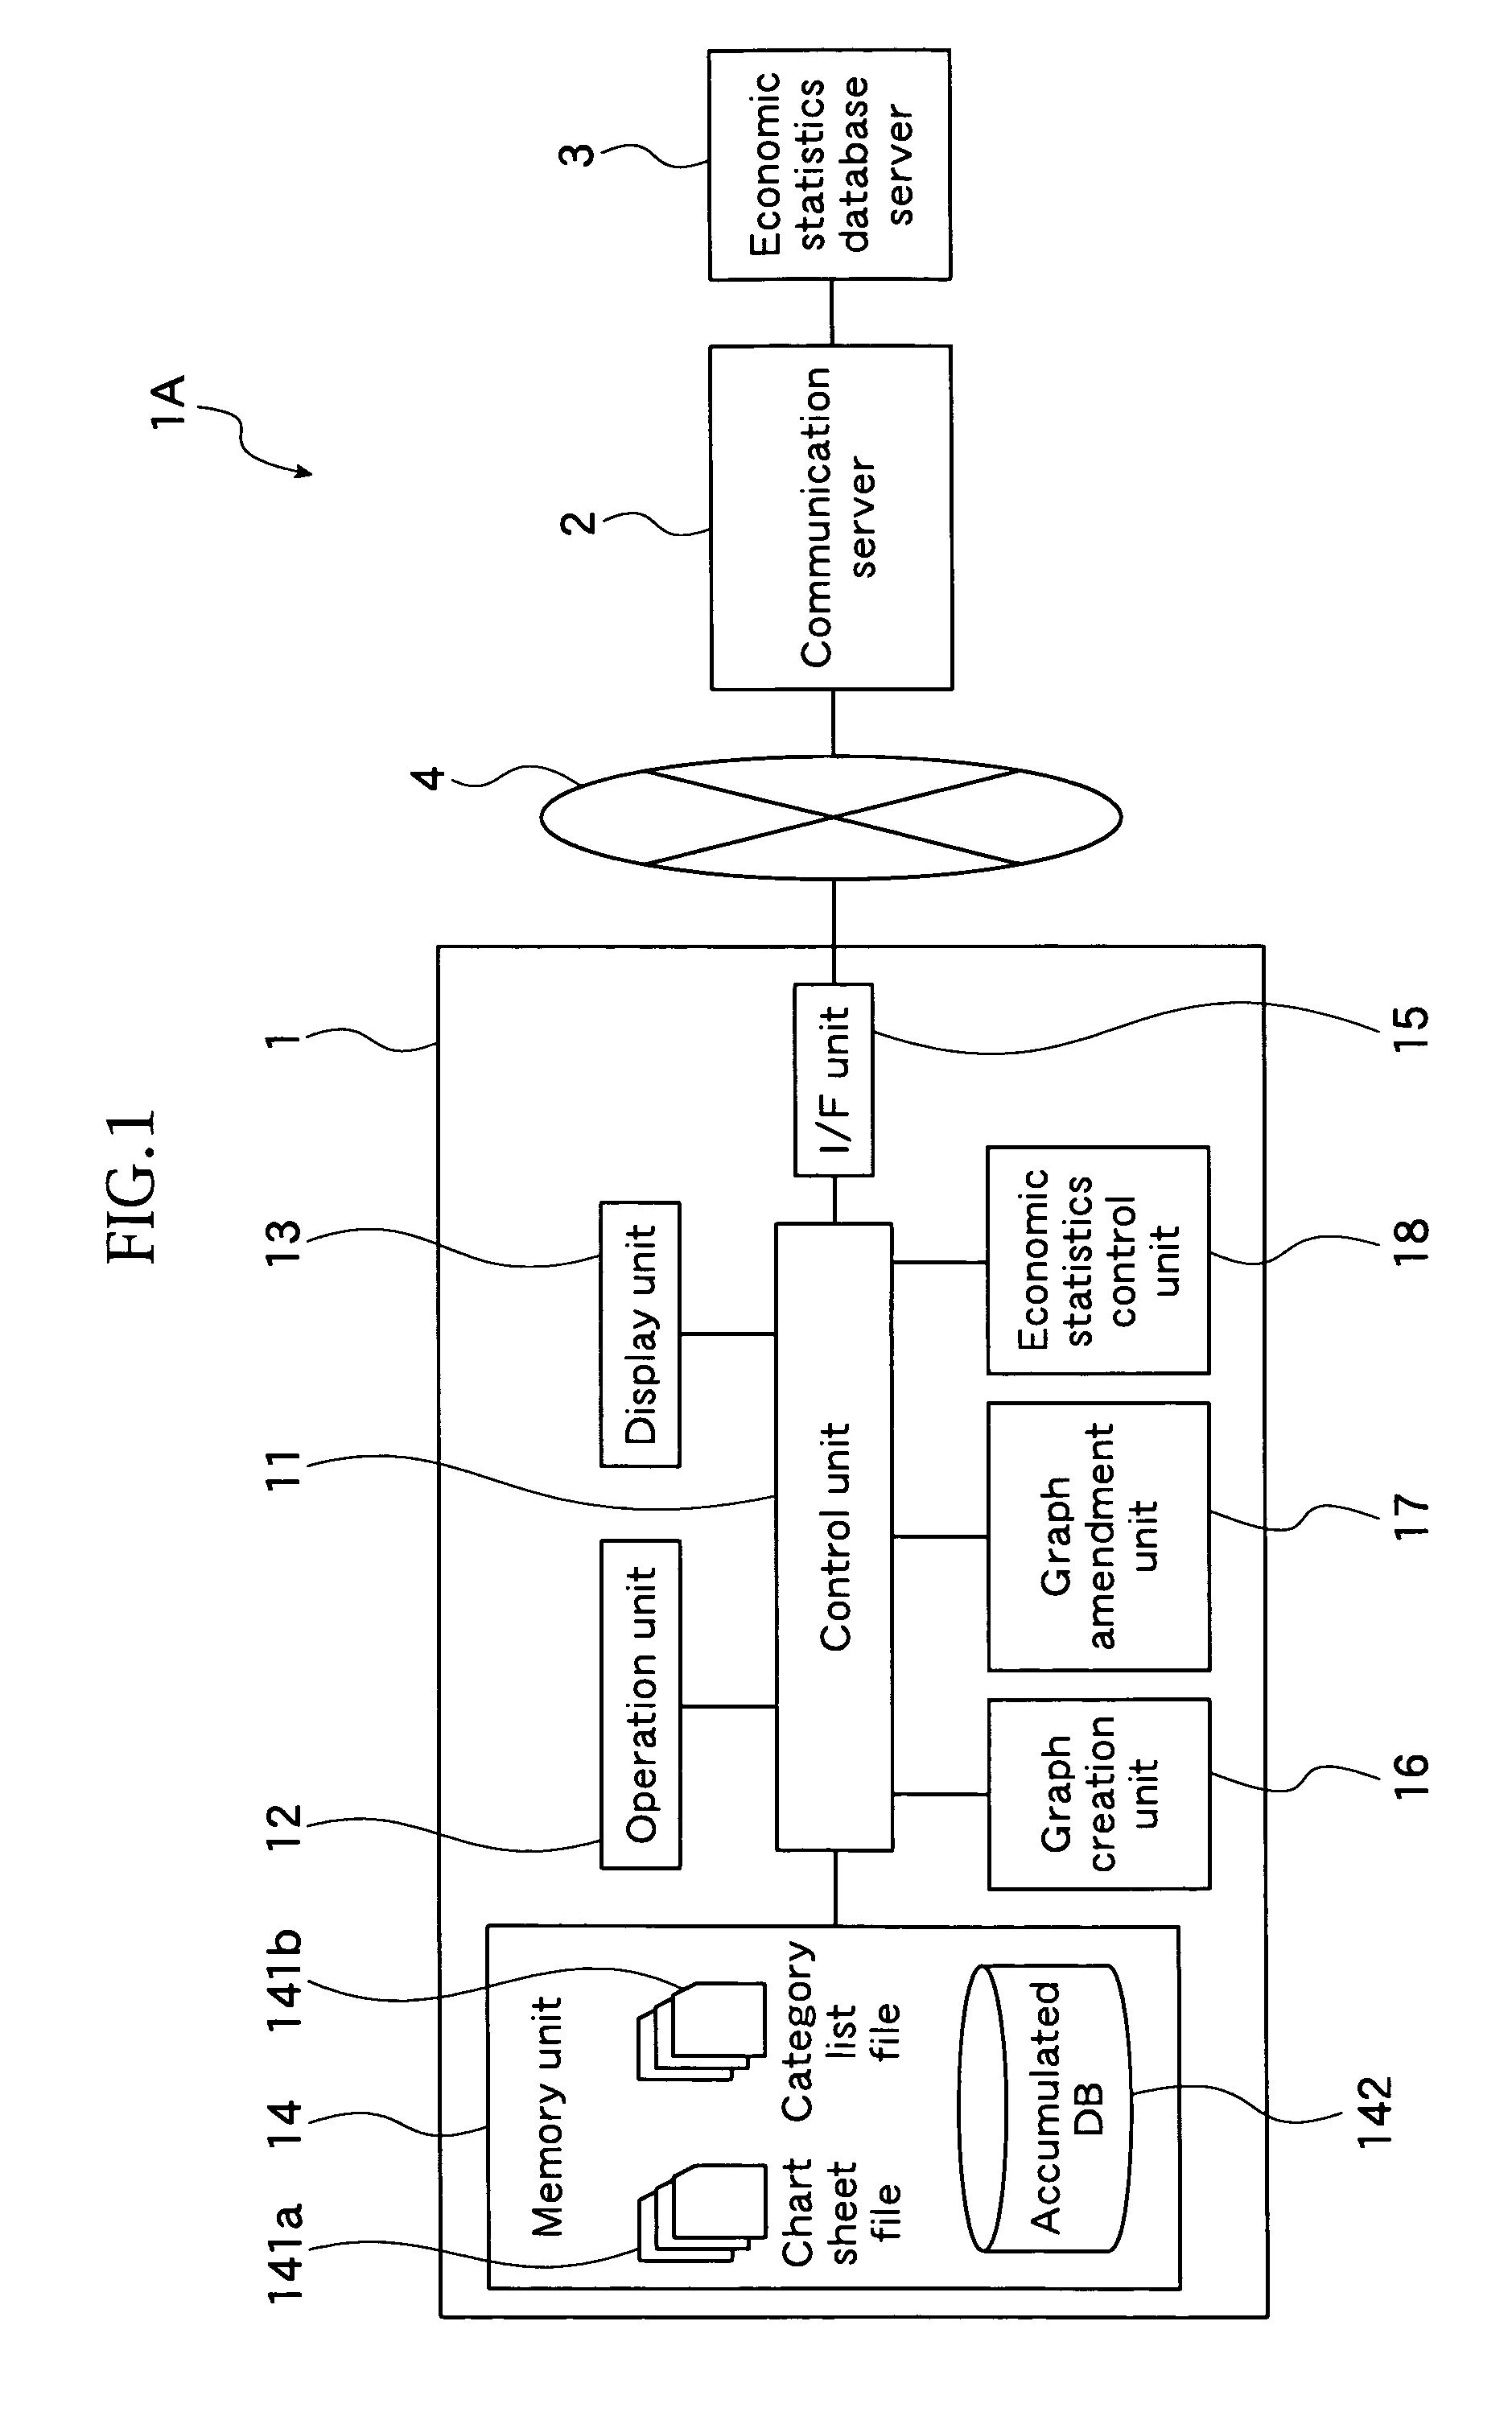
[0043]FIG. 1 is a system configuration and a functional block diagram showing a graph display system of the present invention. As shown in FIG. 1, the chart display system 1A comprises a graph display device 1, a communication server 2, an economic statistics database server 3 and the internet 4.

[0044]The graph display device 1 is represented by a computer terminal having a communication function, such as a personal computer, mobile computer, PDA (Personal Digital Assistance), radio communication terminal, etc., and is operative in a network environment. As shown in FIG. 1, the graph display device 1 has a control unit 11, operation unit 12, display unit 13, memory unit 14, interface unit (I / F unit) 15, graph creation unit (model-form information obtaining means, display-style decision means, model-form display means and numerical-value obtaining and displaying means) 16, graph amendment ...


PUM


Abstract

A graph creation unit of a chart display device desplays a plurality of charts (graphs), which is created by applying one graph-model form to a plurality of categories in a category list file, onto one graph destination sheet, by aligning and arranging the charts in the one graph destination sheet. The graph creation unit makes an economic statistics data control unit obtain a predetermined numerical values corresponding to the chart displayed on the graph destination sheet from an accumulated database or an economic statistics database server, and displays the obtained numerical values on the graph destination sheet in the form of individual chart.

Description

BACKGROUND OF THE INVENTION[0001]1. Field of the Invention[0002]The present invention relates to a chart display device for creating and displaying a chart, and program for the same.[0003]2. Prior Art of the Invention[0004]Charts or graphs such as line graphs, etc. have been used for displaying numeric values or changes in the numeric values, and used at ordinary presentations or presentations at scientific meetings, etc. A simple and easy method to create a graph has so far been desired. Various graph display systems for smoothly creating graphs using a terminal of a personal computer have been proposed (Japanese laid open patent publication No. 2003-288486).[0005]An easy-to-read display of a plurality of graphs can be achieved by a graph arrangement in which each graph has the same plot area size and is aligned and displayed. In the prior art described above, however, a plurality of graphs created in advance are copied and pasted on one display sheet by adjusting their size and po...

Claims


Application Information

Patent Timeline
Patent Type & Authority Patents(United States)
IPC IPC(8): G06T11/20G09G5/00G06Q10/10G09G5/36
CPCG06F17/211G06T11/206G06F17/248G06F17/246G06F40/103G06F40/18G06F40/186
Inventor SHINOHARA, NOBORUDOI, NAOHITOTSUCHIDA, KAZUHIROHIRAGA, MIHO
Owner I N INFORMATION SYST
Why Eureka
Try Eureka