Production method of indentation curve and hardness test method

a production method and indentation curve technology, applied in the direction of instruments, measuring devices, investigating material hardness, etc., can solve the problems of difficult to set the optimum load range (df) or displacement range (dh), the measurement speed is increased, and the conversion speed is increased. , to achieve the effect of reducing the accuracy of a/d and increasing the measurement speed

Inactive Publication Date: 2009-07-28
NAT INST FOR MATERIALS SCI
View PDF1 Cites 23 Cited by
  • Summary
  • Abstract
  • Description
  • Claims
  • Application Information

AI Technical Summary

Benefits of technology

[0014]In the production method of the indentation curve above mentioned, second, the invention of the application provides a production method which comprises setting the determination range based on an (i−1)th (here, i is an natural numbers) measurement value as a reference; third, it provides a production method which comprises using a temporarily measurement value as an ith measurement value when the temporarily measurement value obtained by the temporarily measurement is out of the determination range; fourth, it provides a production method wherein measurement speed is increased by decreasing the number of measurement times at one temporarily measurement point; fifth, it provides a production method wherein conversion speed is increased in the temporarily measurement by reducing accuracy of A / D conversion of the temporarily measurement value from an analog signal to a digital signal; sixth, it provides a production method wherein indentation depth when indentation force is gradually changed is temporarily measured in a rage where a change level in indentation force is large, and indentation force when indentation depth is gradually changed is temporarily measured in a range where a change level of the indentation depth is large; seventh, it provides a production method wherein the determination range is in a circular, elliptic, or rectangular shape using an (i−1)th measurement point as a center.

Problems solved by technology
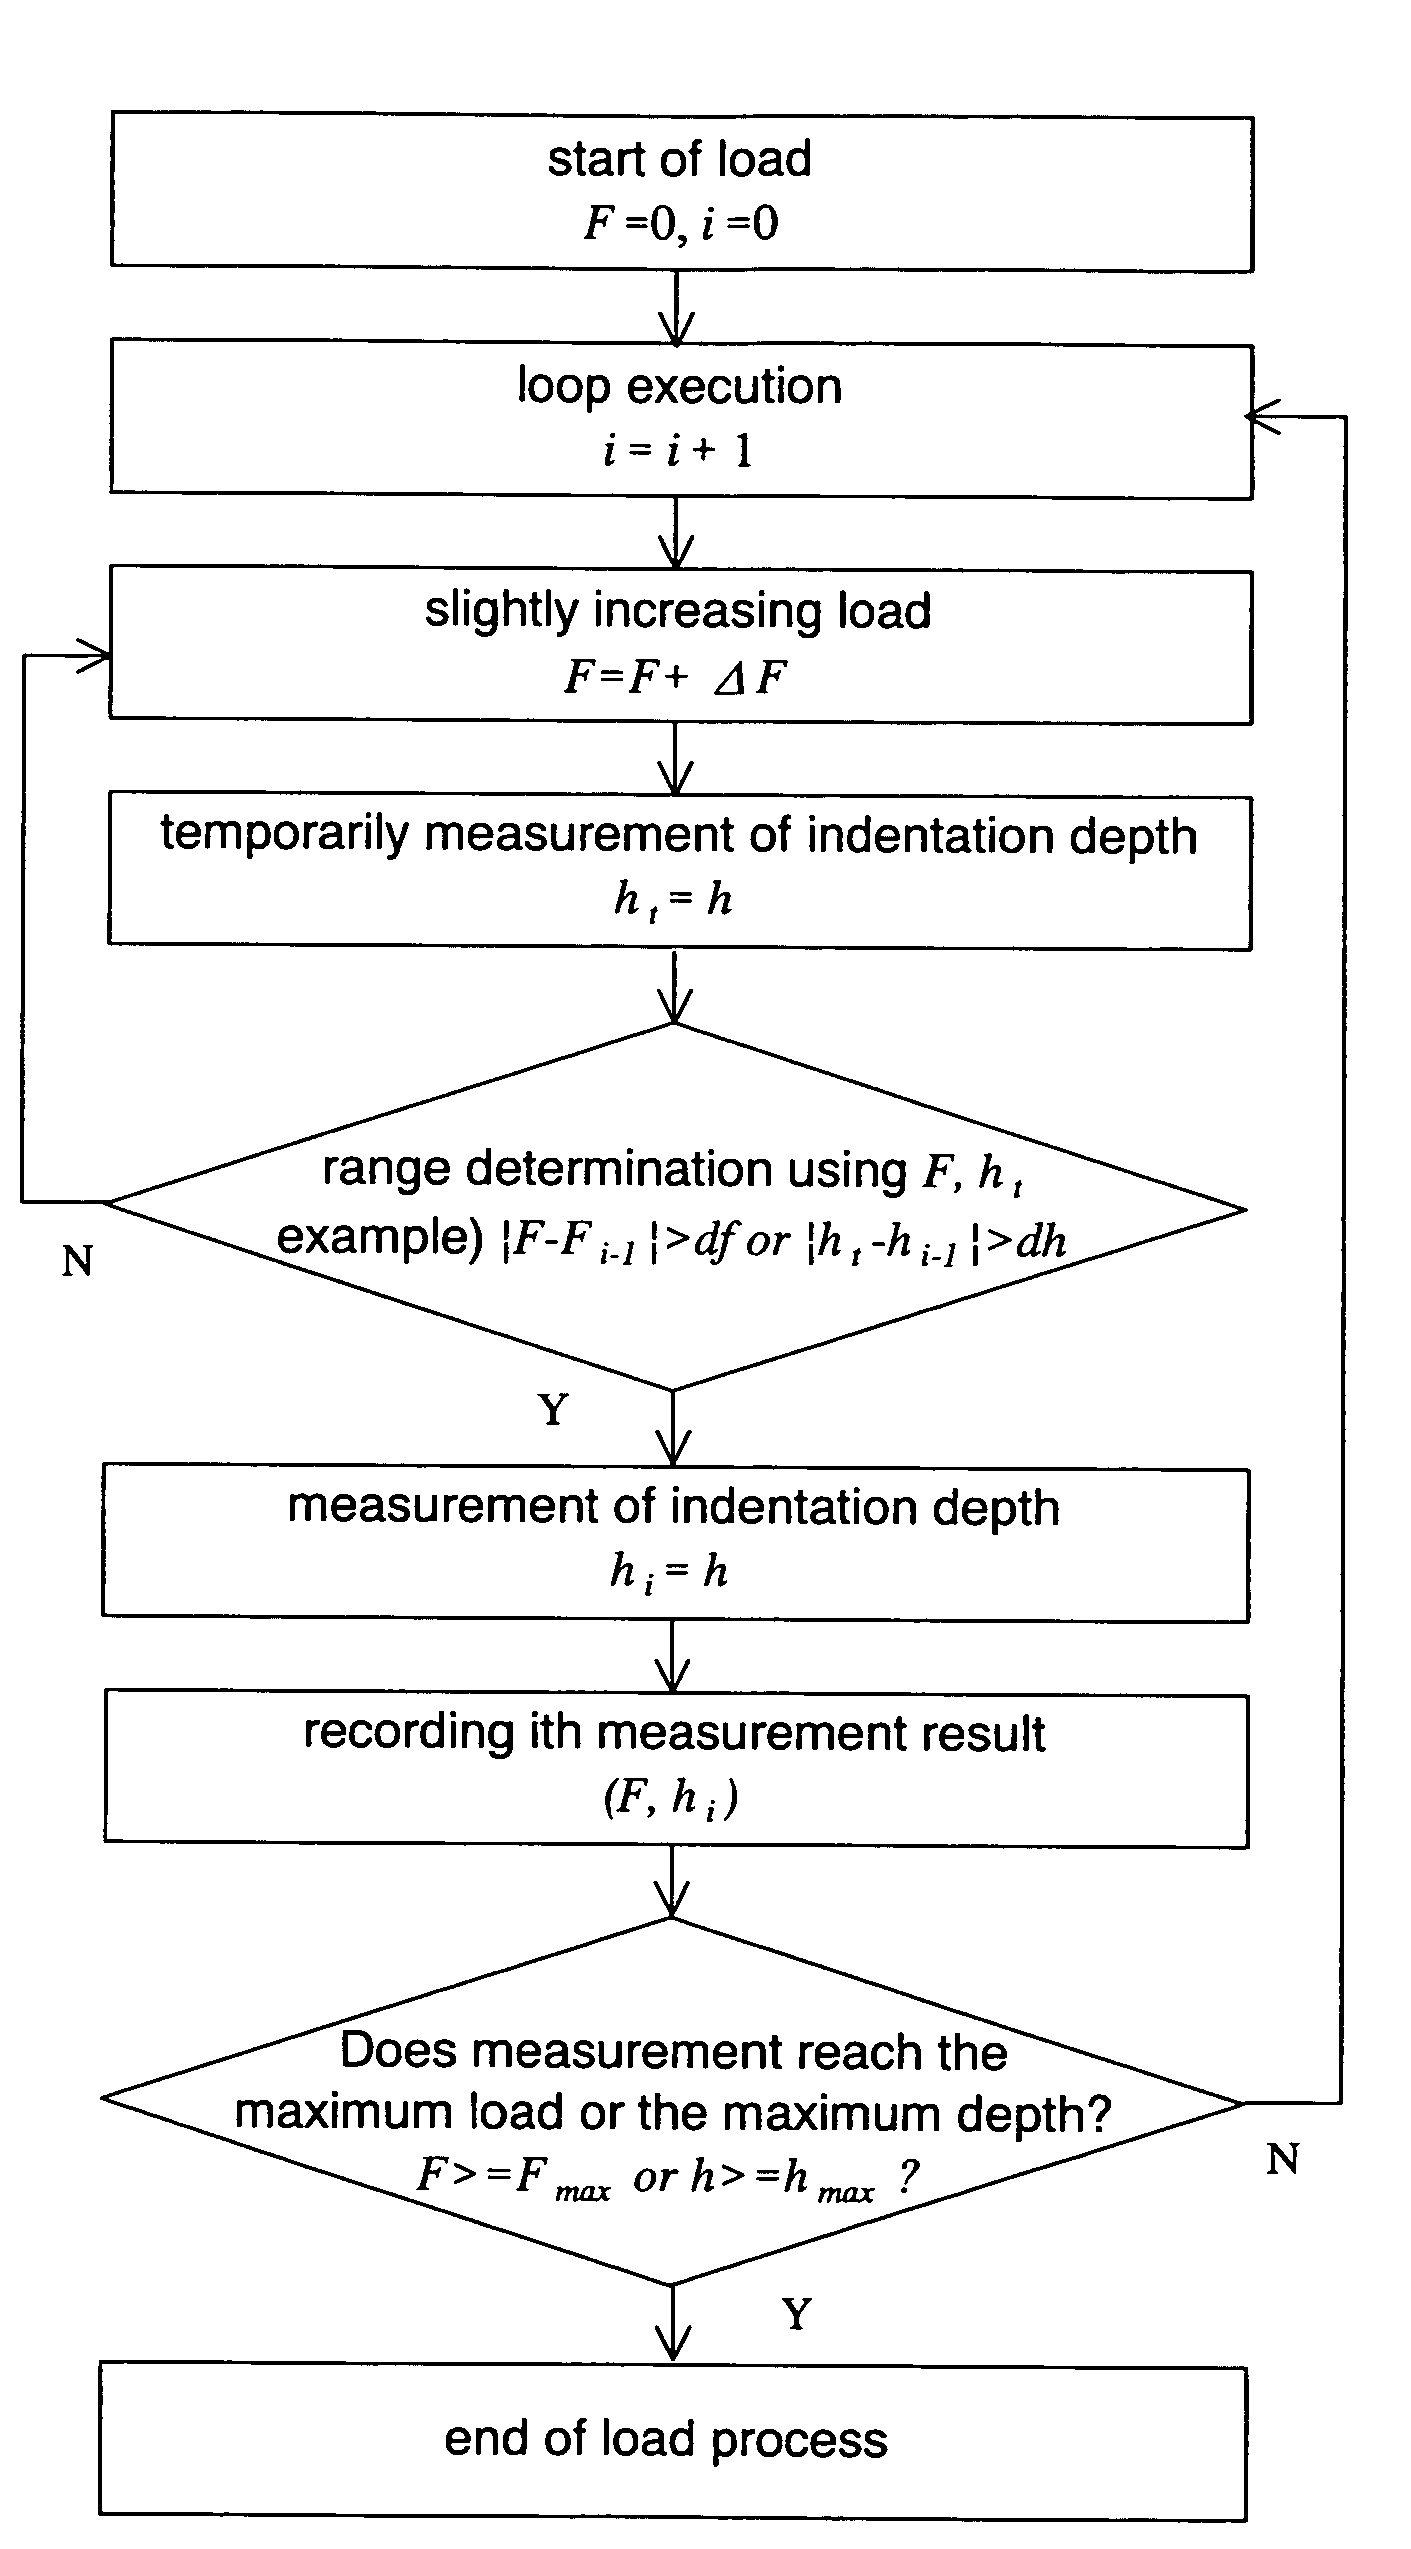
Moreover, in the micro hardness test and the like, it is not sufficient only to obtain indentation depth at the maximum load when the indenter is indented into the sample, and it is required to obtain a relationship between continuous indentation force from load to unload and indentation depth, that is, an indentation curve, as schematically shown in FIG. 1.
Here, when the sample is uniform, the optimum load range (df) can be determined by performing tests several times. However, when the sample is not uniform, for example, when hardness has distribution, there have been problems that since results are essentially different depending on places, the test must be performed at an unnecessary small load range (df) on the assumption that the softest portion may be tested to secure a certain data point density, consequently much time is required for measurement, and the test is easily influenced by temperature drift.
Such problems are the same in the displacement control method in which sufficient data point density is not obtained for various indentation curves having different gradients, or an experiment at an unnecessarily small displacement range (dh) is forced to be conducted.
Moreover, in the case of the indentation curve having the characteristic point as shown in FIG. 2, there has been a problem that the optimum load range (df) or displacement range (dh) is hard to be set in the case that a position of the characteristic point can not be expected.

Method used


Image

  • Production method of indentation curve and hardness test method
  • Production method of indentation curve and hardness test method
  • Production method of indentation curve and hardness test method

Examples


example 1

[0071]Tungsten single crystal, which was used as a standard sample in a super-micro hardness test, was used for a sample, and indentation curves were produced by various control methods using the same indenter and hardness tester. Results are shown in FIGS. 9 to 12. FIG. 9 shows an indentation curve obtained by a usual load control method, FIG. 10 shows an indentation curve obtained by a usual displacement control method, FIG. 11 shows an indentation curve obtained by the method of the invention of the application, and FIG. 12 shows a view of plotting results of FIGS. 9 to 11 on one graph.

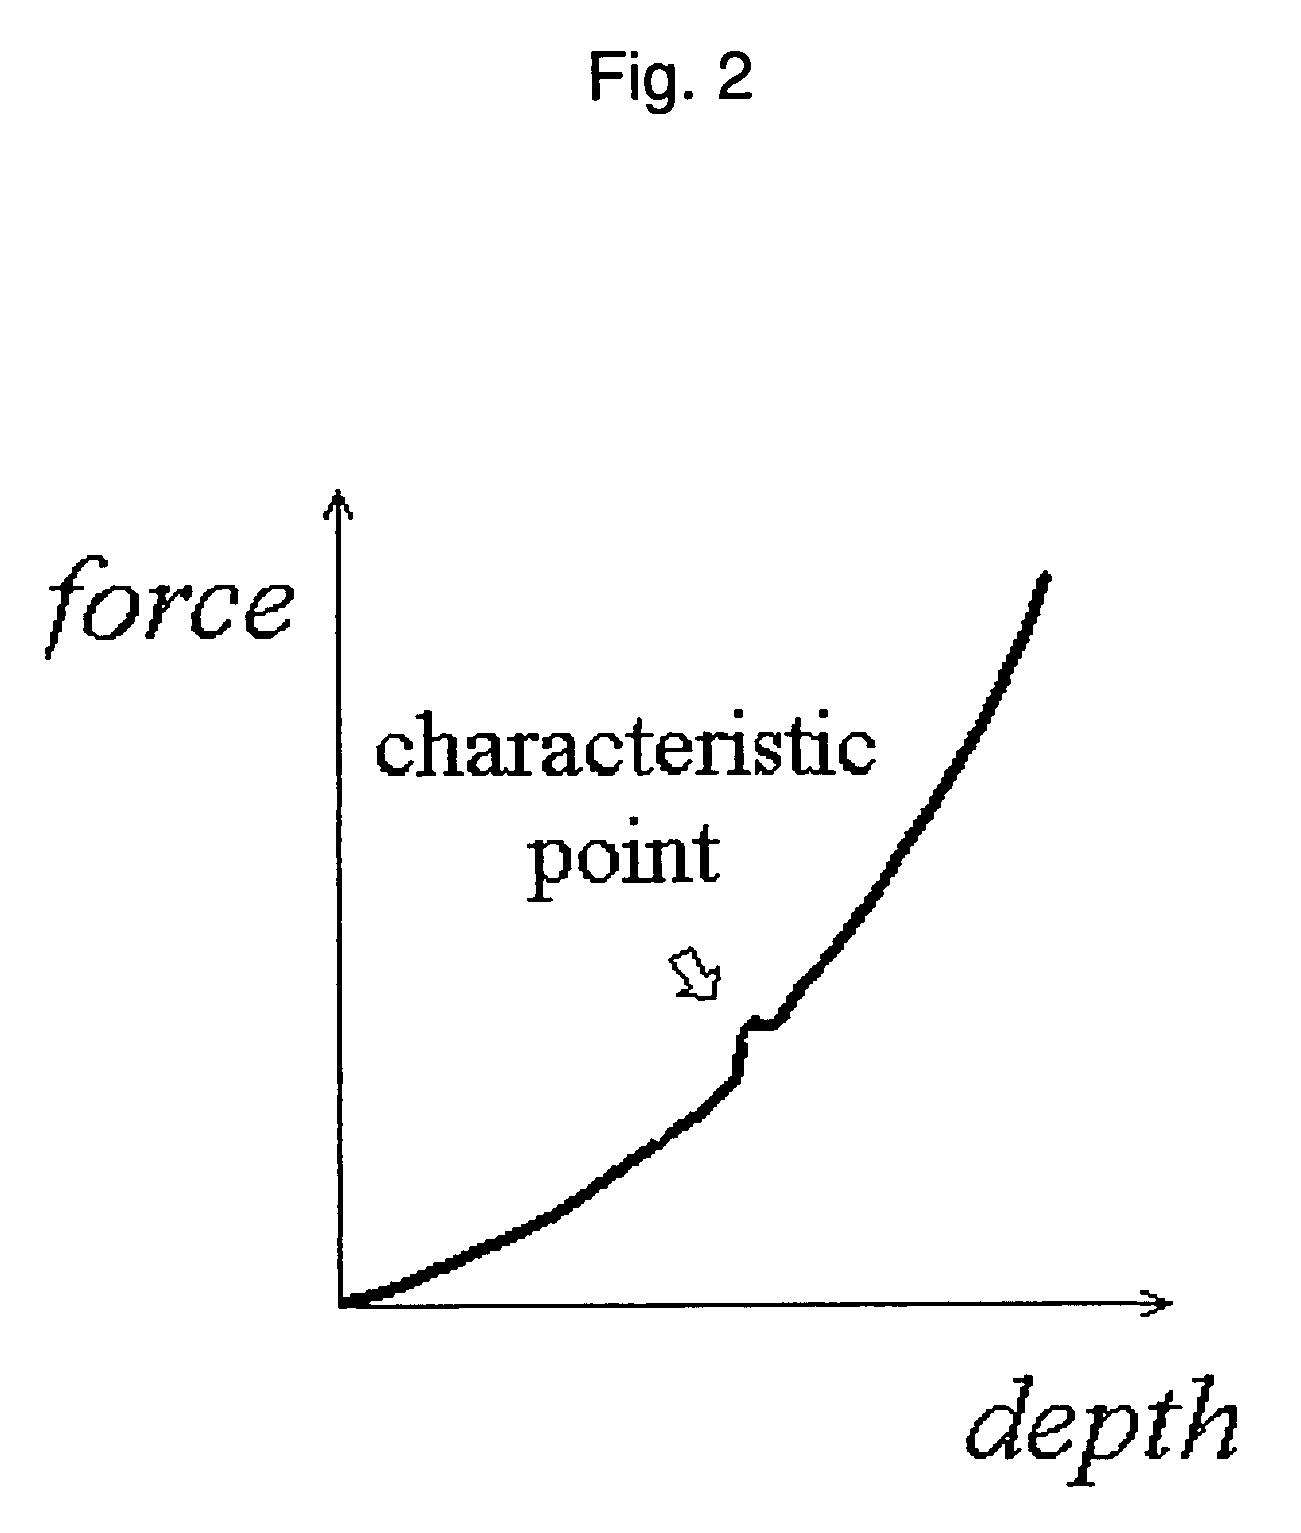
[0072]First, it was confirmed from FIG. 12 that plotted points were not significantly displaced in any of indentation curves of FIGS. 9 to 11, therefore absolute values of the indentation curves were not affected by difference in control methods. A discontinuous portion shown by an arrow in the view of FIG. 12 shows a phenomenon called pop-in, which is considered as a transient point from elastic d...

example 2

[0077]The production method of the indentation curve of the invention of the application and the production method of the indentation curve by the load control method of the usual method were compared by simulation. Preconditions for the simulation were as follows.[0078]An indentation curve is expressed in a form of F=c×H2 (here, c is a proportional constant depending on material).[0079]A sample is uneven, and has hard and soft portions by 50% each.[0080]One second is required for obtaining one data point (measurement value), including time for A / D conversion and averaging.[0081]Temporarily measurement enables measurement at a speed (that is, 0.01 see) 100 times higher than a speed in usual measurement.

[0082]FIGS. 13 and 14 illustrate results of simulation of indentation curves obtained at the above conditions by the usual method and the method of the invention of the application, respectively. Each of figures shows that a curve at the left in the figure is an indentation curve obta...


PUM

PropertyMeasurementUnit
sizeaaaaaaaaaa
indentation depthaaaaaaaaaa
timeaaaaaaaaaa

Abstract

A production method of an indentation curve is given, in which when an indentation curve showing a relationship between indentation force and indentation depth in a process of indenting an indenter into a surface of a sample is produced, a measurement range using an (i−n)th (here, i and n are natural numbers) measurement value as a reference is provided, and the indentation depth or indentation force is temporarily measured when the indentation force or indentation depth is gradually changed, respectively, and when a temporarily measurement value obtained by the temporarily measurement is out of the determination range, indentation depth at the relevant indentation force or indentation force at the relevant indentation depth is measured and set as an ith measurement value, or the temporarily measurement value is used as the ith measurement value.

Description

TECHNICAL FIELD[0001]The invention of the application relates to a production method of an indentation curve and a hardness test method. More particularly, the invention relates to a production method of an indentation curve that enables production of an indentation curve more accurately and efficiently, and a hardness test method using the indentation curve.BACKGROUND ART[0002]A micro hardness test or a super-micro hardness test, which can examine a mechanical property of a microstructure of a material, are expansively used as a measurement method of a material in wide fields such as semiconductor and micro machining in recent years.[0003]In the micro hardness test or the super-micro hardness test (hereinafter, simply called micro hardness test and the like), a method is widely used, in which a relationship between indentation force (F) and indentation depth (h) in an indentation process of indenting an indenter into a surface of a sample, so-called an indentation curve is obtained...

Claims


Application Information

Patent Timeline
Patent Type & Authority Patents(United States)
IPC IPC(8): G01N3/48
CPCG01N3/42G01N2203/0218G01N2203/0208
Inventor MIYAHARA, KENSUKE
Owner NAT INST FOR MATERIALS SCI
Why Eureka
Try Eureka