System and method for risk-adjusting indicators of access and utilization based on metrics of distance and time

a technology of distance and time and risk adjustment, applied in the field of system and method of risk adjustment indicators of access and utilization of health care services, can solve the problems of life-threatening condition, perforated appendix, poor survival or quality of life of patients with newly diagnosed cancer, etc., to improve the accuracy of estimated moments, simplify the complexity of estimation, and reduce the effect of precision

Inactive Publication Date: 2009-11-10
CERNER INNOVATION
View PDF5 Cites 16 Cited by
  • Summary
  • Abstract
  • Description
  • Claims
  • Application Information

AI Technical Summary

Benefits of technology

[0023]“Aggregation” and “norming” to macro sociopolitical levels (national or other), which obscures detailed small-area variation in access and composition of groups under study and prevents interpretation of differences among these groups.
[0024]The distance index described in the present invention avoids these pitfalls. First, by using resident-level case data the resulting index differentiates accurately between different locales within a county. Only two variables are required for each locale, one from each of the two following categories:
[0027]The method for calculating the distance index described herein further provides for automatic calculation of optimal parameters for a power transform, such that approximate normality for the purpose of statistical inferencing is achieved.
[0042]In general, random variation is most problematic when there are relatively few observations per provider, when adverse outcome rates are relatively low, and when providers have little control over patient outcomes or variation in important processes of care is minimal. If a large number of patient factors that are difficult to observe influence whether or not a patient has an adverse outcome, it may be difficult to separate the “quality signal” from the noise in which it is embedded. Two techniques are applied to improve the precision of an indicator:
[0073]Equation (5) in combination with estimates of the required moment matrices provides the basis for estimates of hospital quality or health service area quality with regard to care access. Such estimates of hospital quality have a number of attractive properties. First, they incorporate information in a systematic way from many outcome indicators and many years into the predictions of any one outcome. Moreover, if the moment matrices were known, the estimates of hospital quality represent the optimal linear predictors, based on a mean squared error criterion. Finally, these estimates maintain many of the attractive aspects of existing Bayesian approaches, while dramatically simplifying the complexity of the estimation. It is possible to construct univariate smoothed estimates of hospital quality, based only on empirical estimates for particular measures, using the models just described but restricting the dimension of Mj to only a particular indicator k and time period t. Of course, to the extent that the provider indicators are correlated with each other and over time, this will result in a less precise estimate.

Problems solved by technology

Patients with newly diagnosed cancer may have poor survival or quality of life if their cancer management (chemotherapy, radiotherapy, etc.) is delayed more than a few weeks following diagnosis.
Patients with appendicitis who do not have ready access to surgical evaluation may experience delays in receiving needed care, which can result in a life-threatening condition—perforated appendix.

Method used


Image

  • System and method for risk-adjusting indicators of access and utilization based on metrics of distance and time
  • System and method for risk-adjusting indicators of access and utilization based on metrics of distance and time
  • System and method for risk-adjusting indicators of access and utilization based on metrics of distance and time

Examples


Embodiment Construction

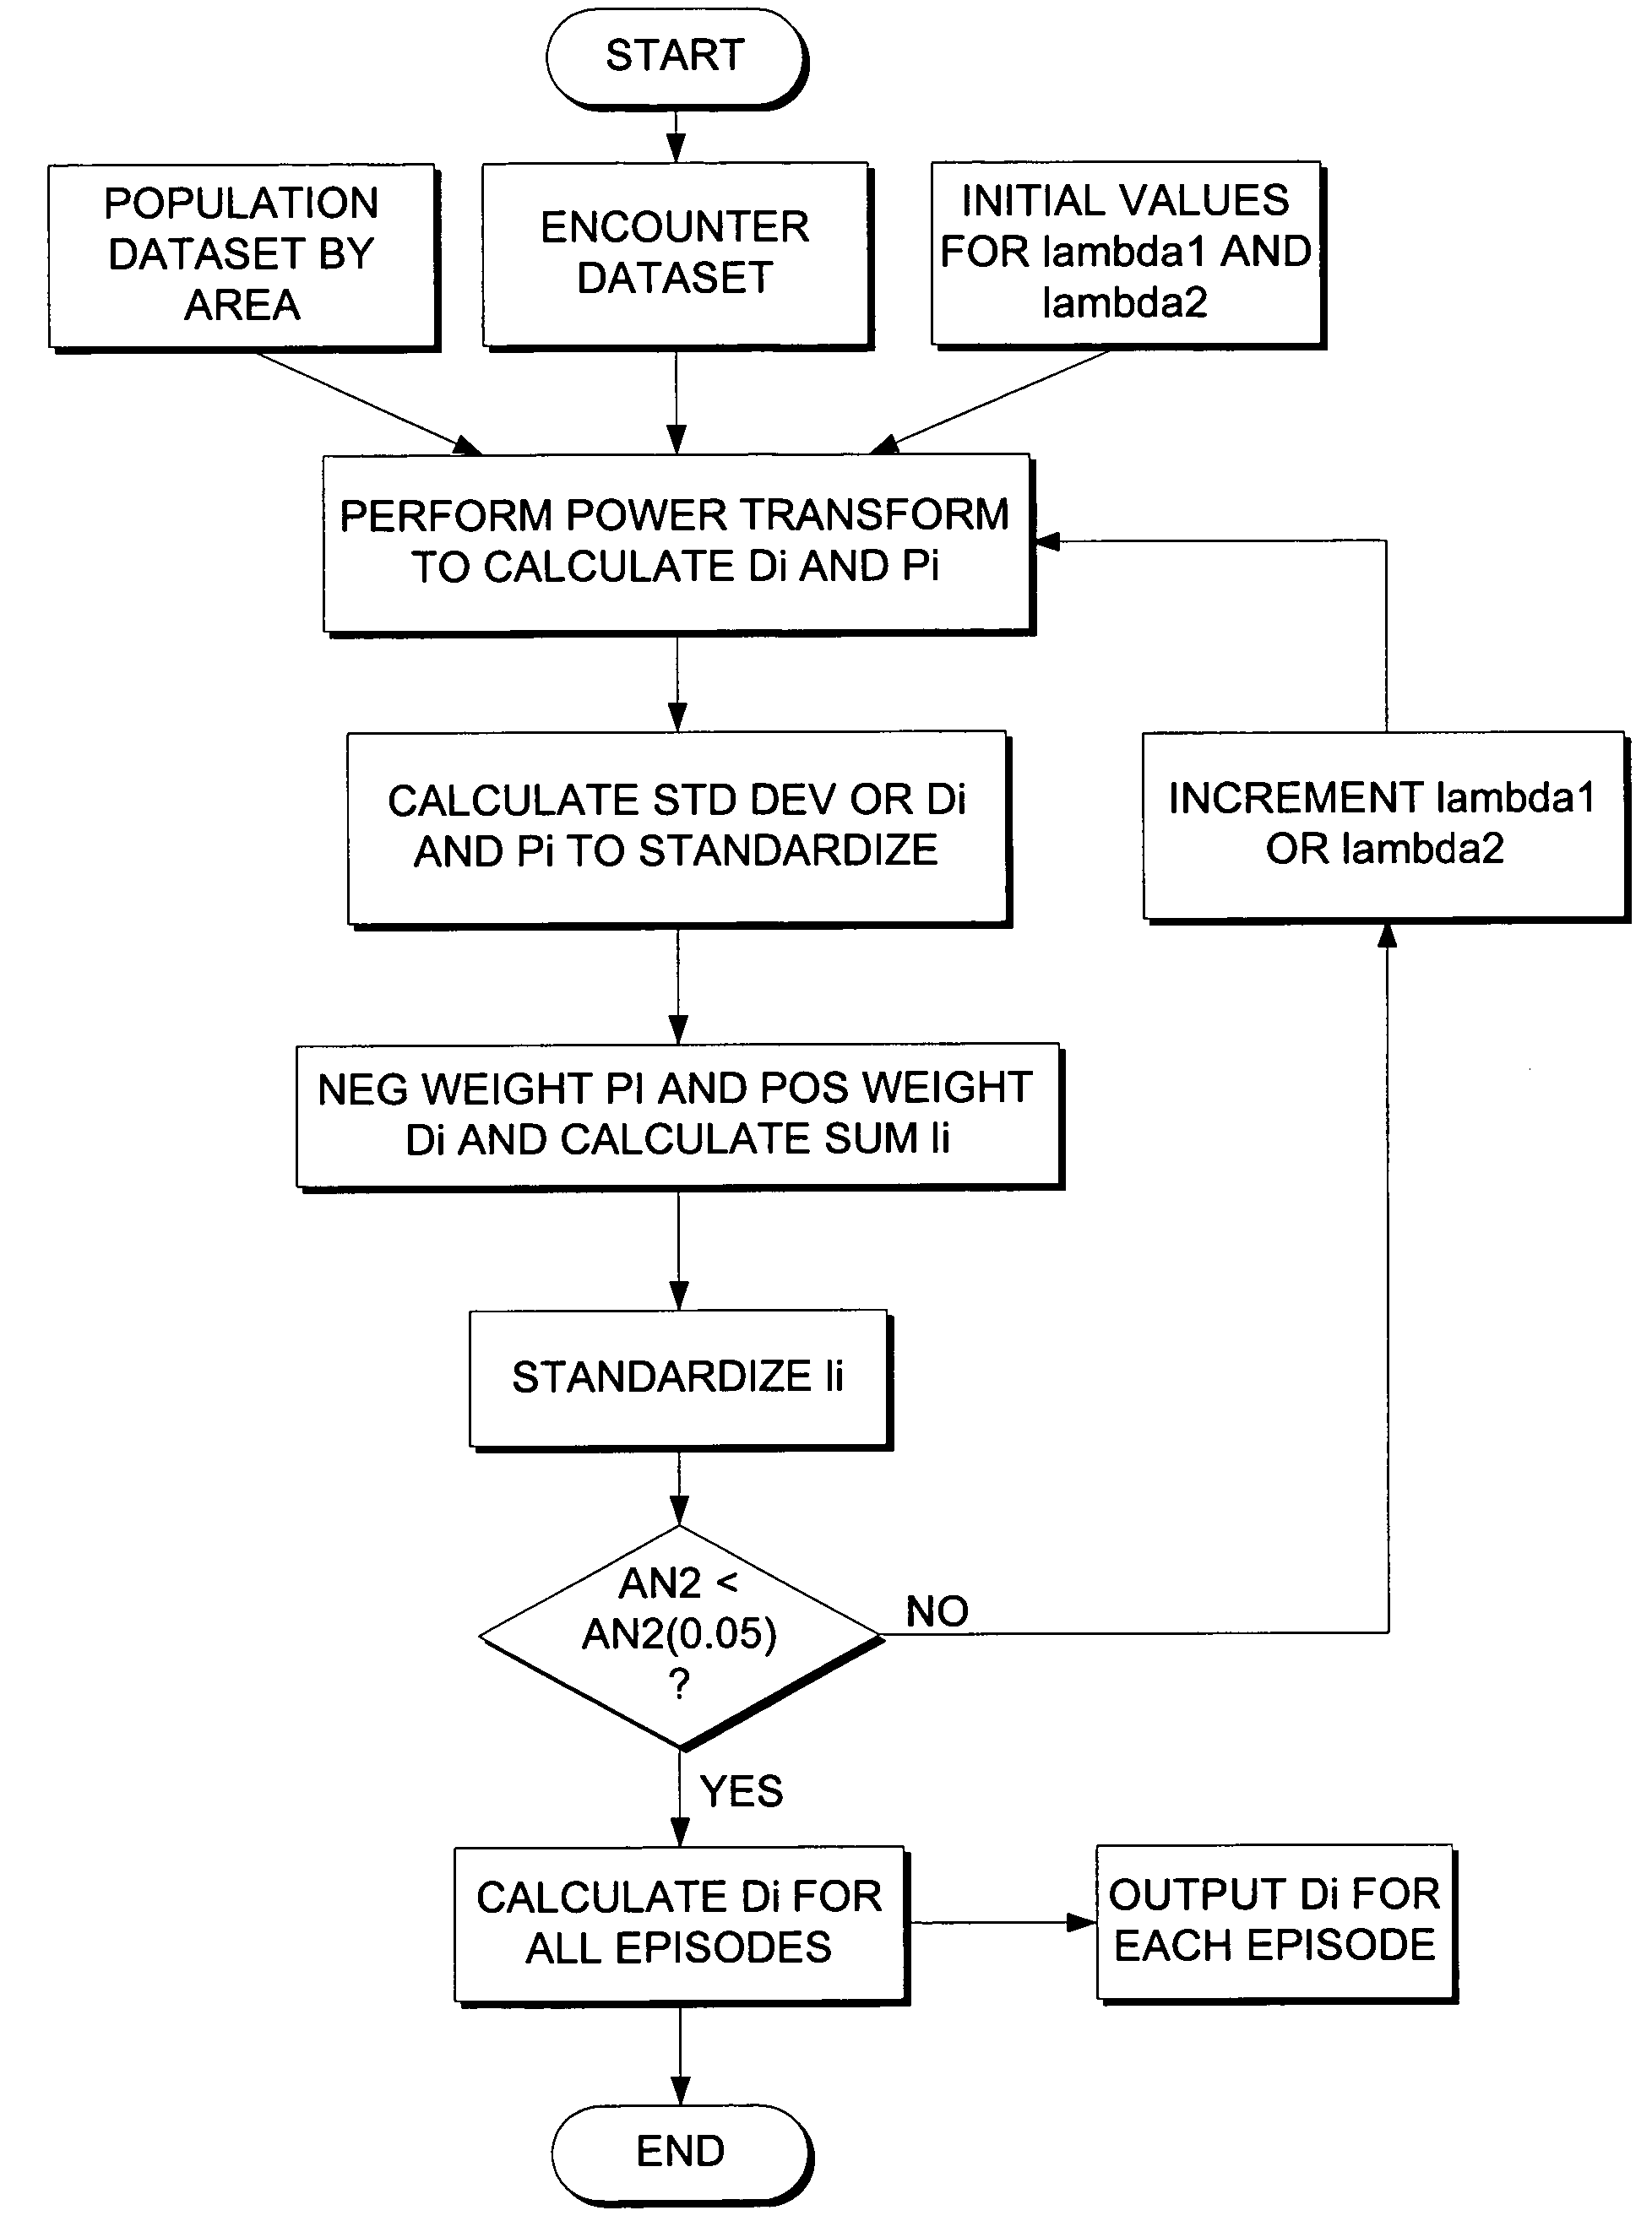
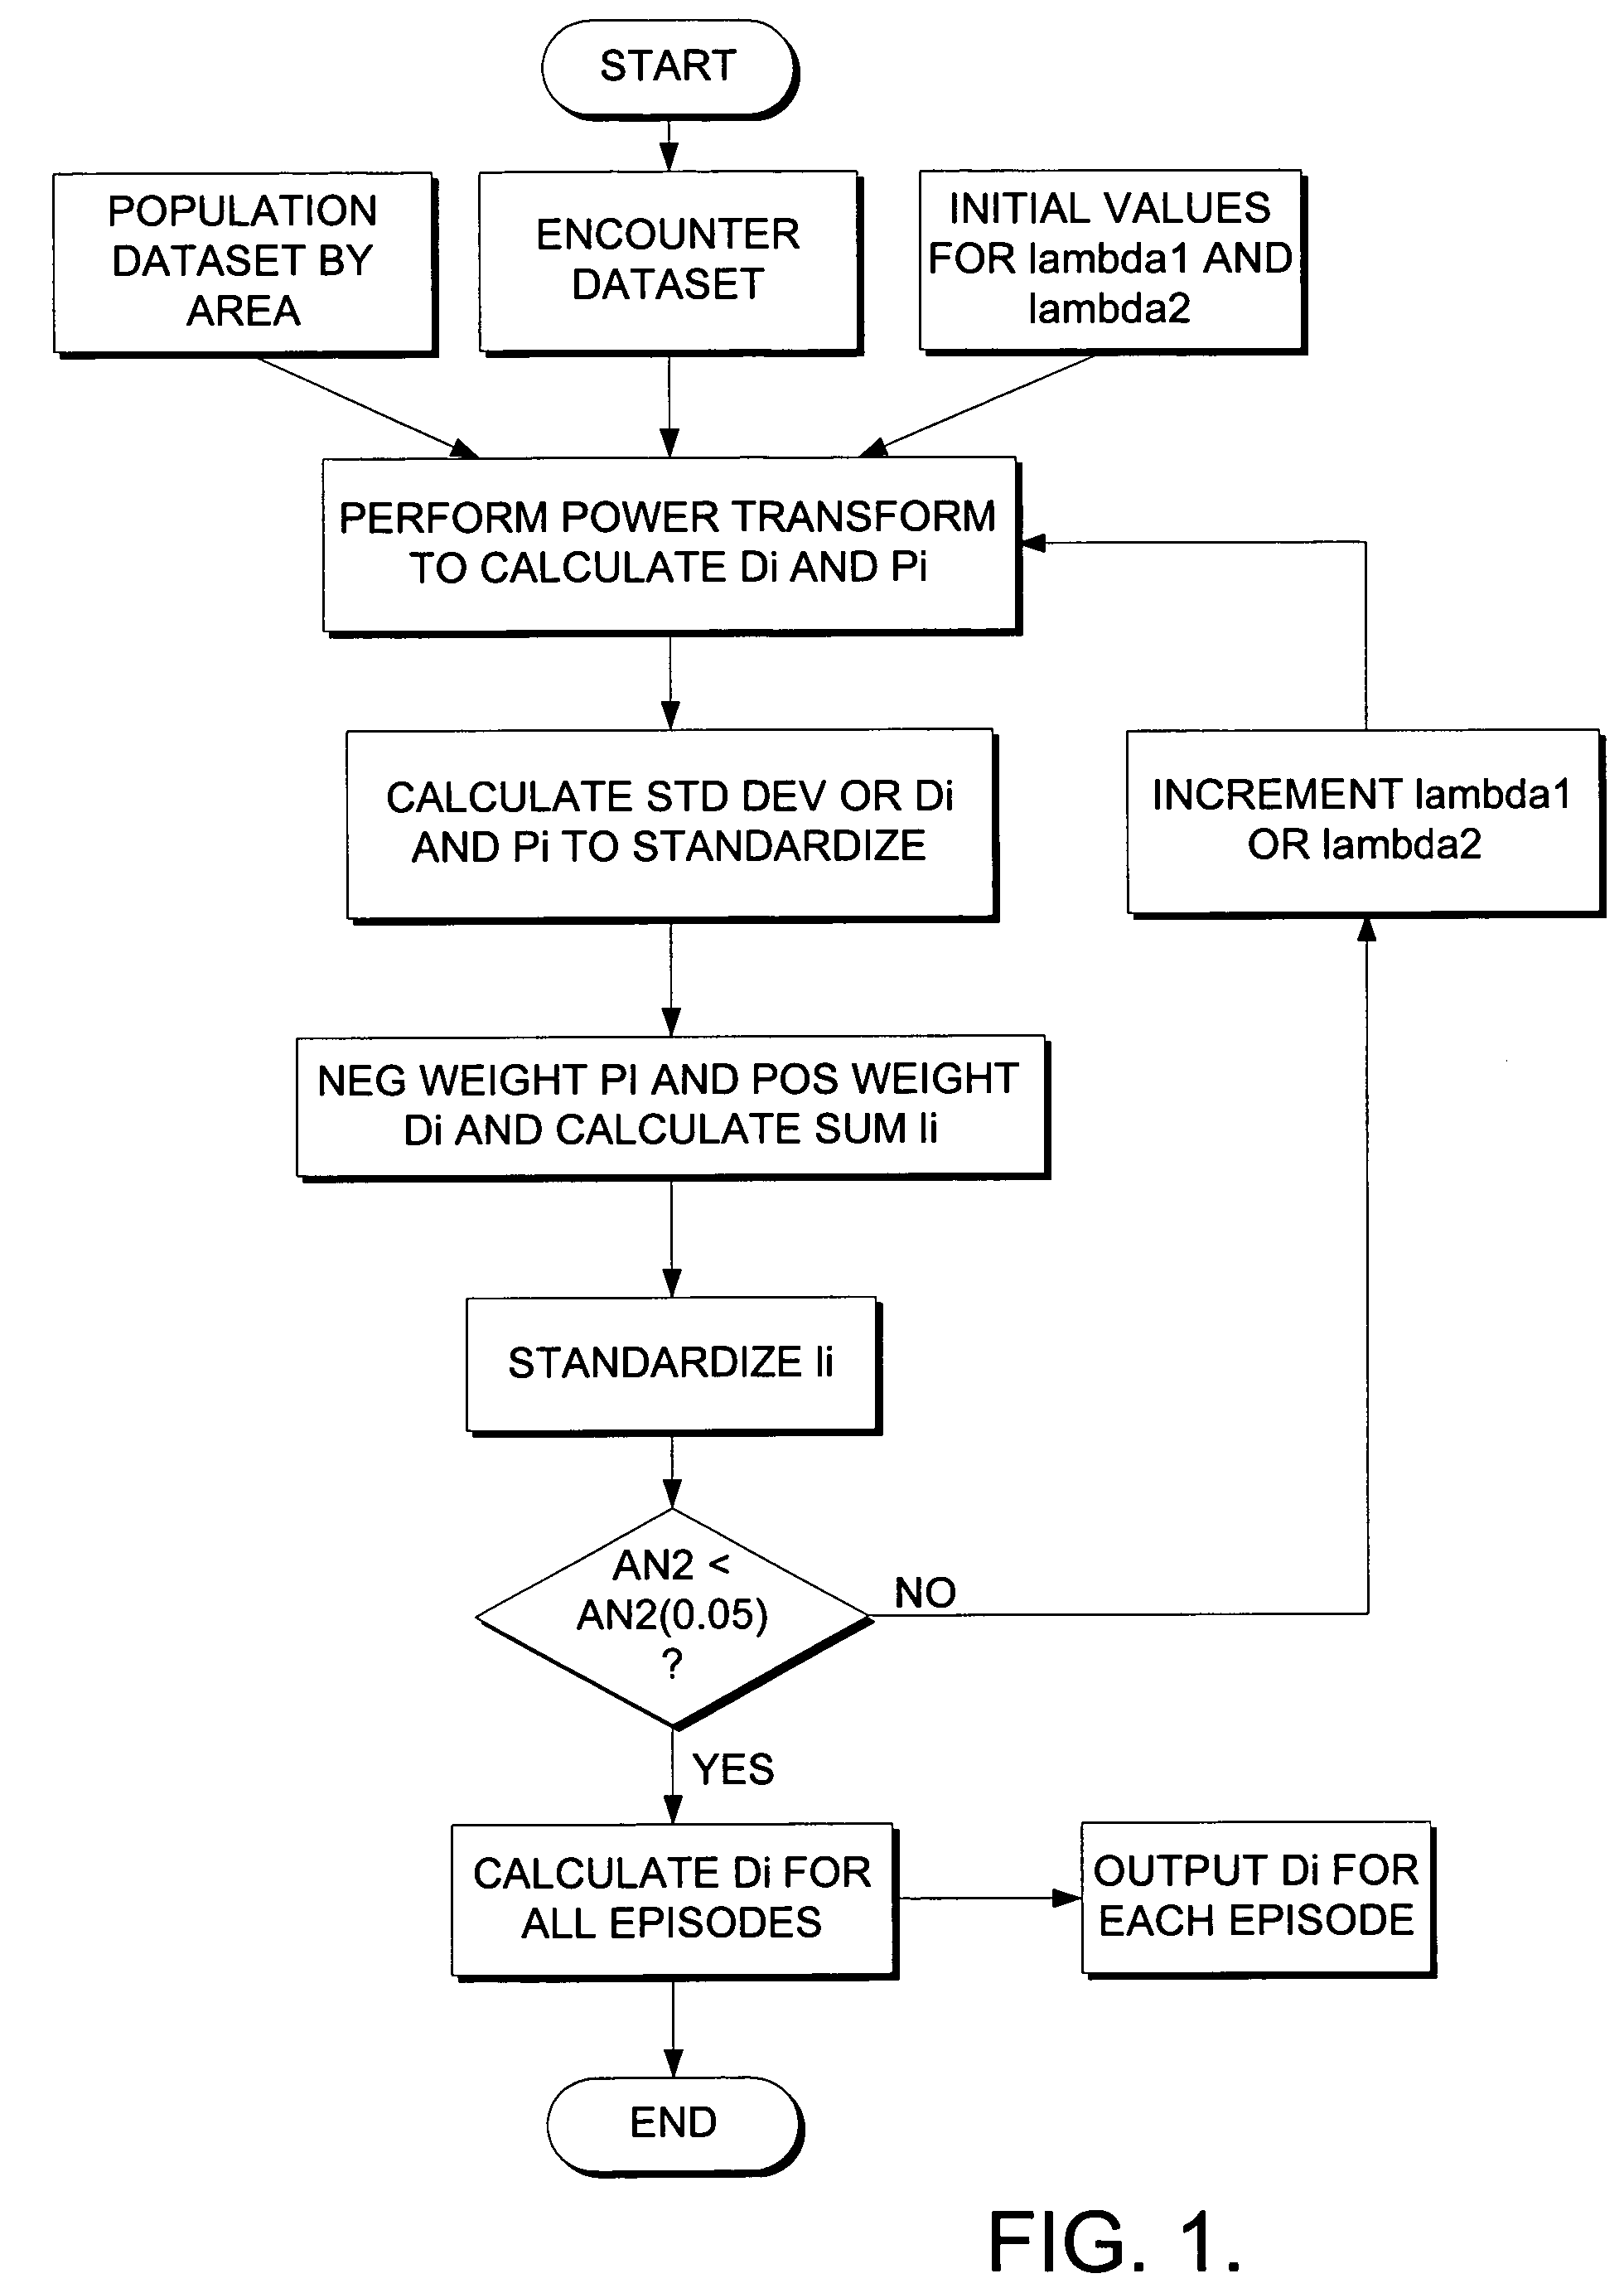
[0083]Referring now to FIG. 1, a diagram is shown of the elements comprising the method and system for generating the locally normed distance index and verifying and validating whether such an index achieves adequate goodness of fit in the intended geographic region of deployment, sufficient for satisfactory performance in the use for risk-adjusting indicators of access to and utilization of health services.

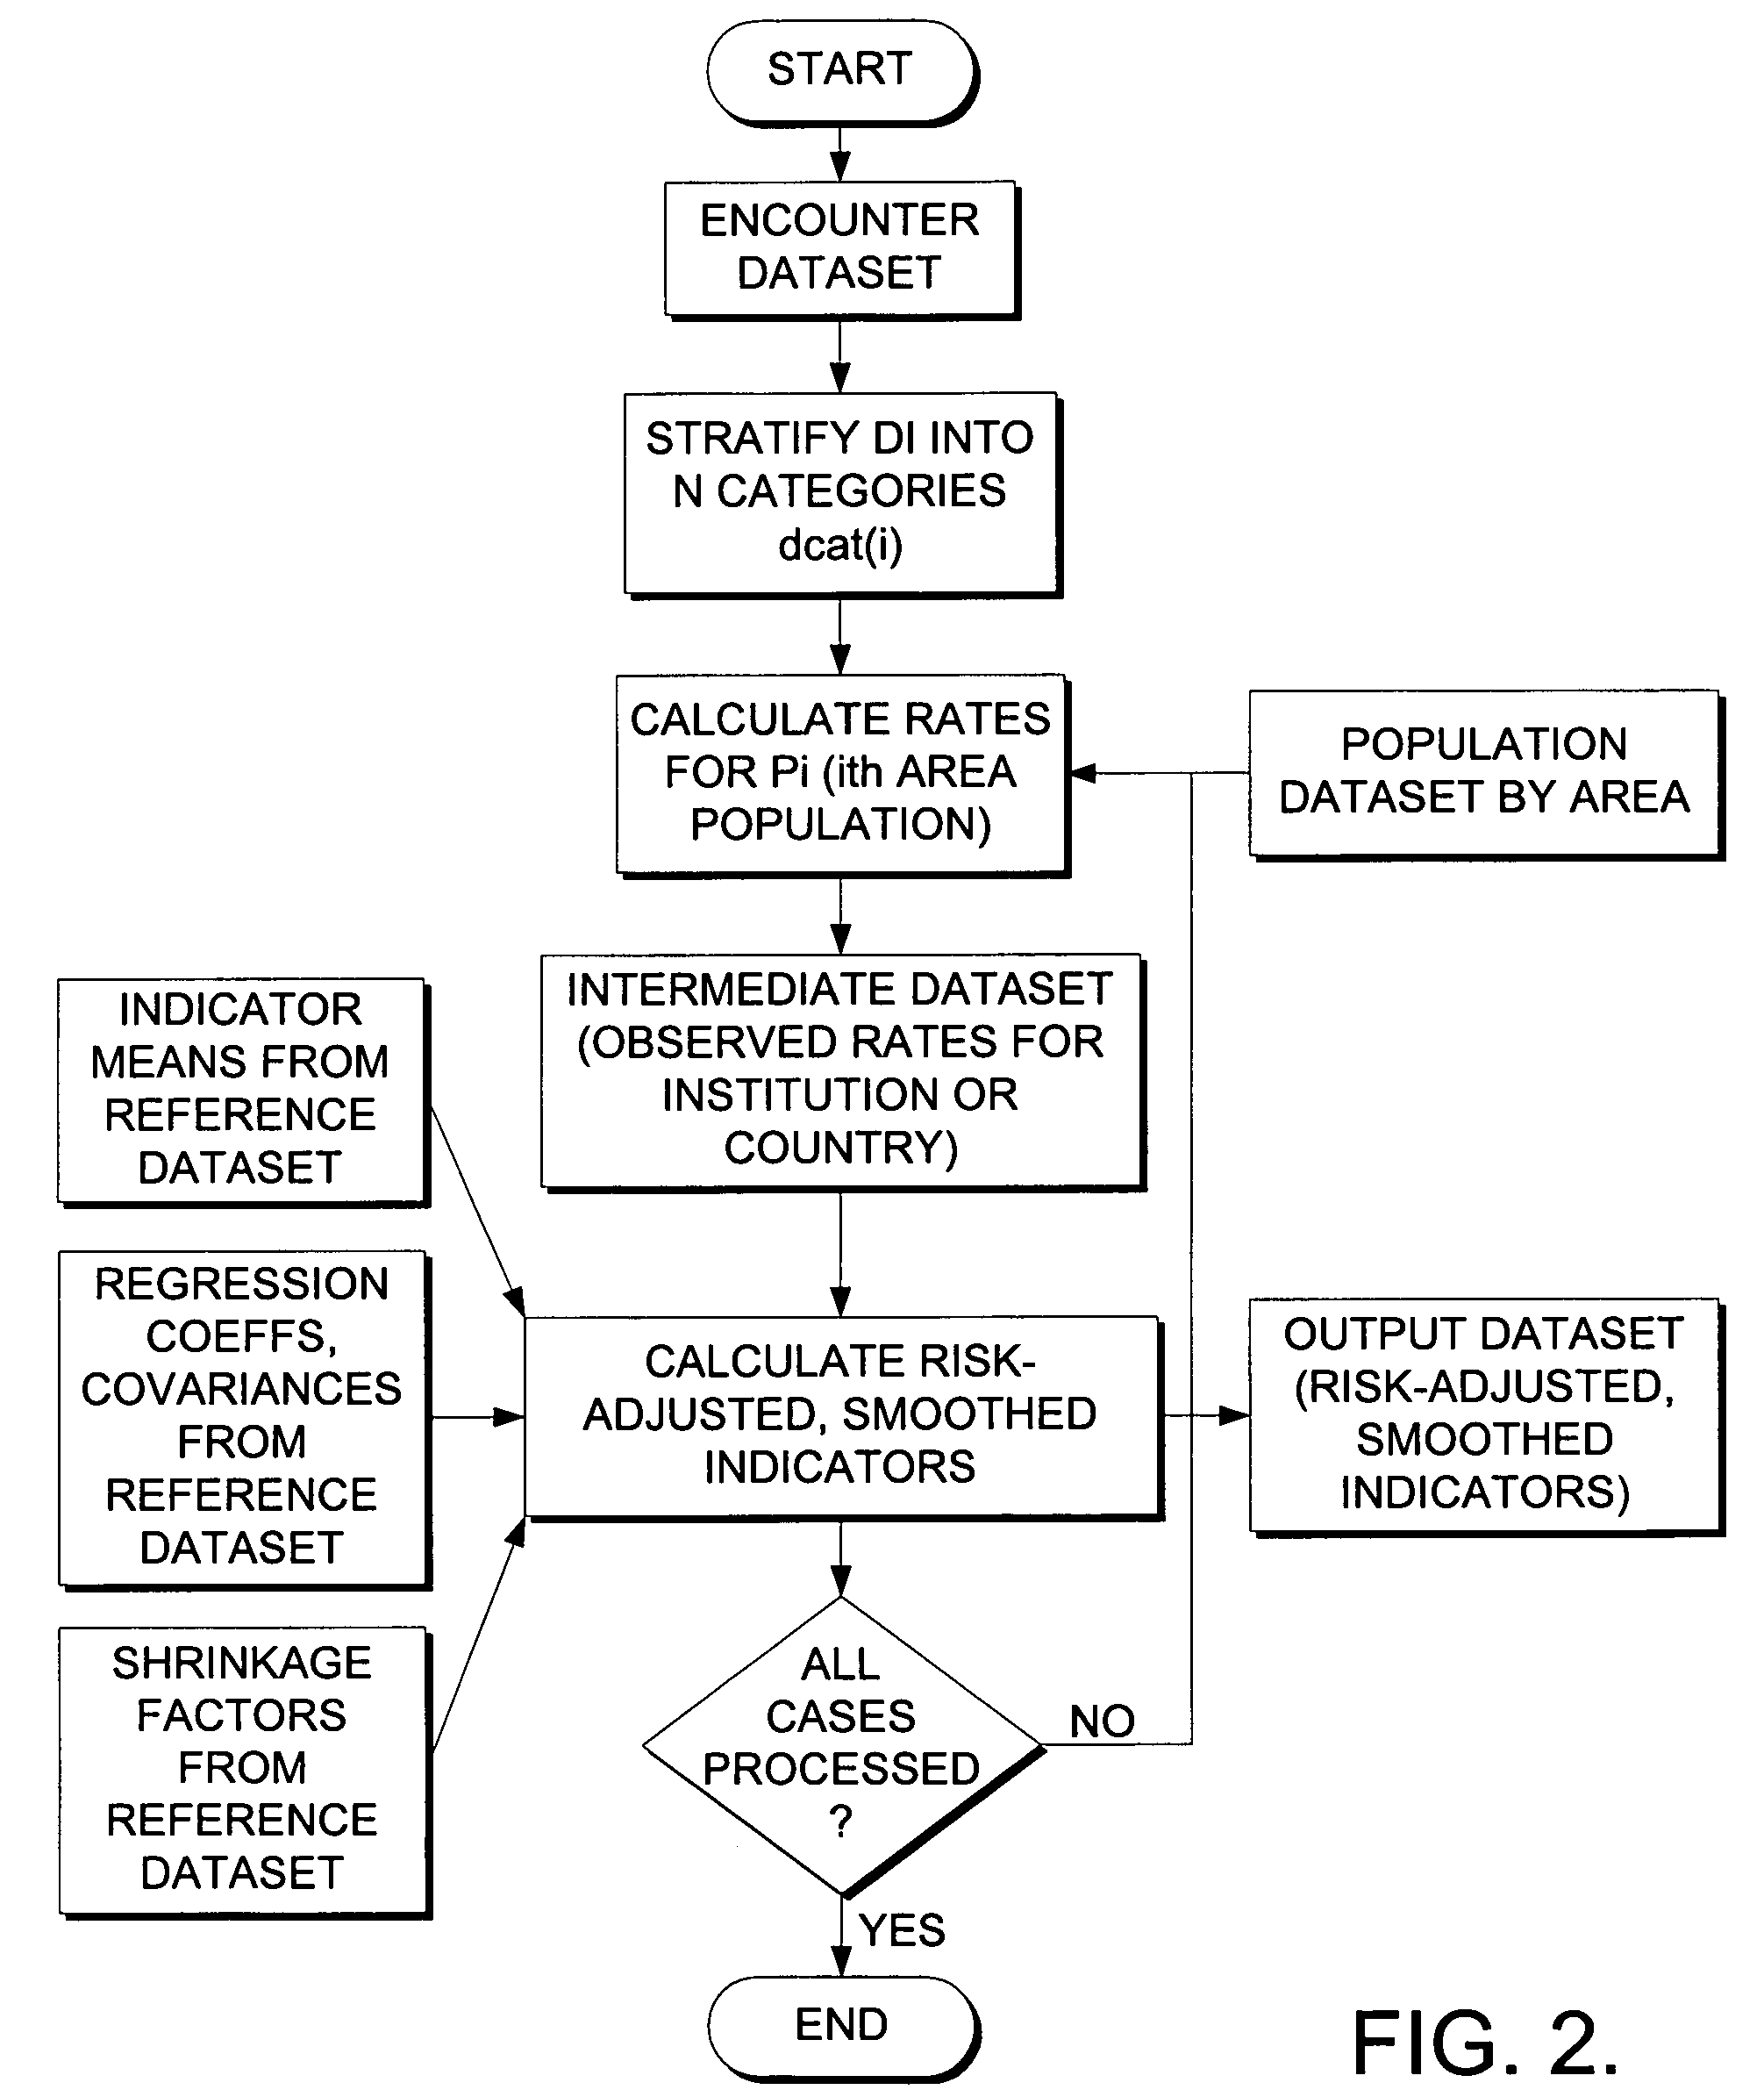
[0084]Referring now to FIG. 2, a diagram is shown of the elements comprising the method and system for applying the locally normed distance index, stratified into a finite number of categories, to risk-adjust the incidence rates for access-related utilization indicators. The data element HOSPSTCO provides flexibility to calculate the indicators by hospital location or by patient residence. If the user wants to calculate the indicators using the population associated with the hospital location as the denominator, the values for this variable should be the individual hospital FIPS ...


PUM


Abstract

A method and system suitable for automated adjustment of information represented in the transaction order records from clinical information systems of hospitals, clinics, and emergency rooms, in such a manner as to accurately reflect differences in access to care. Techniques from statistical processing are combined in a method that allows for optimization of the parameters such that statistical hypothesis testing using conventional parametric tests are valid and feasible, on account of close approximation to Gaussian normal distribution. The method and system is designed so as to be robust against wide variations in population density and transportation infrastructure, as reflects remote, rural, suburban, and metropolitan environments. Once optimized, the method and system can achieve reliable performance with regard to longitudinal measurement of health access indicators, which are used in planning and managing health services. The performance of this method and system is superior to predicate methods known to those skilled in the art.

Description

CROSS-REFERENCE TO RELATED APPLICATIONS[0001]The application claims the benefit of U.S. Provisional Application No. 60 / 446,692, filed Feb. 11, 2003.STATEMENT REGARDING FEDERALLY SPONSORED RESEARCH OR DEVELOPMENT[0002]Not applicable.TECHNICAL FIELD[0003]The present invention relates to a system and method for risk-adjusting indicators of access and utilization of health care services based on metrics of distance, which may be either in terms of geographic distance or timeBACKGROUND OF THE INVENTION[0004]Prevention is an important role for all health care providers. Providers can help individuals stay healthy by preventing disease, and they can prevent complications of existing disease by helping patients live with their illnesses. To fulfill this role, however, providers need data on the impact of their services and the opportunity to compare these data over time or across communities. Local, State, and Federal policymakers also need these tools and data to identify potential access ...

Claims


Application Information

Patent Timeline
Patent Type & Authority Patents(United States)
IPC IPC(8): G06F19/00G06Q10/00G16H10/60G16H40/20G16H40/67
CPCG06F19/327G06Q50/24G06Q50/22G16H40/20G16H40/67
Inventor MCNAIR, DOUGLAS S.
Owner CERNER INNOVATION
Why Eureka
Try Eureka