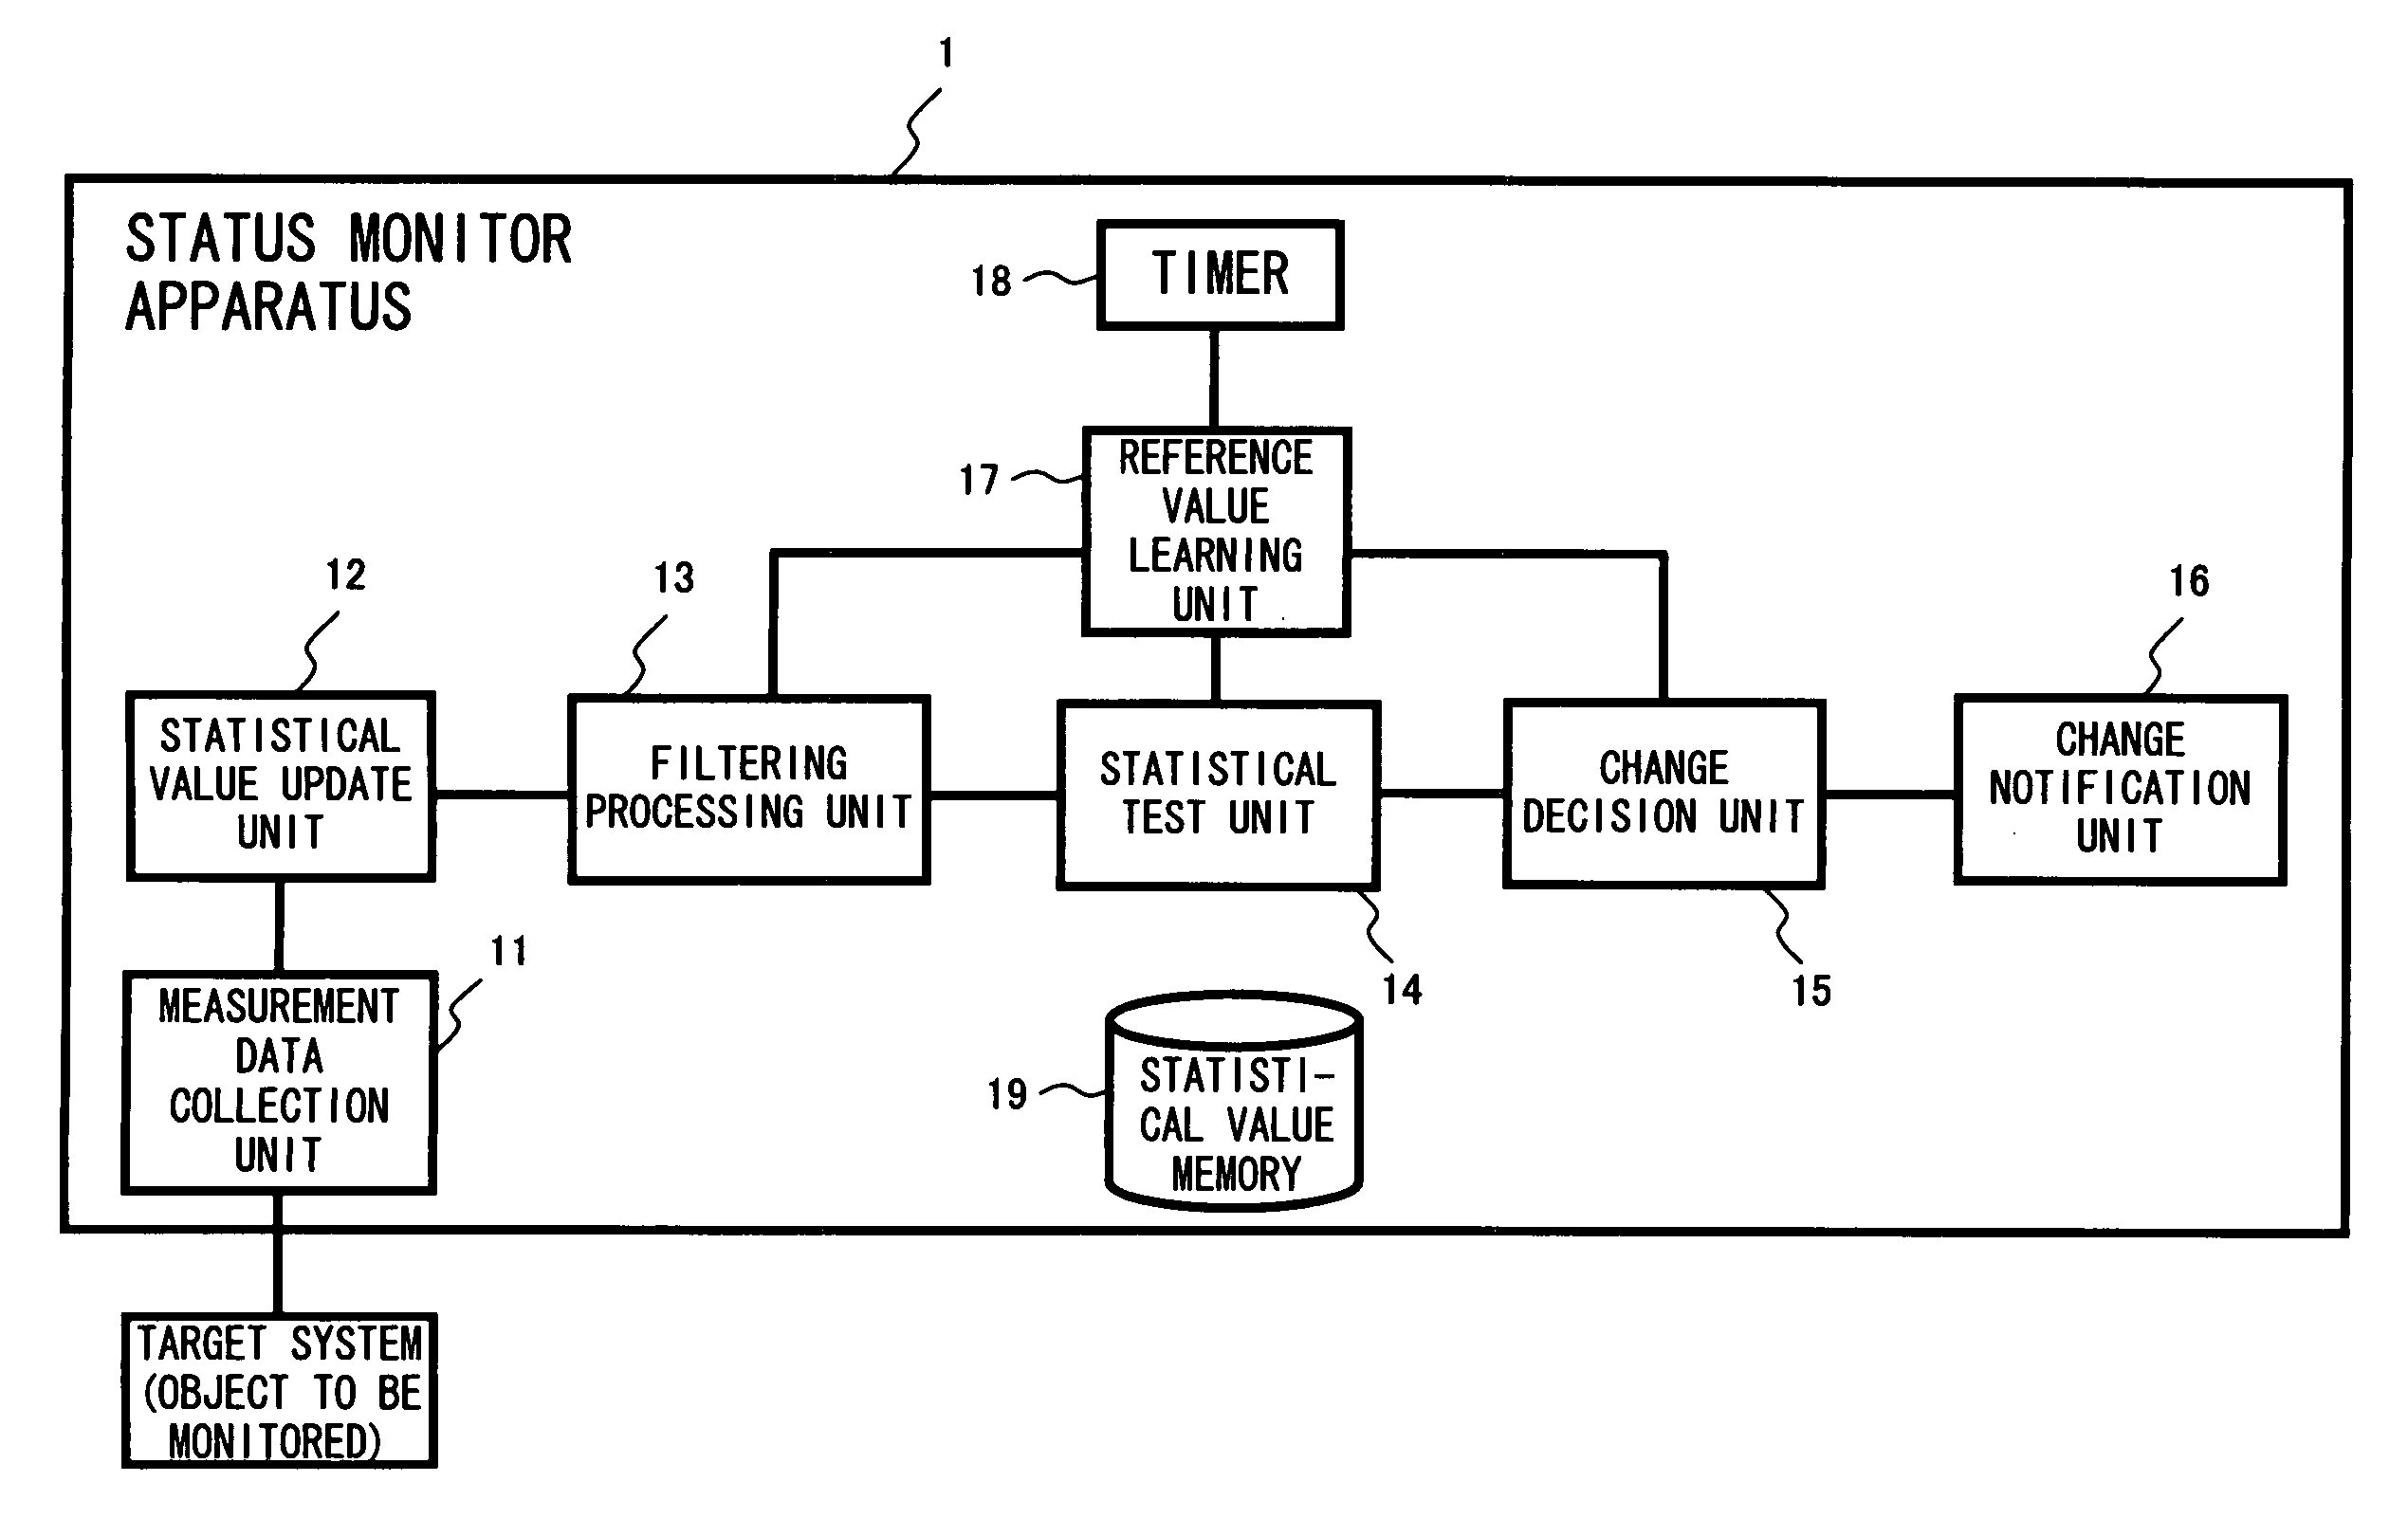
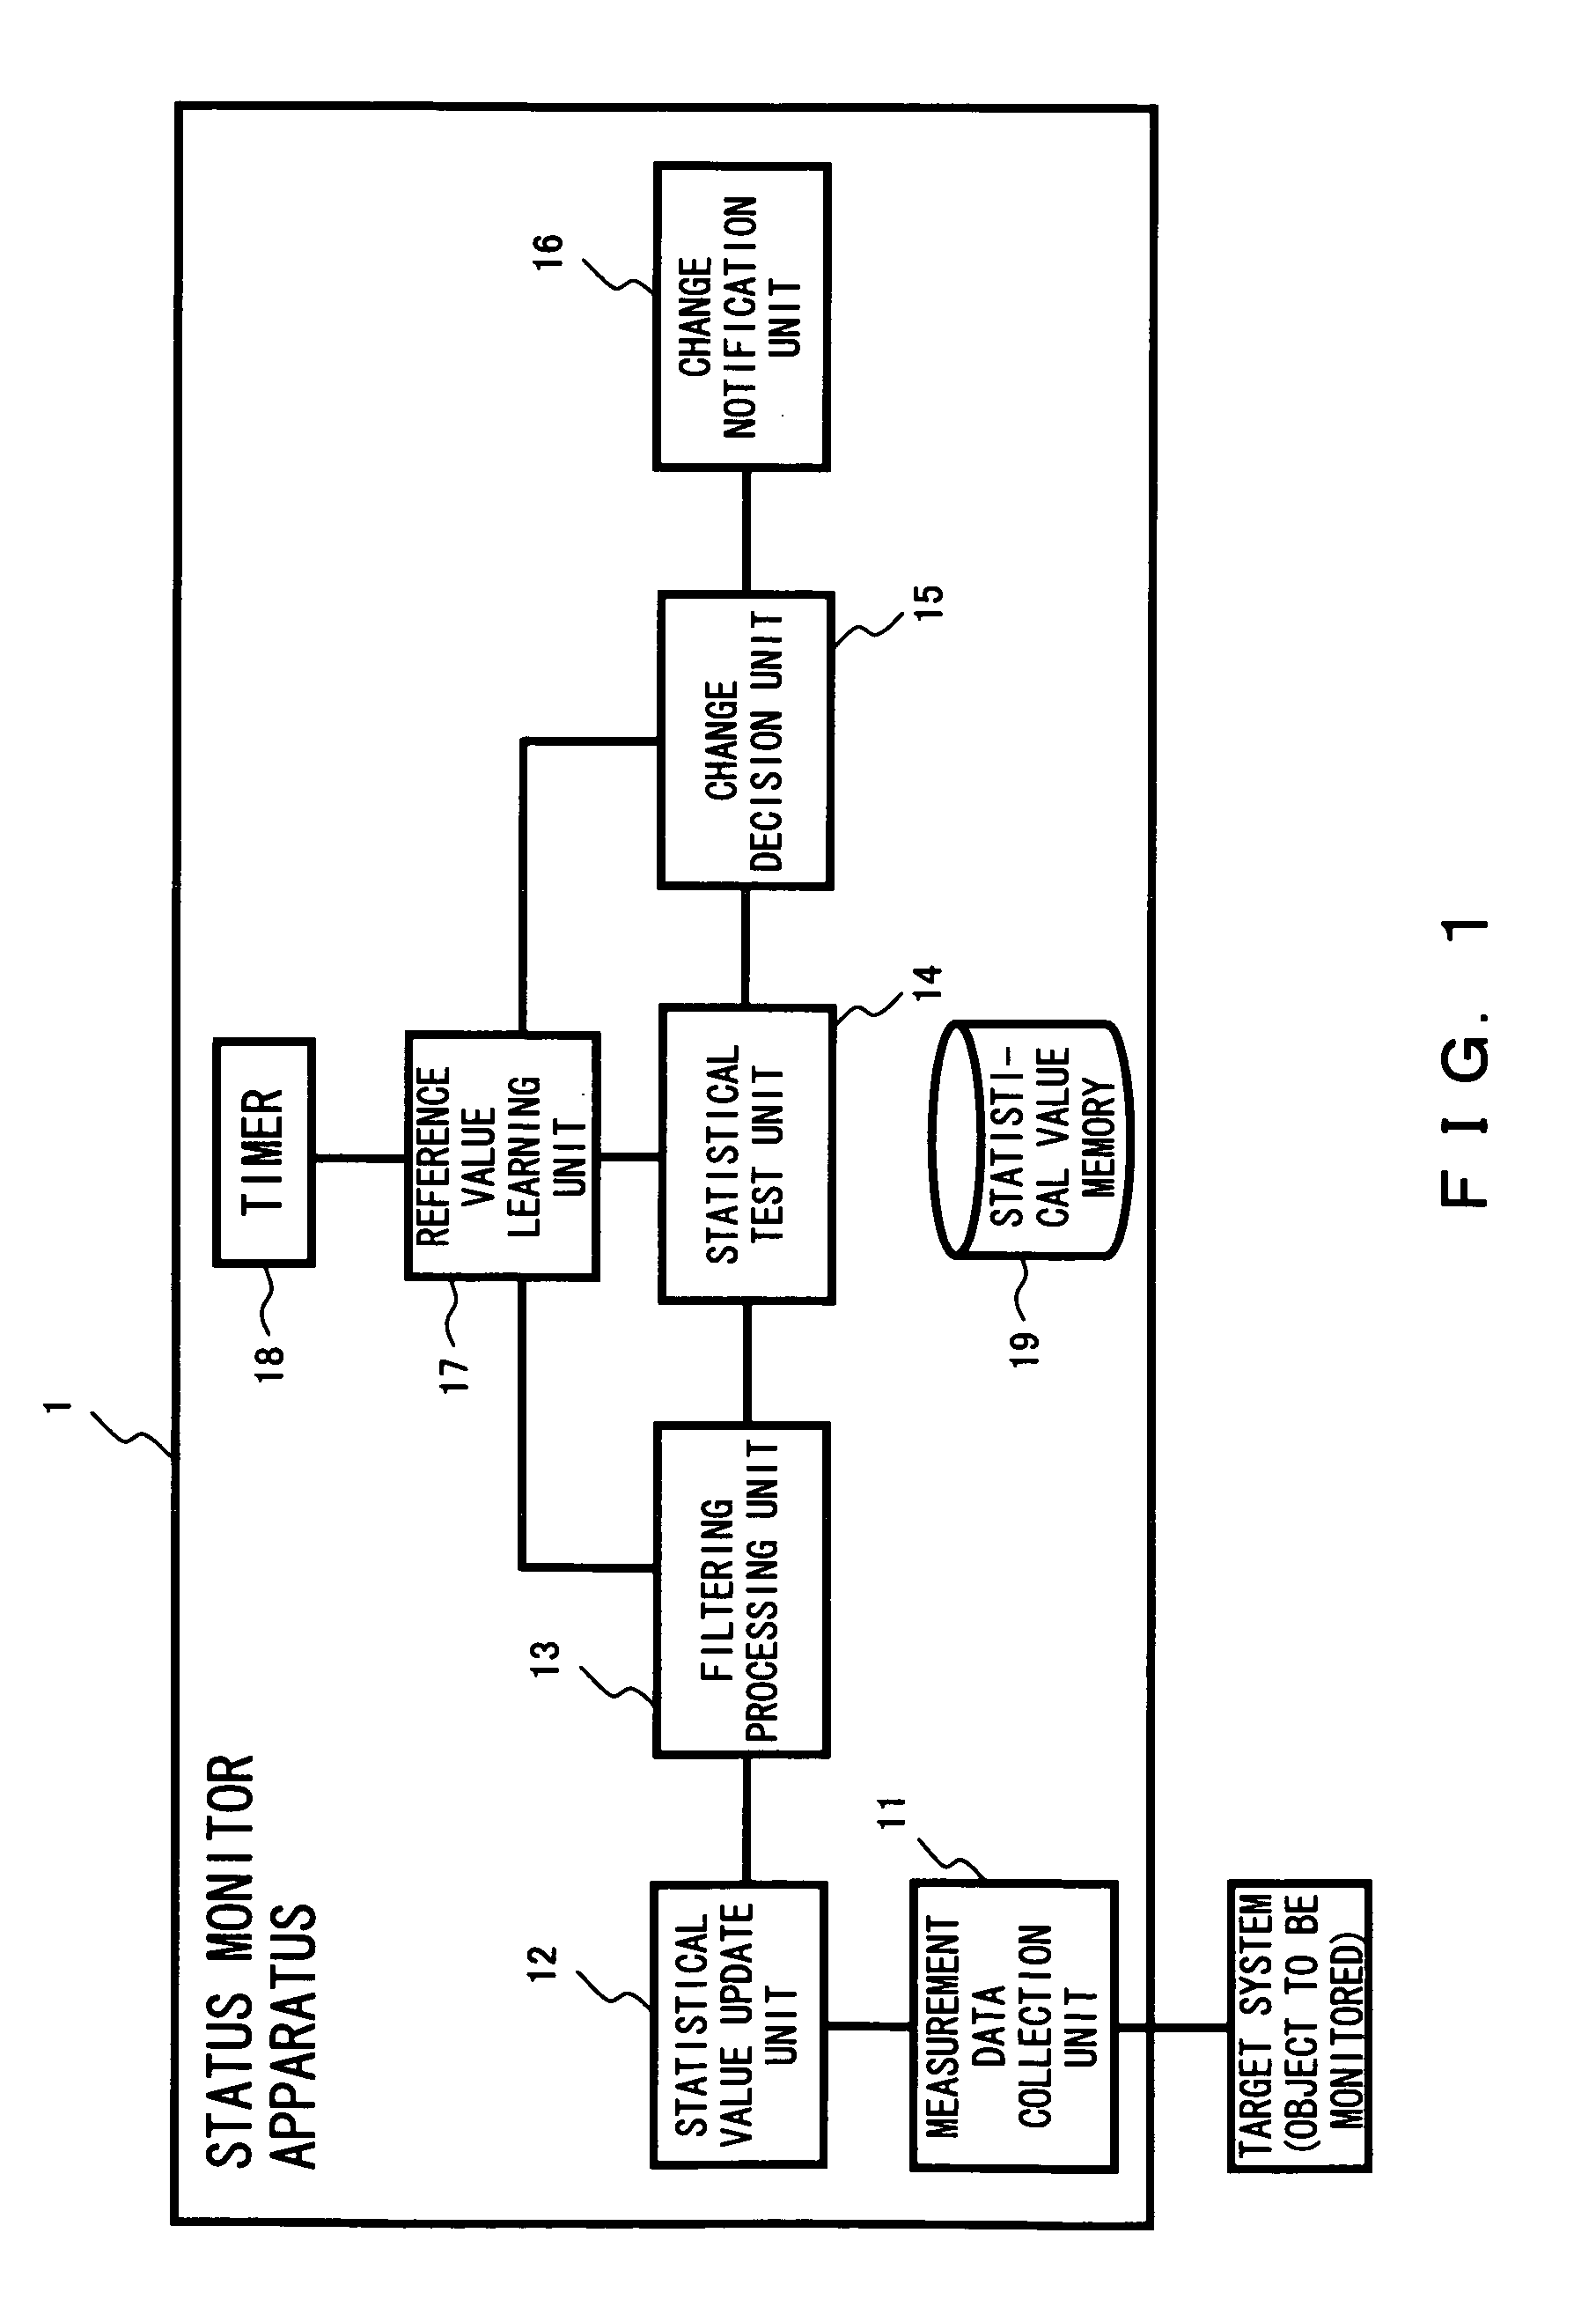
Status monitor apparatus
a technology of statist monitor and monitor, which is applied in the direction of amplitude demodulation, transmission monitoring, dc level restoring means or bias distortion correction, etc., can solve the problems of difficult to monitor a large-scale system in real time, difficult to apply statistical methods to time-series data without modification, and difficult to determine in advance an appropriate threshold. , to achieve the effect of reducing hardware resources and speeding up the process
- Summary
- Abstract
- Description
- Claims
- Application Information
AI Technical Summary
Benefits of technology
Problems solved by technology
Method used
Image
Examples
embodiment 1
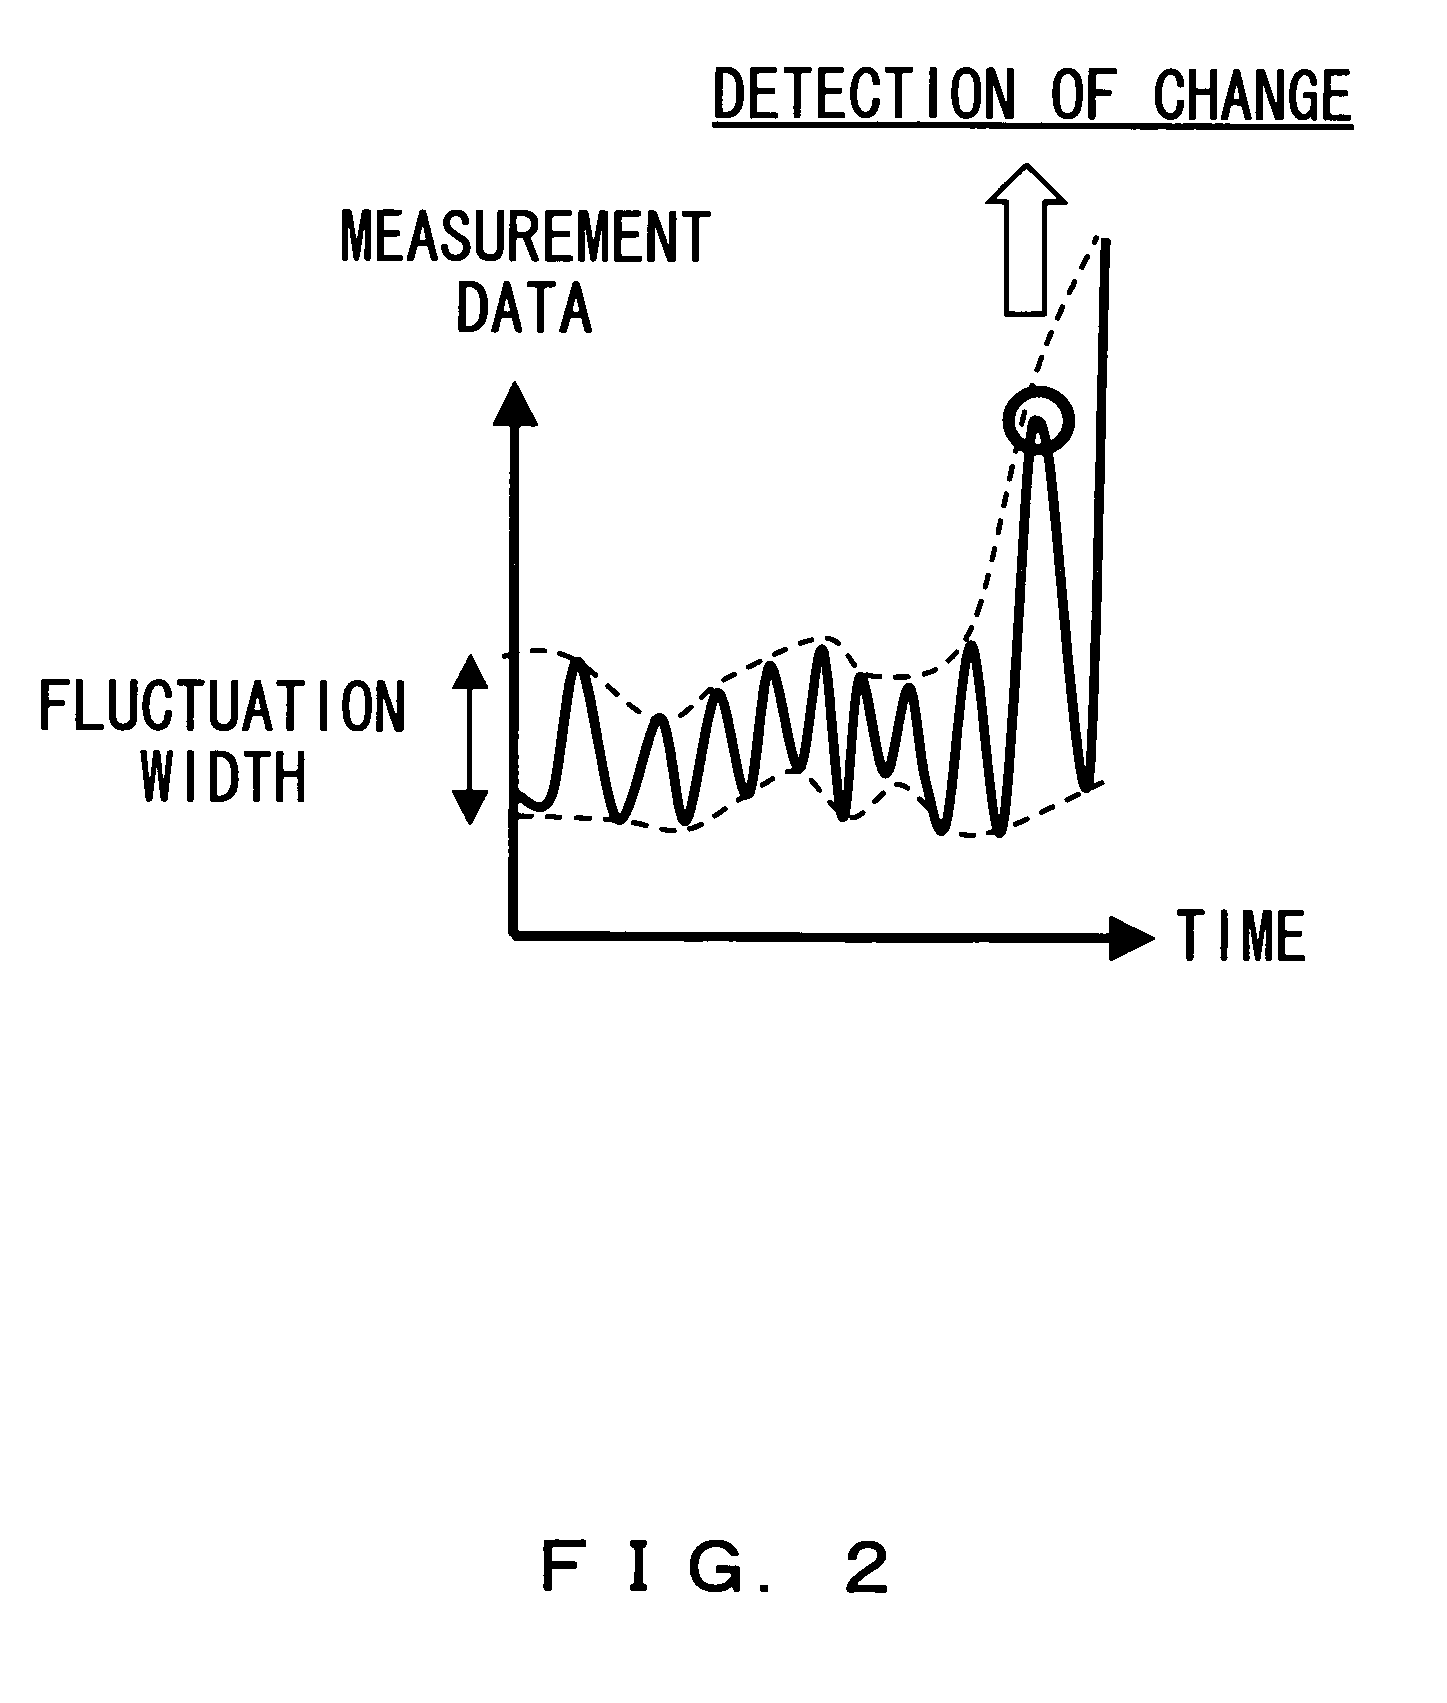
[0105]FIG. 8 shows the relationship between the time-series data and its fluctuation. In this example, a moving average (EWMA) is used in calculating the fluctuation of data.
[0106]There occurs a delay in trailing the mean value calculated using the EWMA when the data is changed suddenly. Therefore, when the data is changed suddenly, the fluctuation of the data becomes large. Therefore, according to the status monitor apparatus 1 in the embodiment, a sudden change in data can be detected.
[0107]FIG. 9 shows a result of a simulation when time-series data is given. As shown in FIG. 9, according to the status monitor apparatus 1 of the embodiment, a change in time-series data can be detected when the data suddenly changes, even if the amplitude of the data is small.
embodiment 2
[0108]FIG. 10 is an explanatory view of the configuration and the operation of the network monitor system. The status monitor apparatus 1 according to the embodiment is provided for each of the network monitor devices A and B.
[0109]The network monitor devices A and B transmit a probing packet between them, and measure an end-to-end delay. Then, each monitor device monitors the status of a network based on the behavior of observed delayed data. In the monitoring method, it is not necessary to set in advance a threshold (for example, a delay time) relating to the operation of the network, but an abnormal condition of the network can be detected by automatically detecting a “change” in the status of the network from the observed time-series data. It is not easy to determine in advance an appropriate threshold for monitor of the status of a network, and it is necessary to set again the threshold when the configuration of a system is changed.
[0110]FIGS. 11A and 11B show the relationship ...
embodiment 3
[0116]FIG. 15 shows the procedure of the status monitor apparatus 1. In this example, a delay time in the communication network is given as time-series data, and the EWMA is used as a mean value. Then, the status monitor apparatus 1 calculates the F value each time the delayed data is obtained, and monitors the stationary change of the status of the network based on the F value. In this embodiment, the significant level α is 5 percent. Therefore, when an event that occurs only at 5 percent statistically occurs at a probability higher than a predetermined rate, it is determined that “the status of a network has stationarily changed.”
[0117]The maximum value σ2max of variance is updated when the newly calculated variance σ2[n] is larger than the σ2max[n−1] held at the time. In this example, at time 2, 3, and 122, the newly calculated variance is set as a new maximum value. If the variance σ2[n] is equal to or smaller than the σ2max[n−1], it is updated according to the forgetting factor...
PUM
 Abstract
Description
Claims
Application Information
 - R&D
- Intellectual Property
- Life Sciences
- Materials
- Tech Scout
- Unparalleled Data Quality
- Higher Quality Content
- 60% Fewer Hallucinations
Browse by: Latest US Patents, China's latest patents, Technical Efficacy Thesaurus, Application Domain, Technology Topic, Popular Technical Reports.
© 2025 PatSnap. All rights reserved.Legal|Privacy policy|Modern Slavery Act Transparency Statement|Sitemap|About US| Contact US: help@patsnap.com


