
Method for automatically detecting factors that disturb analysis by a photometer

a technology of automatic detection and factor detection, applied in the field of clinical chemistry analyzers, can solve the problems of affecting affecting the quality of the analysis, so as to achieve easy and reliable detection, increase the overall reliability of the analysis process, and cost-effective

Active Publication Date: 2010-02-16
THERMO FISCHER SCI OY
View PDF4 Cites 28 Cited by
  • Summary
  • Abstract
  • Description
  • Claims
  • Application Information

AI Technical Summary

Benefits of technology

This method provides reliable and accurate detection of interfering substances, enhancing analysis reliability without reducing analyzer capacity or speed, and is cost-effective by not requiring additional spectrometers or personnel.

Problems solved by technology

These changes, for example hemolysis, alter the composition of the sample and compounds that may disturb the analysis of the sample may be generated.
If these components are present in a concentration that is higher than normally, the analysis of the sample may be seriously disturbed and the analysis results distorted.
Of course, an accurate estimate of the concentration cannot be achieved by visual control.
If several, disturbing components are present simultaneously, the valuation of the sample is even more complicated.
Therefore no visual control of the samples is used and faulty samples may enter the analyzer and cause wrong results.
Additionally, medication that color the serum or plasma as well as biliverdine may cause difficulties in measurement.
The spectrums of different components do overlap, whereby it is possible by this method to detect that something is wrong with the sample, but it is not possible to detect what are the components causing the problem or what are the concentrations of different components.
If the concentration of every component is to be measured, the situation is more difficult.
Especially the interference of bilirubin and hemoglobin is difficult to control.
Further weaknesses of this method is that it consumes some of the sample (5-10 μl) and adds measuring steps for each sample thereby reducing the analyzing speed and capacity of the analyzer.
This raises the costs and the complexity of the apparatus considerably.

Method used


Image

  • Method for automatically detecting factors that disturb analysis by a photometer
  • Method for automatically detecting factors that disturb analysis by a photometer
  • Method for automatically detecting factors that disturb analysis by a photometer

Examples


Embodiment Construction

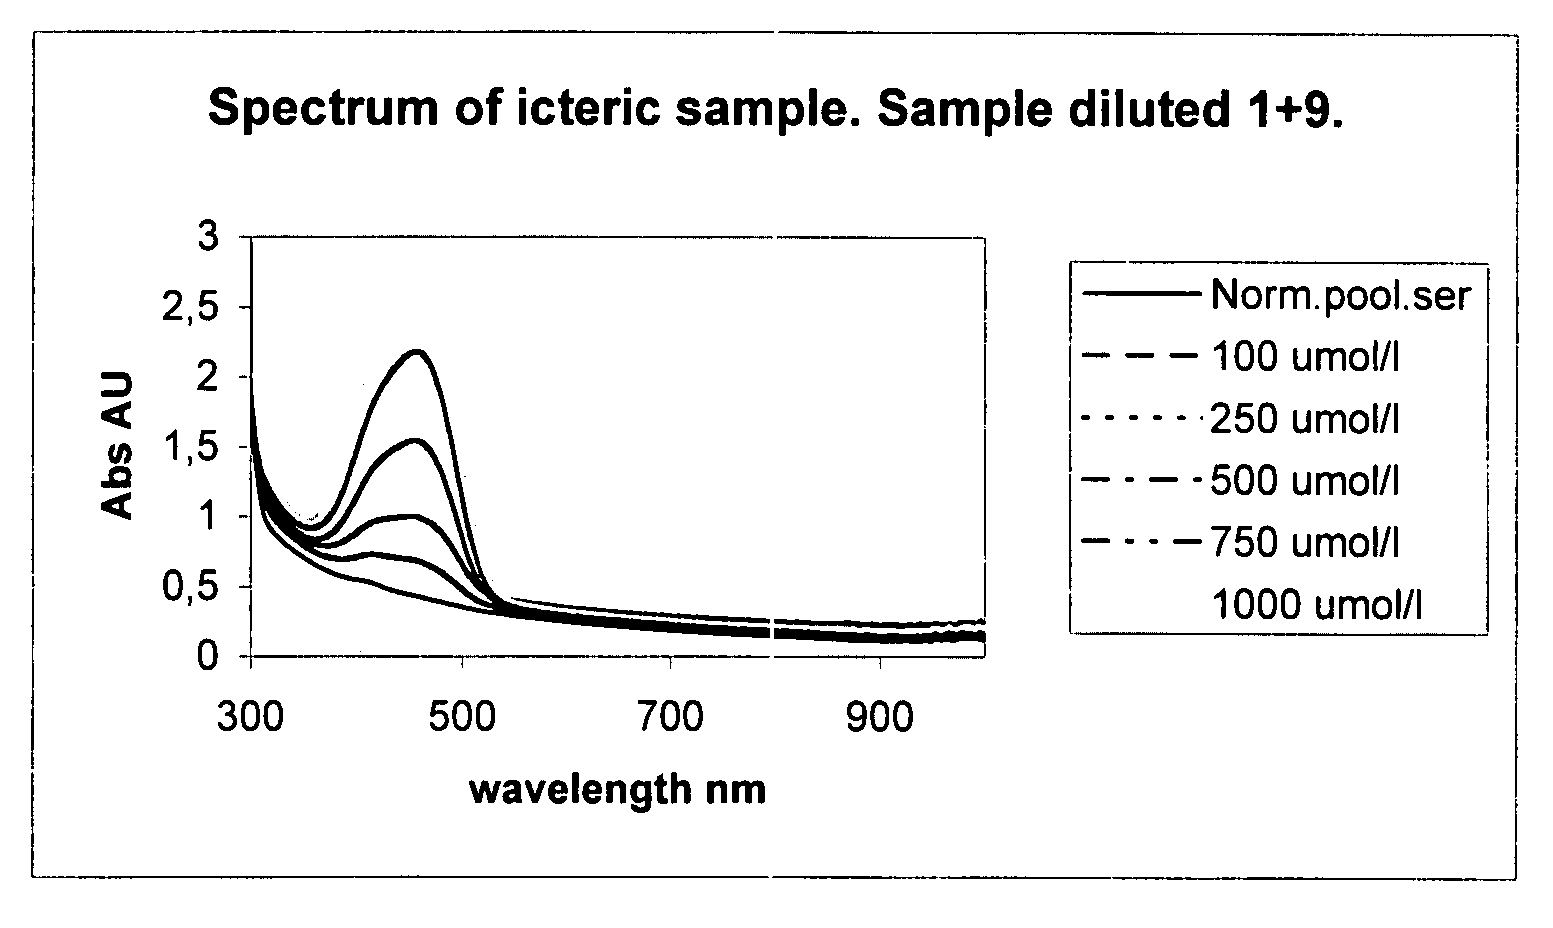
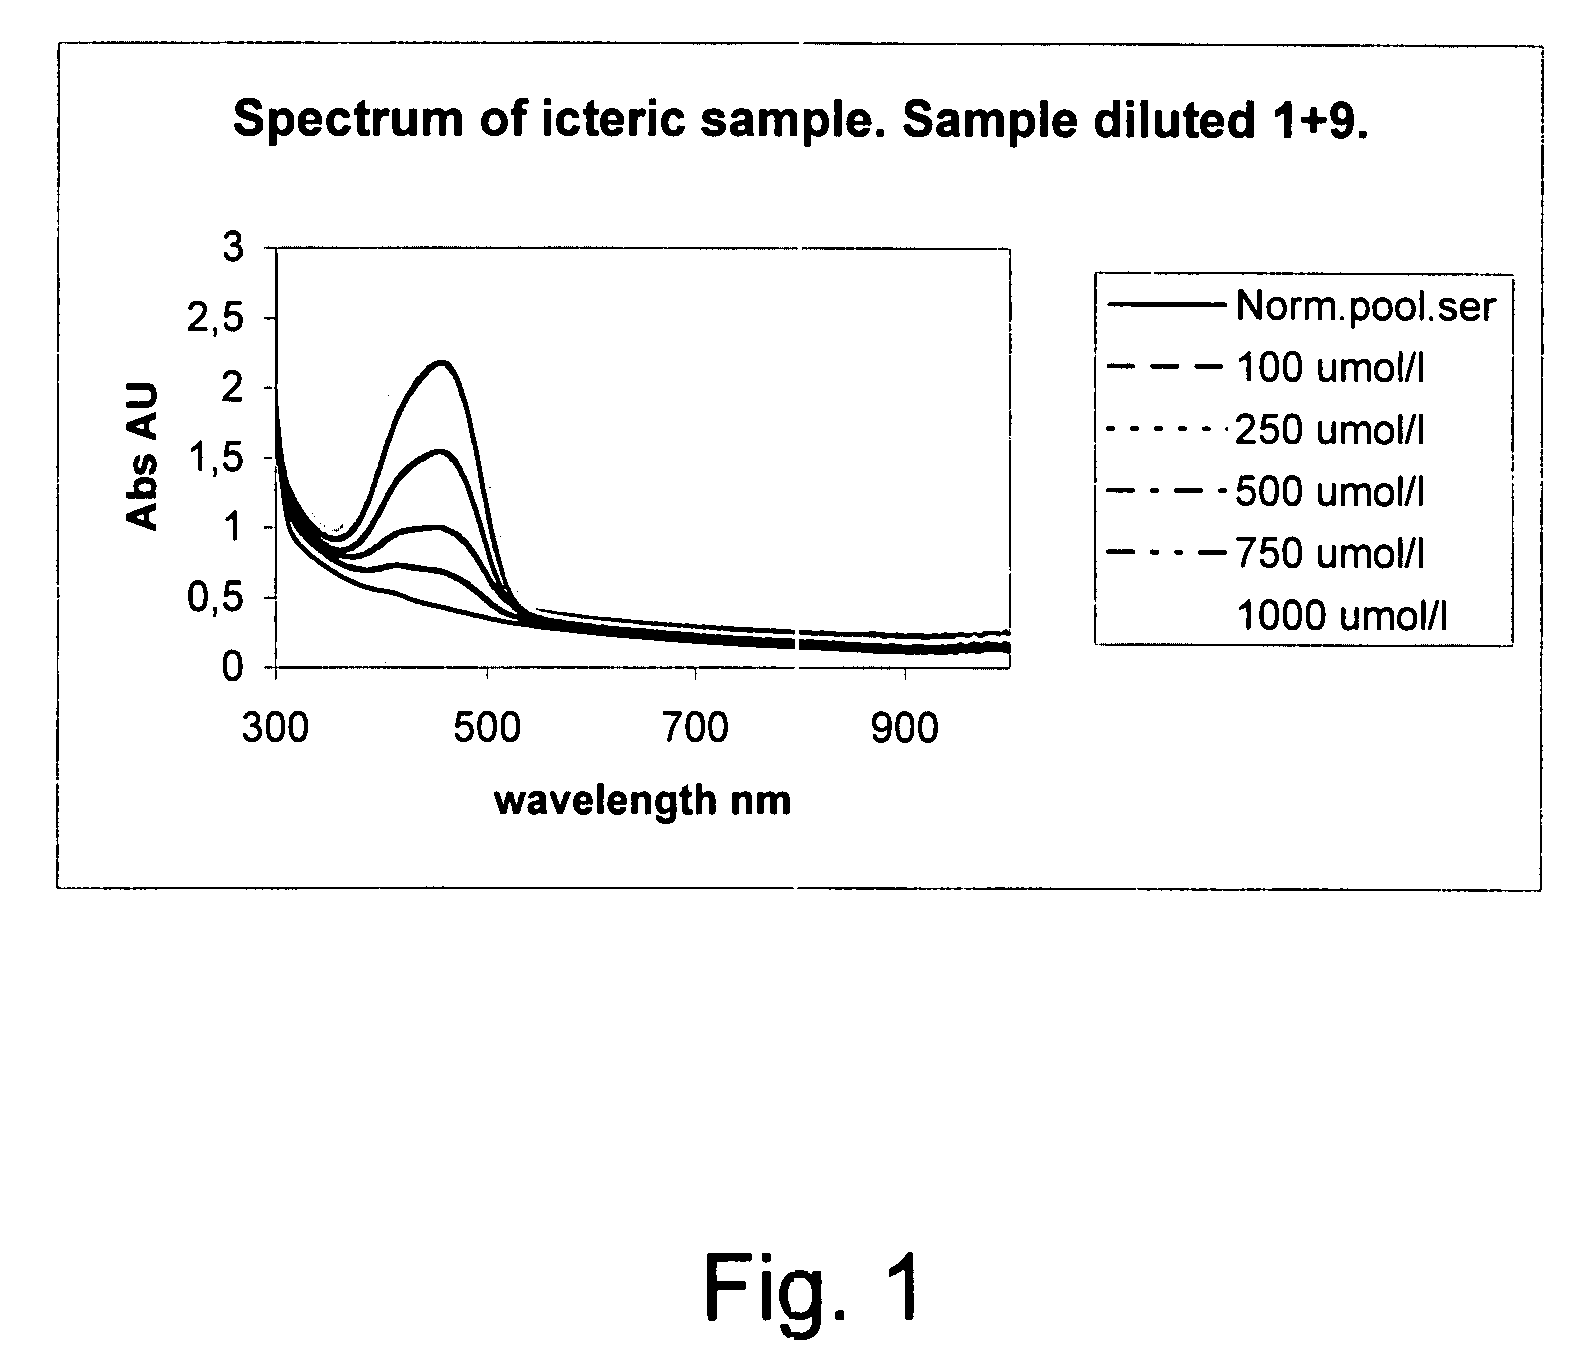
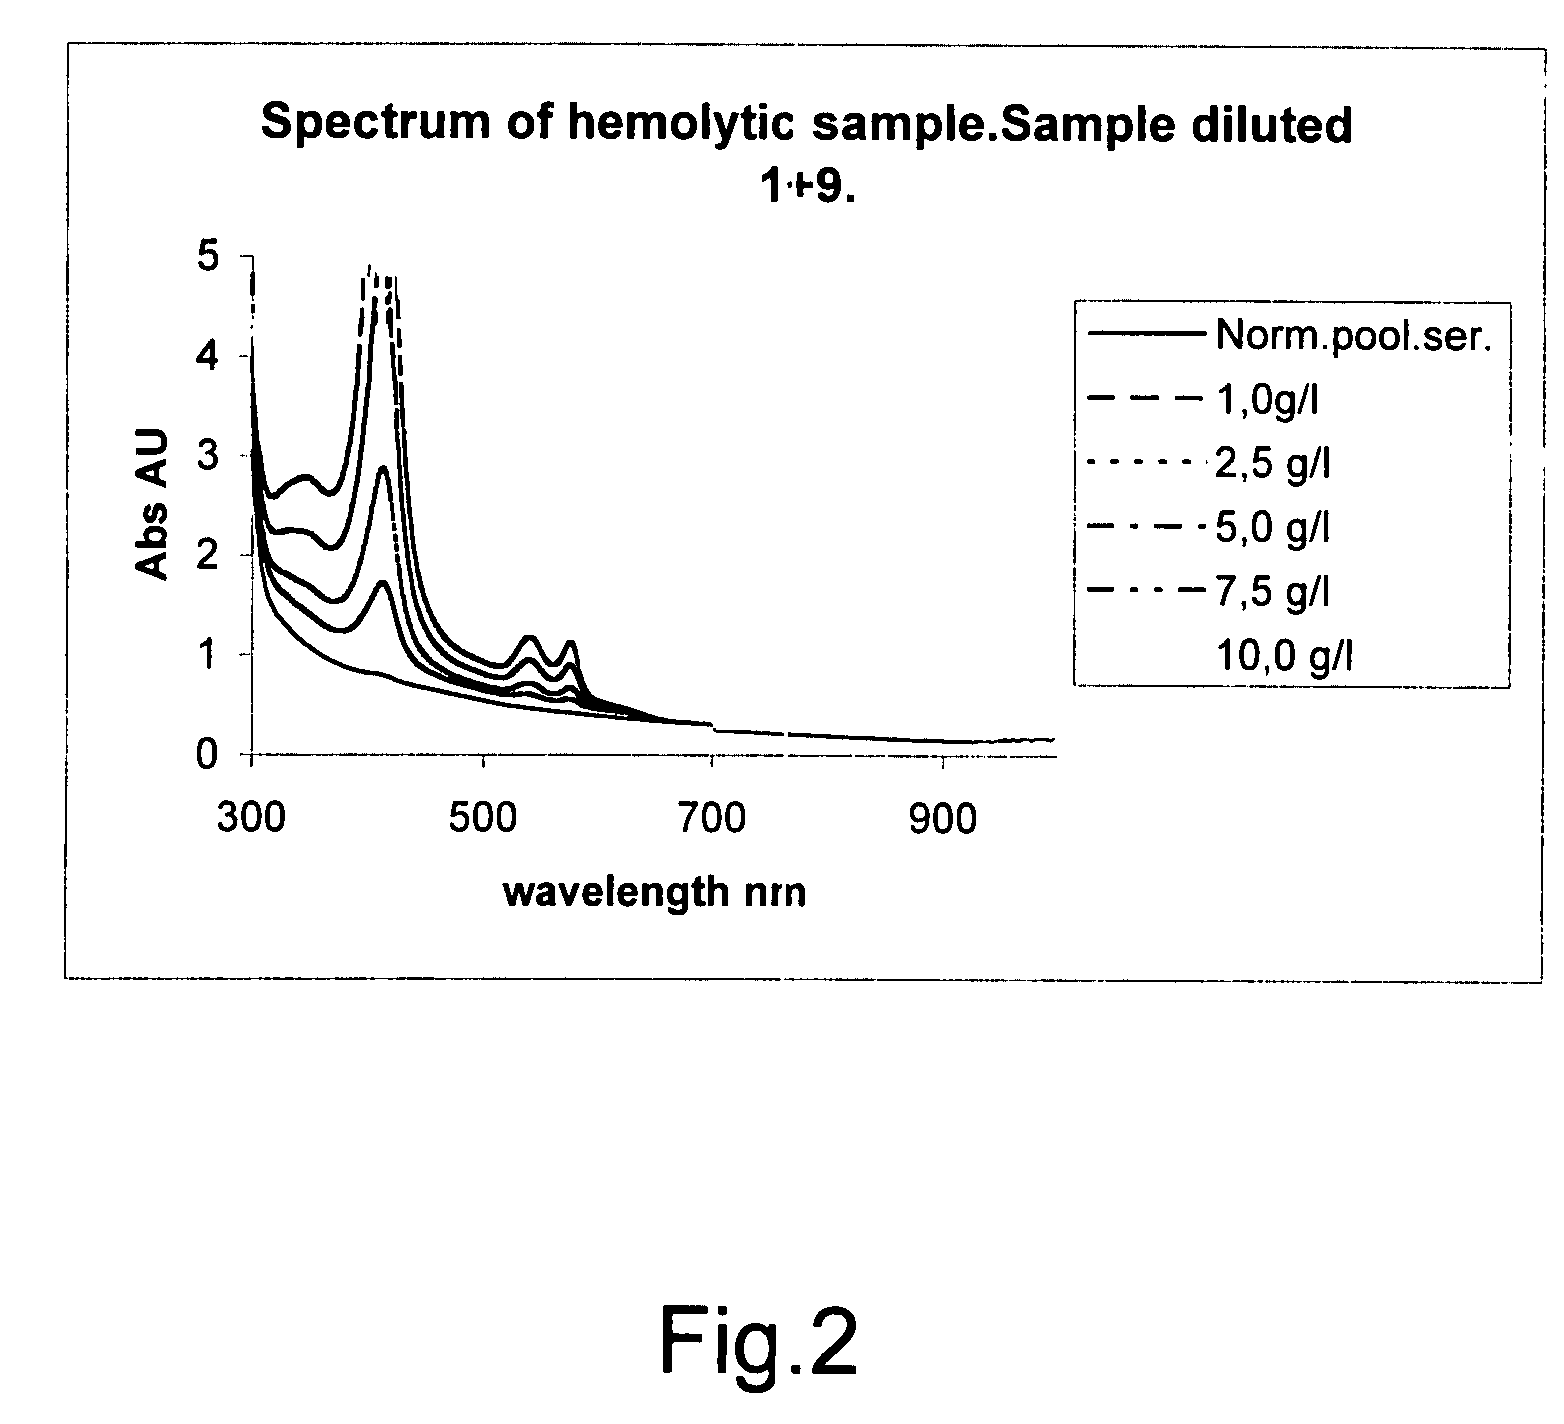
[0026]The idea of the invention is to use several different wavelengths of light for measuring the absorbance (or reflectance, when applicable) of a sample in order to sort out the concentrations of at least two, preferably three substances that disturb the analysis of a sample. The invention is intended to be used in an analyzer that examines the samples by directing a beam of light on a sample. The absorbance of the sample is then measured either directly or indirectly through reflectance. Normally the analyzer is capable of measuring at different wavelengths for different type of analyses. According to the invention the absorbance of a sample is preferably measured on a wavelength on which a peak in absorbance exist for a specific substance. Additionally, the absorbance is measured on a wavelength that differs from the initial wavelength. The second measurement is performed preferably on a wavelength that is in the vicinity of the root of the peak in question. For three substance...


PUM

PropertyMeasurementUnit
wavelengthsaaaaaaaaaa

Abstract

The invention concerns a method for detecting the amounts of substances that may disturb chemical analysis performed by an analyzer for clinical chemistry. The presence and concentration of hemoglobin, bilirubin and lipemia are detected by measuring the absorbance or reflectance on at least two, preferably six, different wavelengths over the measured spectrum. The measurements are performed at two wavelengths for each substance, preferably on the absorbance peaks of the specific substance and on the root of the specific peaks. Since the three substances mentioned above each have at least one peak in the spectrum, the measurement is done on three peaks and three root positions respectively when three substances have to be measured.

Description

[0001]The present invention relates to a method for detecting the amounts of substances that may disturb chemical analysis performed by an analyzer for clinical chemistry.BACKGROUND OF THE INVENTION[0002]Samples of analyzers for clinical chemistry are usually serum or plasma that is separated from a blood sample by centrifugation. Some changes may occur in the sample during sampling, centrifugation and processing of the sample. These changes, for example hemolysis, alter the composition of the sample and compounds that may disturb the analysis of the sample may be generated. The serum or plasma sample may also contain higher than normal amounts of substances that disturb the measurement. Higher concentration of hemoglobin, bilirubine or lipemia may be caused by the medical condition of the patient. These components have strong colors or they are highly turbide. If these components are present in a concentration that is higher than normally, the analysis of the sample may be seriousl...

Claims


Application Information

Patent Timeline
Patent Type & Authority Patents(United States)
IPC IPC(8): G01N33/48
CPCG01N21/314G01N33/72G01N2333/805
Inventor JOHANSSON, HENRIK
Owner THERMO FISCHER SCI OY
Learn More