Systems and methods for displaying changes in biological responses to therapy

a biological response and system technology, applied in the field of systems and methods for displaying changes in biological responses to therapy, to achieve the effect of increasing treatment efficacy and safety, rapid recognition, and improving viewability of spot values

Inactive Publication Date: 2010-05-18
PHOTOMED TECH
View PDF7 Cites 218 Cited by
  • Summary
  • Abstract
  • Description
  • Claims
  • Application Information

AI Technical Summary

Benefits of technology

[0013]A display frame can be processed further to optimize it to the capabilities of the display device, for example, by auto-scaling color, intensity, size or other visually discriminating feature to better convey information to the viewer. Before combining new and old display information, one embodiment enhances the viewability of a spot value by auto scaling a range of data to match the display range by intensity, color, or other display parameters. This method can be repeated for subsequent time frames.
[0014]Display variations can be simultaneously displayed or replayed for data collected from numerous devices, such as, in one embodiment, an SEMG, an accelerometer, and a treatment device. Real time monitoring of signals during therapeutic treatment using light, electricity, UV, acupuncture, ultrasound, magnetic field, radiation, deep brain stimulation, or other methods can benefit from systems and methods of this invention because the systems and methods allow monitoring of physiological responses while treatment is occurring in real-time so that a user can recognize a response to treatment while it is occurring. Early recognition of a response to treatment allows the user to evaluate the treatment. For example, one can decide to continue treating, modify the treatment, move to a new location or setting, or to discontinue treatment. Thus, systems and methods of this invention allow the user to rapidly recognize effective treatments and avoid, or recover from, detrimental treatments, thereby increasing treatment efficacy and safety. Simultaneous multiple displays can provide the viewer with the ability to readily recognize relationships amongst signals, which may represent computed interpretations of several signals, such as stimuli and responses to those stimuli. The computed display systems and methods of this invention can be used by practitioners having differing degrees of experience and expertise, thus reducing cost and improving the efficacy of a treatment.

Problems solved by technology

The problem of “what” to display becomes important in processes that are not well connected.
Muscle activity and accelerometer motion are related only when both sensors are placed appropriately and will be poorly-related when placed in other locations.

Method used


Image

  • Systems and methods for displaying changes in biological responses to therapy
  • Systems and methods for displaying changes in biological responses to therapy
  • Systems and methods for displaying changes in biological responses to therapy

Examples


example 1

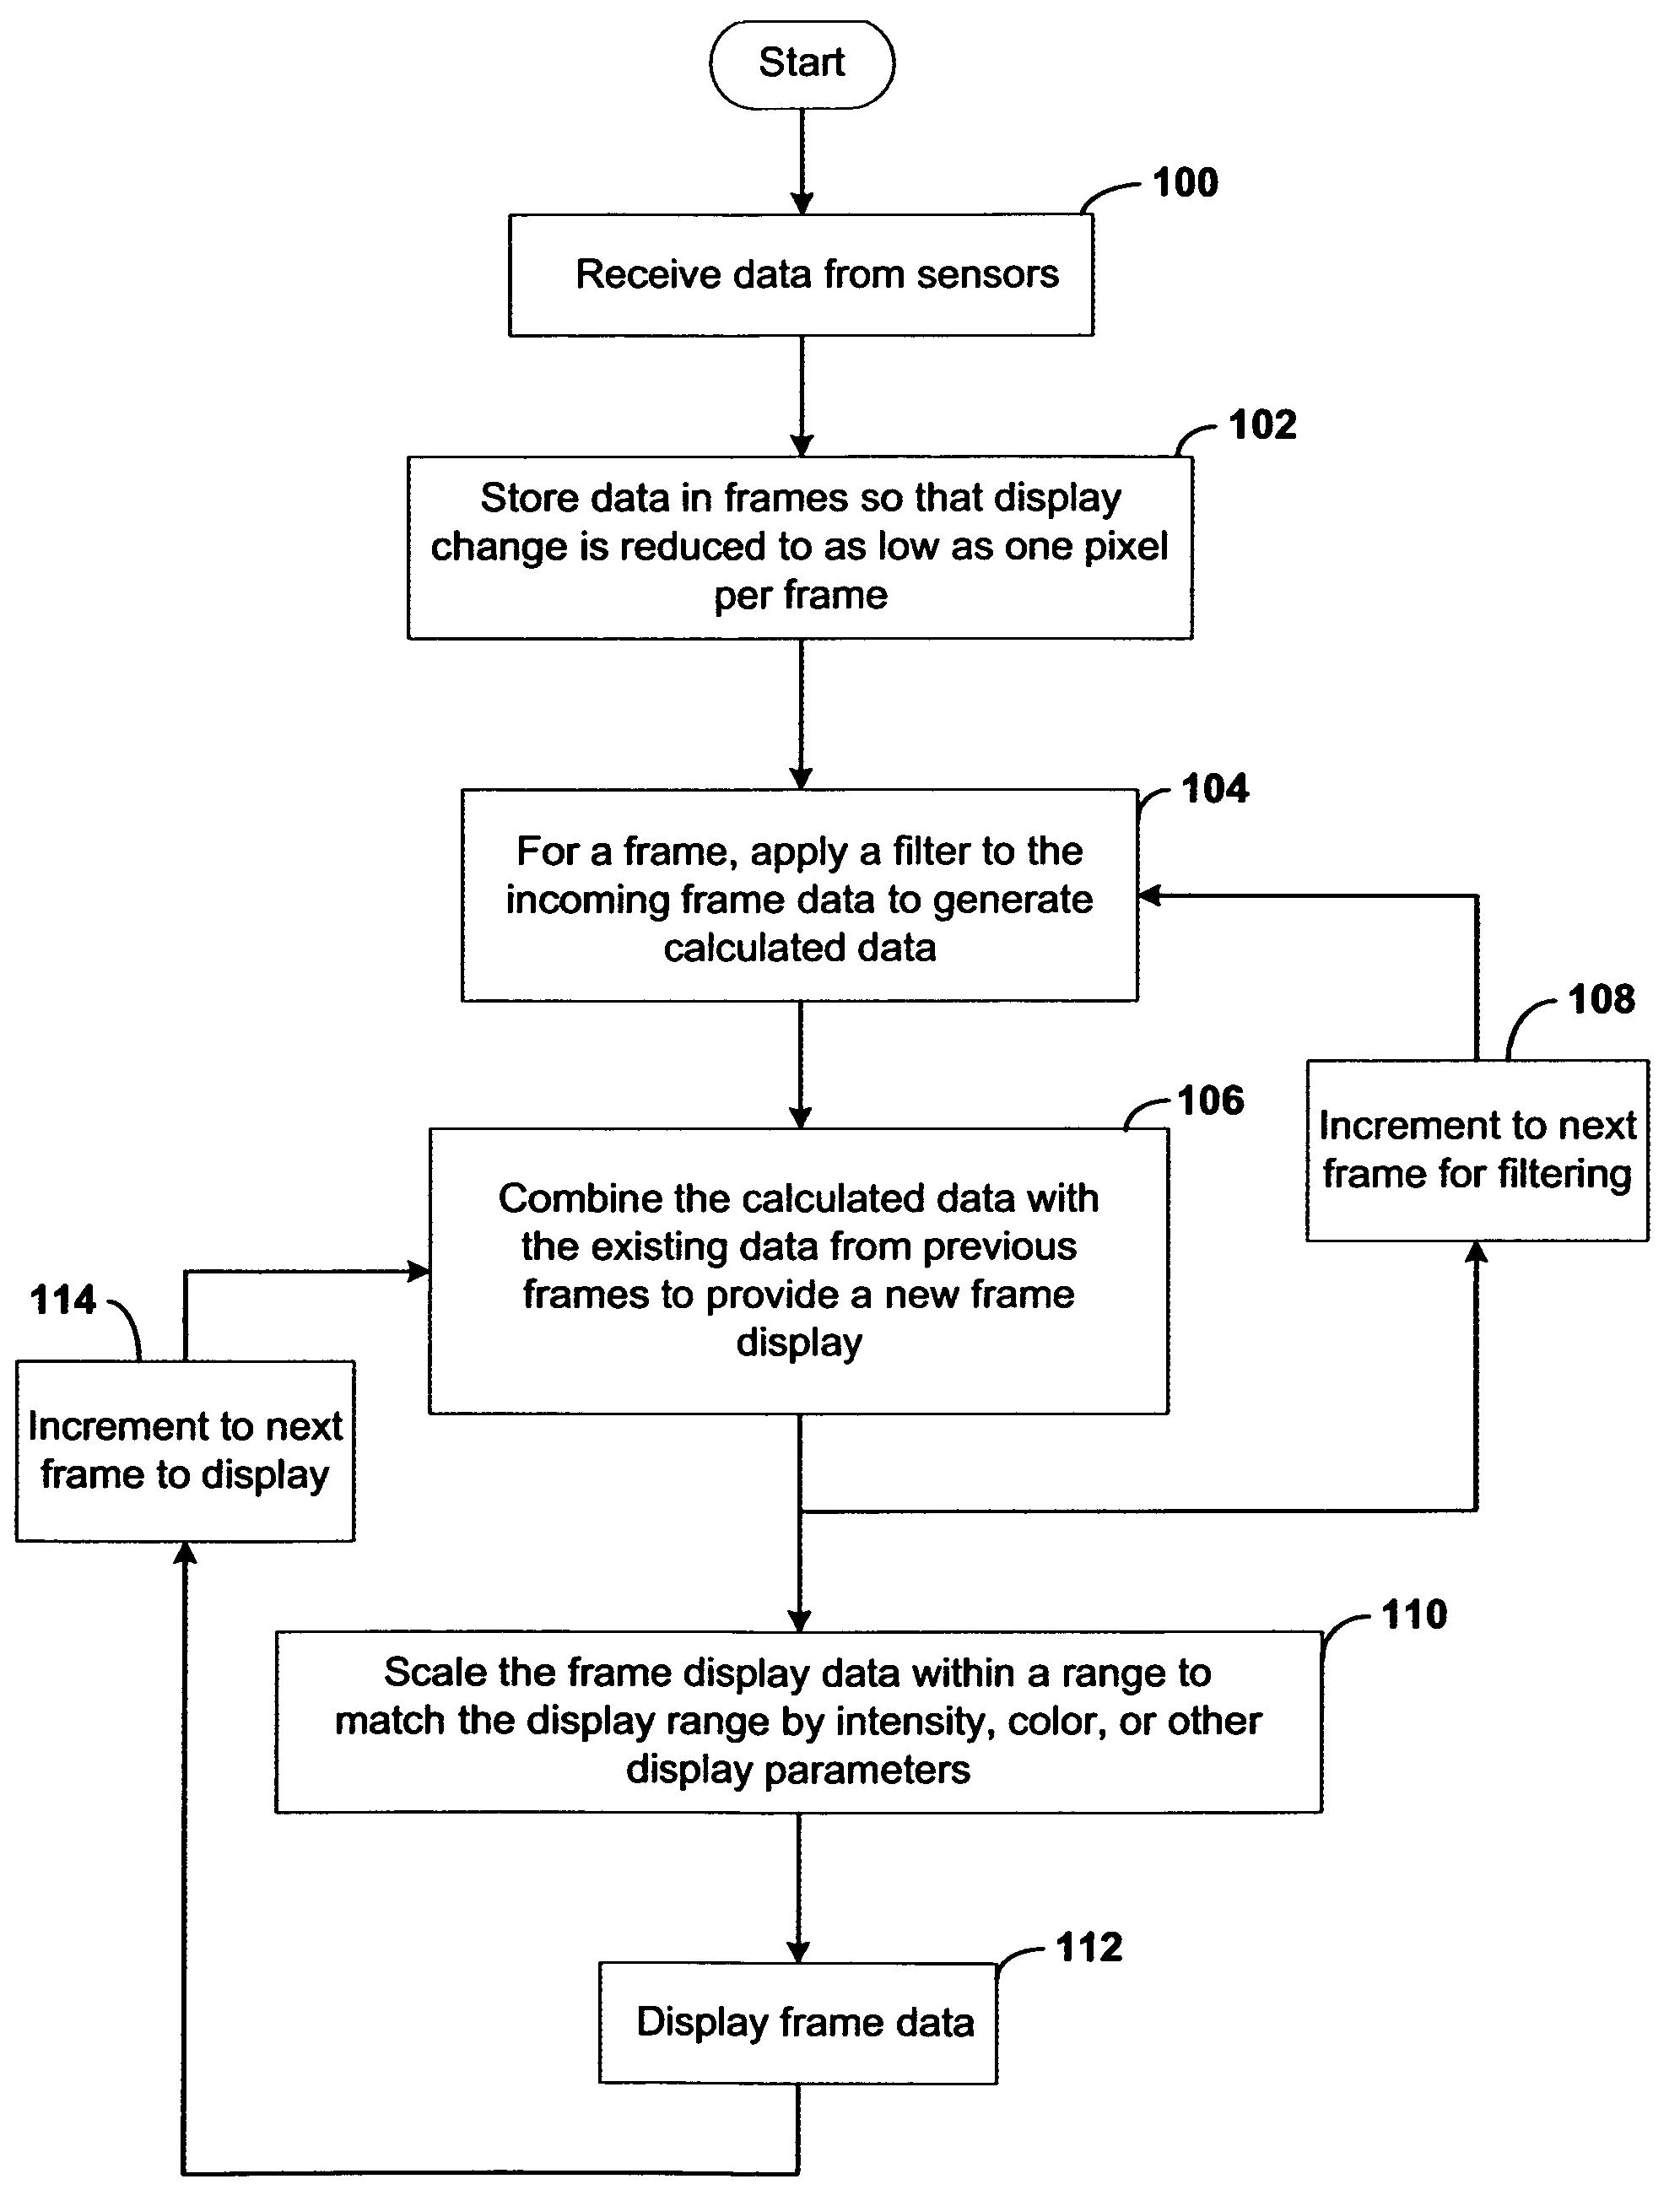
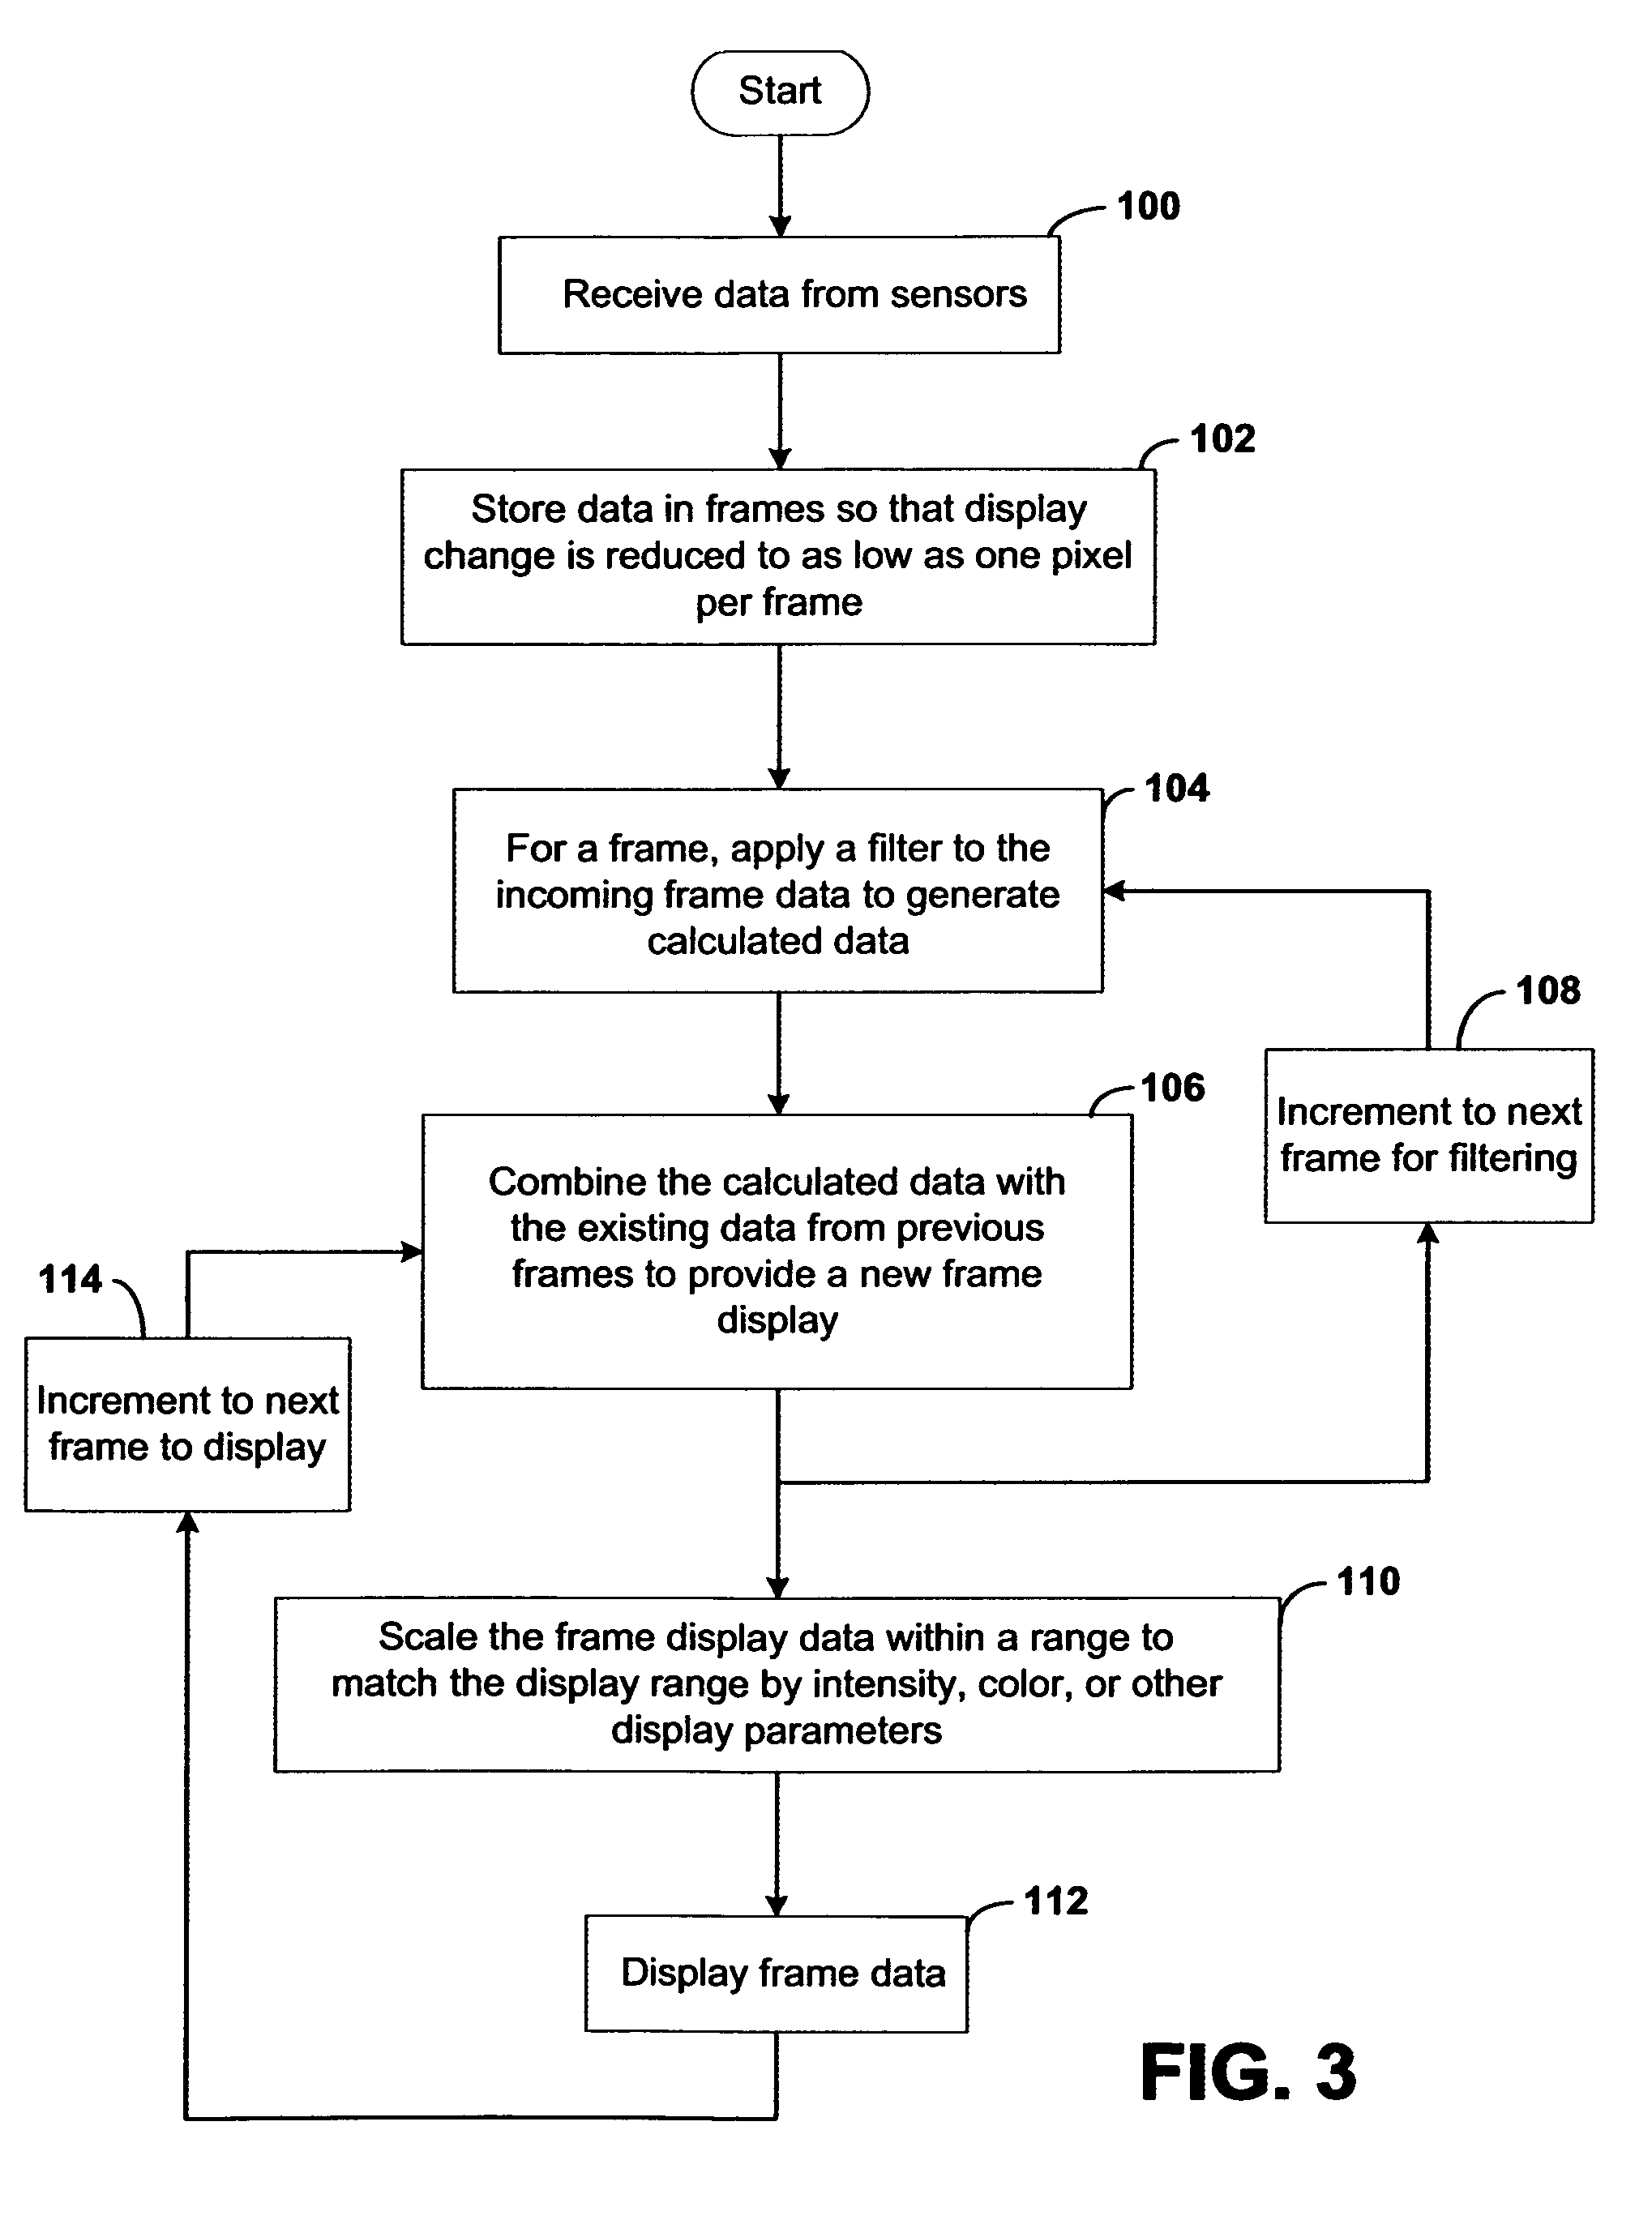
[0123]Converting a Processed Data Frame into a Display Frame

[0124]We auto scale data frame values and X-axis and Y-axis space for the display colors and pixels available. A Liquid Crystal display monitor with 256 shades each of red, green, and blue (RGB) and a size of 1024 by 768 pixels is used. A data frame containing X and Y values across a range of numbers between 0 and 2, and 0 and 10 respectively.

[0125]An X, Y plane is generated using from the above data frame using X values between 0 and 2 and Y values between 0 and 10. A value at 0,0 in the data frame is assigned to the pixel at 0,0. A value at 2,10 in the data frame is assigned to pixel 1042,768. All pixels in between 0,0 and 1024,768 are assigned values from the data frame X divided by the pixel value multiplied by the pixel position. Y values are calculated using the same method. X, Y values in the data frame are assigned display colors by finding the maximum value in the display frame. A maximum data frame is assigned a m...

example 2

[0127]Evaluating Effectiveness of Deep Brain Stimulation

[0128]A tremor in a patient's limb is treated using deep-brain stimulation. Two biological phenomena exhibited by a patient receiving deep-brain stimulation are the physical motion of the limb and the electrical activity of the muscles moving the limb. Limb movement is measured using an accelerometer sensor. Muscle activity is measured by an SEMG monitor. One or more accelerometers and one or more SEMG monitors are attached to a patient's limb. One accelerometer is attached to the back of a hand exhibiting a tremor using, for example, Velcro™ straps, tape or an adhesive. Similarly, electrodes for one or more SEMG monitors are attached to the muscles that are moving to create a tremor in a patients arm.

[0129]Signals from the accelerometer(s) and SEMG electrodes are acquired by digitizing and input into a computer. Signals are acquired continuously from sensors during deep-brain stimulation, and a display of motion, electrical ac...

example 3

[0130]Image Convolution

[0131]FIG. 12 depicts a 3×3 kernel (i.e., 3 pixels by 3 pixels) 1200 selected for image convolution. In each cell of 3×3 kernel 1200, data is represented as an X value and a Y value as “X,Y.” With a 3×3 kernel, there are 9 pixels that can be labeled, 1,1, 1,2, 1,3, 2,1, 2,2, 2,3, and 3,1, 3,2 and 3.3. The X and Y values are weighting values for pixels in which they are present. Weighting values are selected by superimposing onto the kernel a Gaussian (i.e., “Normal”) distribution representing the possible values of the data that can be represented by the kernel. Then, the values of the Gaussian distribution are placed into the 9 bins of the 3×3 kernel. This process of binning is also known as “descritization.” Thus, kernel 1200 is a descritized form of an arbitrary Gaussian distribution selected based on the degree of smoothing is desired. Further, the differences in weighting represent differences in the possible values from the mean (or mode) of the Gaussian...


PUM


Abstract

Systems and methods of this invention display data using pixels with information indicated by color and intensity changes, particularly used for monitoring of physiological variables in real time. For certain methods, physiological data can be acquired by sensors, acquired data can be stored in data frames, data frames can be processed using computer-implemented methods, and processed data frames can be scaled to a display frame for display on a display device. Using such methods, a spot made up of a group of pixels can be updated during a time frame, or cycle using a computer-implemented method, such as addition, subtraction, multiplication, division or a time dependent function. Newly received data can be combined with prior received data to indicate time-dependent changes. In this way, each spot contains a cumulative history of data starting at some initial time. In other embodiments, visual contrast can be enhanced between desired data and other data. In further embodiments, two or more different types of data can be plotted together to indicate relationships between variables. Real time monitoring of signals during therapeutic treatment using light, electricity or other nerve or muscle stimuli can allow a user to monitor physiological responses during stimulation and to make rapid decisions about medical treatment.

Description

CLAIM OF PRIORITY[0001]This application claims priority to U.S. Provisional Application No. 60 / 712,368 filed Aug. 29, 2005, titled: “Method to Display Changes in a Biological Response to Therapy,” Allan Gardiner and Brent McCullough inventors, herein expressly incorporated in its entirety.BACKGROUND[0002]1. Technical Field[0003]The present invention relates to a display, either analog or digital, of one or more signals computed to convey important information about the underlying process responsible for the signal or signals. More particularly, the present invention relates to generating a display by transforming one or more signals into a spatial relationship of two or more dimensions and processing the relationships to display important features to the viewer.[0004]2. Related Art[0005]The display of any function is intended to communicate information to a user. A display of signals requires the viewer to decide if a relationship exists between the signals. Interpretation is simpli...

Claims


Application Information

Patent Timeline
Patent Type & Authority Patents(United States)
IPC IPC(8): G06K9/36A61B5/103
CPCG06T11/206
Inventor GARDINER, ALLANMCCULLOUGH, BRENT MICHAEL
Owner PHOTOMED TECH
Why Eureka
Try Eureka