Systems and methods for displaying changes in biological responses to therapy
a biological response and system technology, applied in the field of systems and methods for displaying changes in biological responses to therapy, to achieve the effect of increasing treatment efficacy and safety, rapid recognition, and improving viewability of spot values
- Summary
- Abstract
- Description
- Claims
- Application Information
AI Technical Summary
Benefits of technology
Problems solved by technology
Method used
Image
Examples
example 1
Converting a Processed Data Frame into a Display Frame
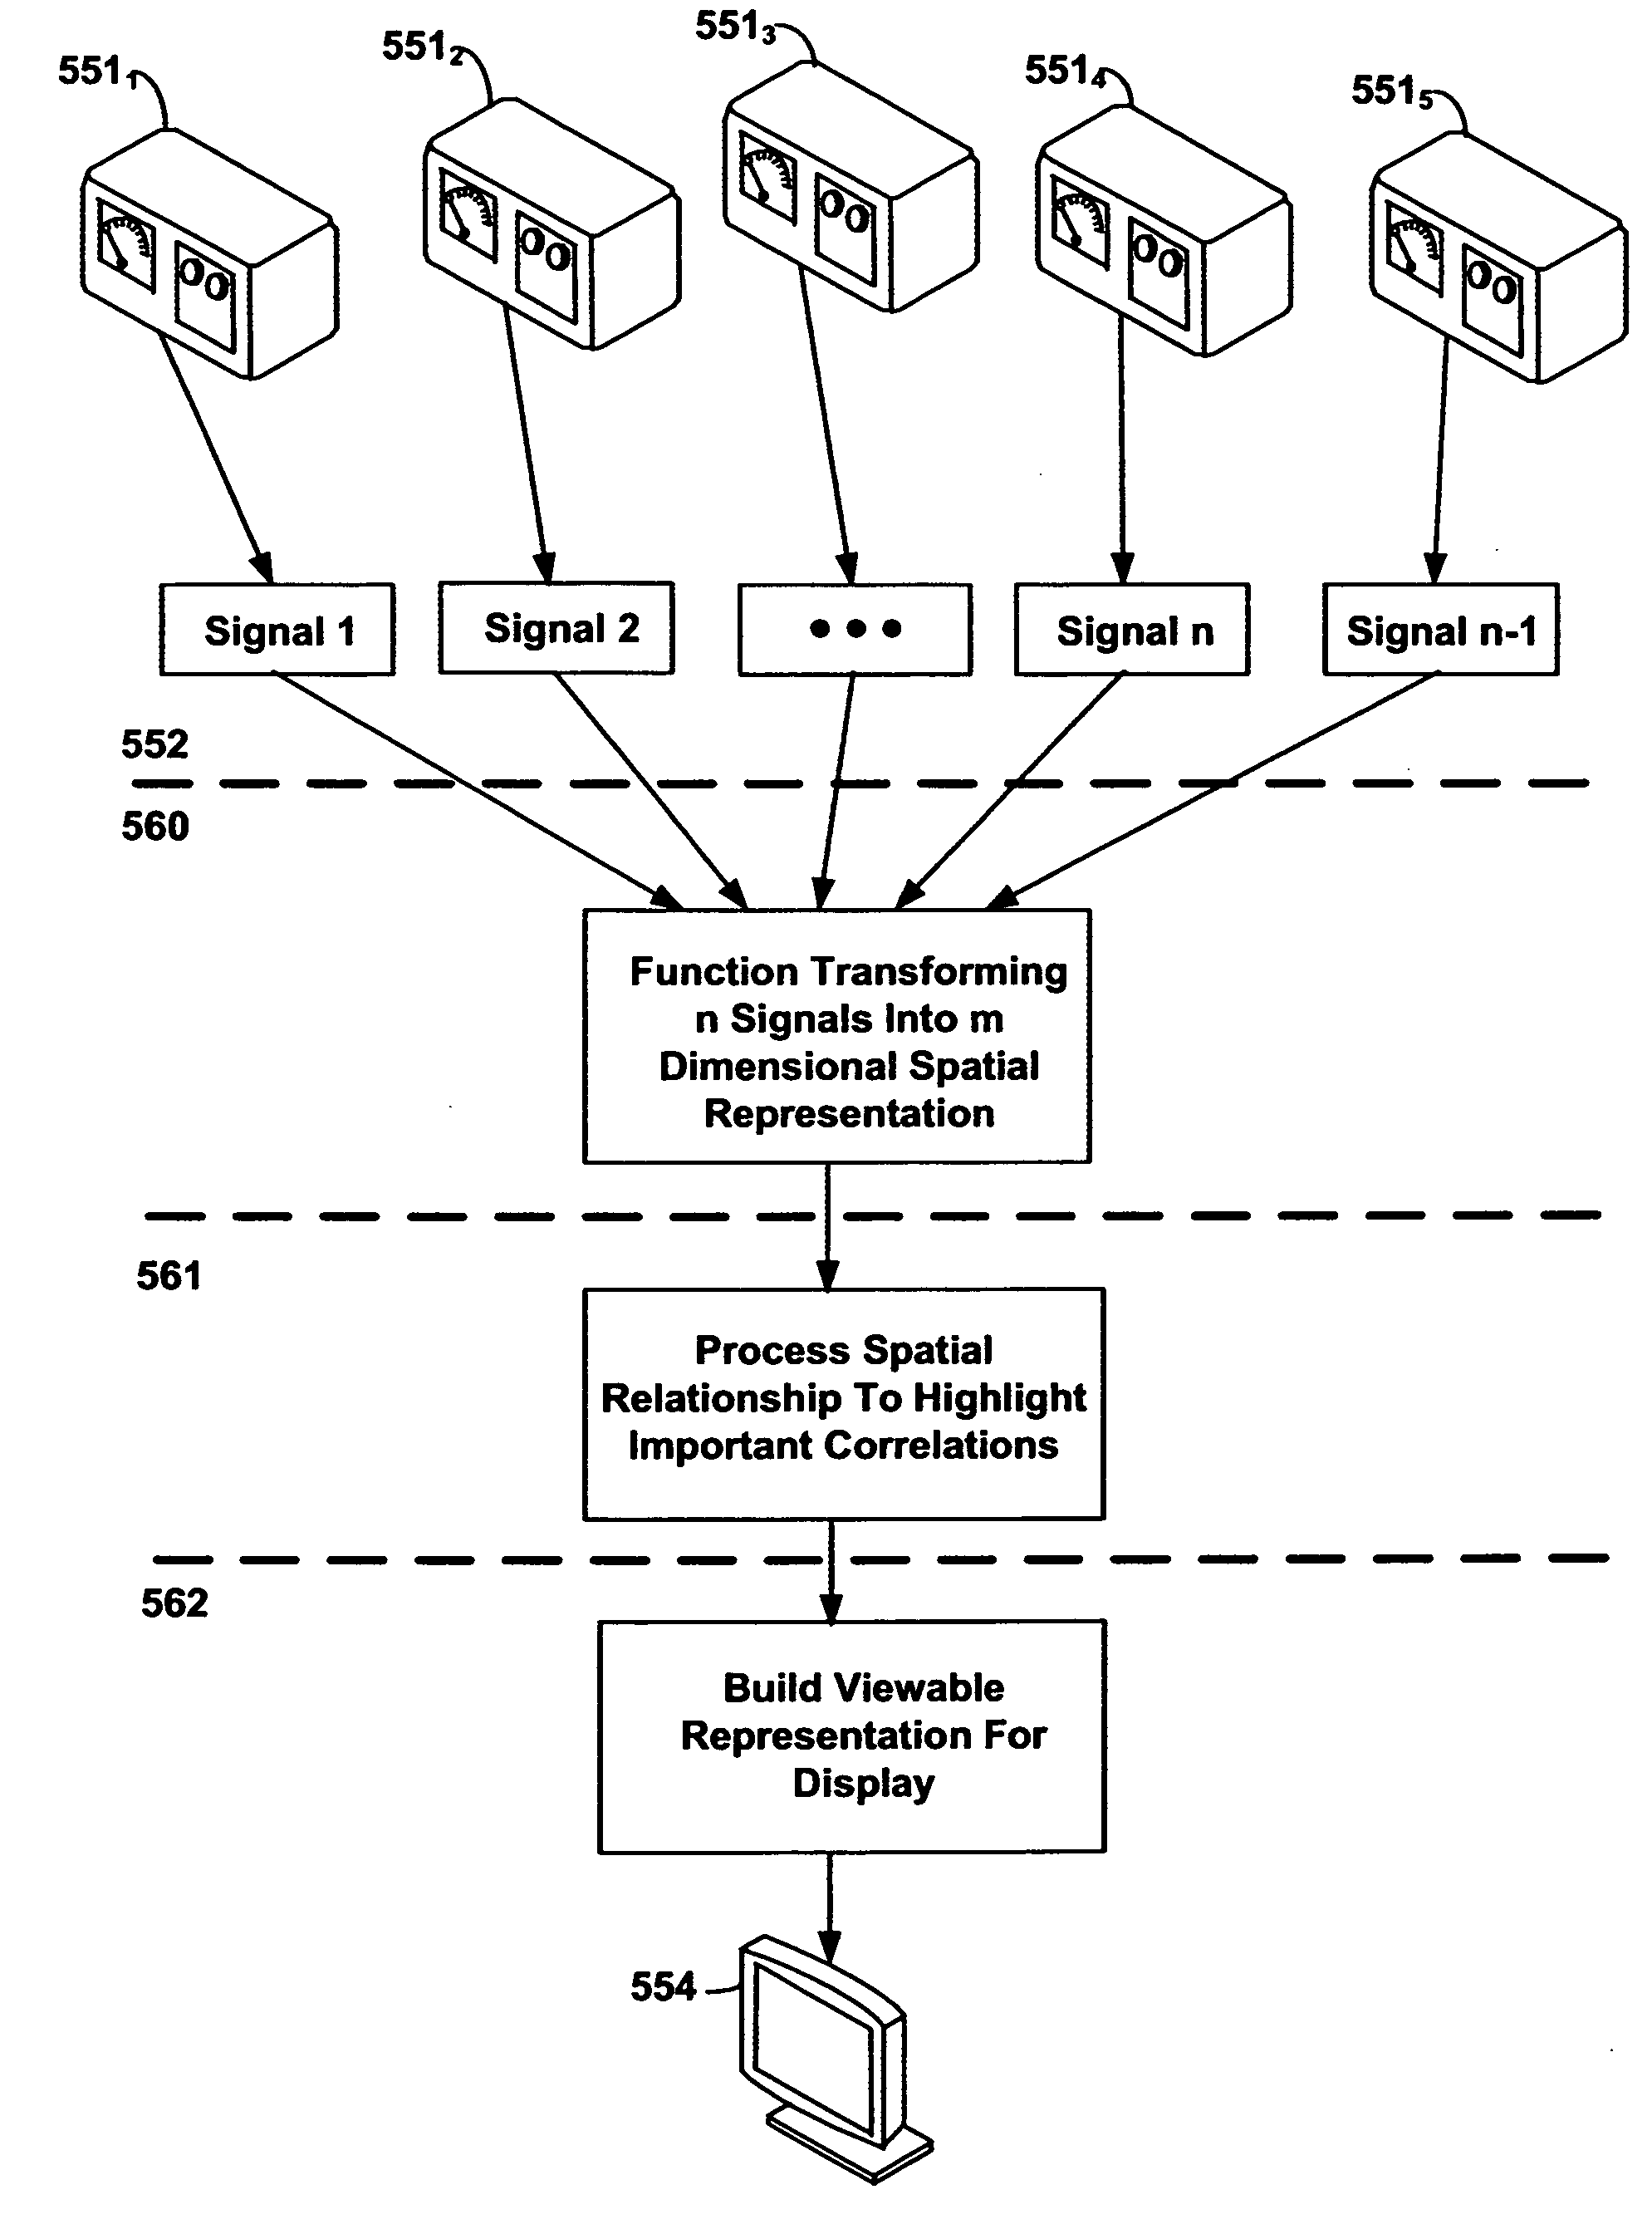
[0122] We auto scale data frame values and X-axis and Y-axis space for the display colors and pixels available. A Liquid Crystal display monitor with 256 shades each of red, green, and blue (RGB) and a size of 1024 by 768 pixels is used. A data frame containing X and Y values across a range of numbers between 0 and 2, and 0 and 10 respectively.
[0123] An X, Y plane is generated using from the above data frame using X values between 0 and 2 and Y values between 0 and 10. A value at 0,0 in the data frame is assigned to the pixel at 0,0. A value at 2,10 in the data frame is assigned to pixel 1042,768. All pixels in between 0,0 and 1024,768 are assigned values from the data frame X divided by the pixel value multiplied by the pixel position. Y values are calculated using the same method. X, Y values in the data frame are assigned display colors by finding the maximum value in the display frame. A maximum data frame is assigned a max...
example 2
Evaluating Effectiveness of Deep Brain Stimulation
[0125] A tremor in a patient's limb is treated using deep-brain stimulation. Two biological phenomena exhibited by a patient receiving deep-brain stimulation are the physical motion of the limb and the electrical activity of the muscles moving the limb. Limb movement is measured using an accelerometer sensor. Muscle activity is measured by an SEMG monitor. One or more accelerometers and one or more SEMG monitors are attached to a patient's limb. One accelerometer is attached to the back of a hand exhibiting a tremor using, for example, Velcro™ straps, tape or an adhesive. Similarly, electrodes for one or more SEMG monitors are attached to the muscles that are moving to create a tremor in a patients arm.
[0126] Signals from the accelerometer(s) and SEMG electrodes are acquired by digitizing and input into a computer. Signals are acquired continuously from sensors during deep-brain stimulation, and a display of motion, electrical acti...
example 3
Image Convolution
[0127]FIG. 12 depicts a 3×3 kernel (i.e., 3 pixels by 3 pixels) 1200 selected for image convolution. In each cell of 3×3 kernel 1200, data is represented as an X value and a Y value as “X,Y.” With a 3×3 kernel, there are 9 pixels that can be labeled, 1,1, 1,2, 1,3, 2,1, 2,2, 2,3, and 3,1, 3,2 and 3.3. The X and Y values are weighting values for pixels in which they are present. Weighting values are selected by superimposing onto the kernel a Gaussian (i.e., “Normal”) distribution representing the possible values of the data that can be represented by the kernel. Then, the values of the Gaussian distribution are placed into the 9 bins of the 3×3 kernel. This process of binning is also known as “descritization.” Thus, kernel 1200 is a descritized form of an arbitrary Gaussian distribution selected based on the degree of smoothing is desired. Further, the differences in weighting represent differences in the possible values from the mean (or mode) of the Gaussian dist...
PUM
 Abstract
Description
Claims
Application Information
 - R&D
- Intellectual Property
- Life Sciences
- Materials
- Tech Scout
- Unparalleled Data Quality
- Higher Quality Content
- 60% Fewer Hallucinations
Browse by: Latest US Patents, China's latest patents, Technical Efficacy Thesaurus, Application Domain, Technology Topic, Popular Technical Reports.
© 2025 PatSnap. All rights reserved.Legal|Privacy policy|Modern Slavery Act Transparency Statement|Sitemap|About US| Contact US: help@patsnap.com


