System for analyzing and visualizing access statistics for a web site

a web site and access statistics technology, applied in the field of system for analyzing and visualizing access statistics for web sites, can solve the problems of limited in scale, limited usefulness of numerical output, limited visualization capability, etc., and achieves easy installation, high scalable manner, and easy to understand graphical output.

Inactive Publication Date: 2010-09-21
CLUSTRMAPS
View PDF6 Cites 124 Cited by
  • Summary
  • Abstract
  • Description
  • Claims
  • Application Information

AI Technical Summary

Benefits of technology

[0008]An aim of certain embodiments of this invention is to provide an improved system for analyzing and visualizing access statistics for a web server that is technically simple to install and can be executed on any web page that it is analyzing in a highly scalable manner. Further, it is an aim of one or more embodiments of the invention to provide a system for analyzing access statistics that produces a readily understandable graphical output.
[0009]A further aim of an embodiment of the invention is to provide a system and a method that enables an “in-situ visualization” (that is, the result is displayed on the site it is analyzing) of visitors to a web site; in a manner that a) is technically simple to install; b) operates at a very large scale, so that for example millions of visitors can be displayed; c) relies on three different methods to achieve scalability: a threshold test for updating maps (which only updates when there is greater than a threshold number of new visits), a variable update frequency (e.g. daily, weekly or monthly), and a variable archive frequency for storing old maps and starting afresh; and d) uses an instrument to trigger the count that is itself a faithful depiction of the visualization (the in-situ map).
[0017]Information in the current database may be periodically copied to an archive. Archived information can be removed from the current database following its being copied to the archive. This ensures that the content of the current database (and therefore the time taken to process it) does not increase indefinitely. Likewise, prior to step d., an image generated in a previous invocation of step d. may be copied to an archive. This allows a history of the visits to be maintained.

Problems solved by technology

However, existing systems suffer from several problems that limit their usefulness.
They provide only numerical output with no visualization capability or provide visualization that is limited in scale.
Also, they do not provide a compact in situ representation of the results that is instantly visible on the very site they are analyzing.

Method used


Image

  • System for analyzing and visualizing access statistics for a web site
  • System for analyzing and visualizing access statistics for a web site
  • System for analyzing and visualizing access statistics for a web site

Examples


Embodiment Construction

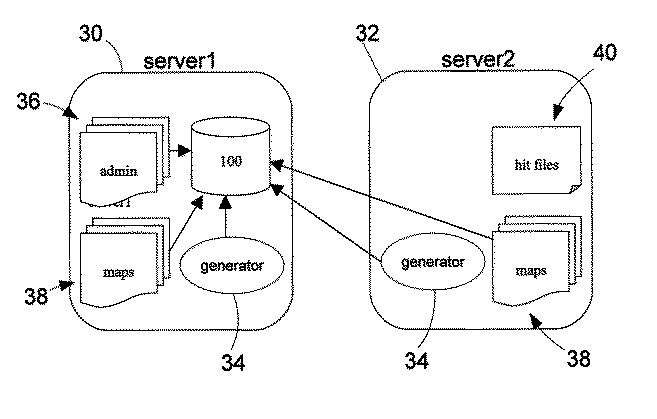
[0028]A system embodying one embodiment of the invention is implemented as a module that operates on a server (which will be referred to as the “system server”) that is connected to the Internet. Most typically, this module is a plug-in component for a web server.

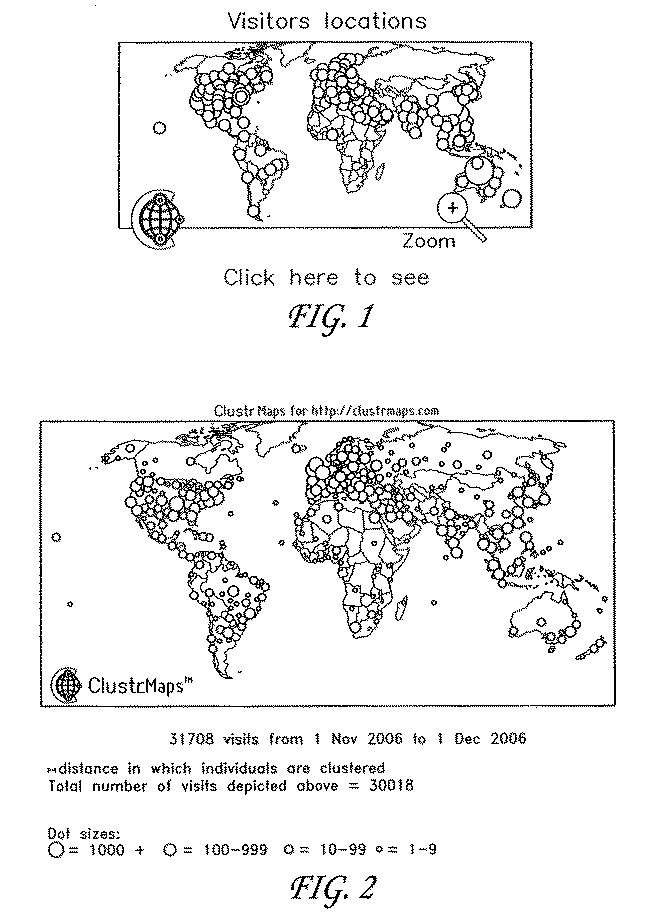
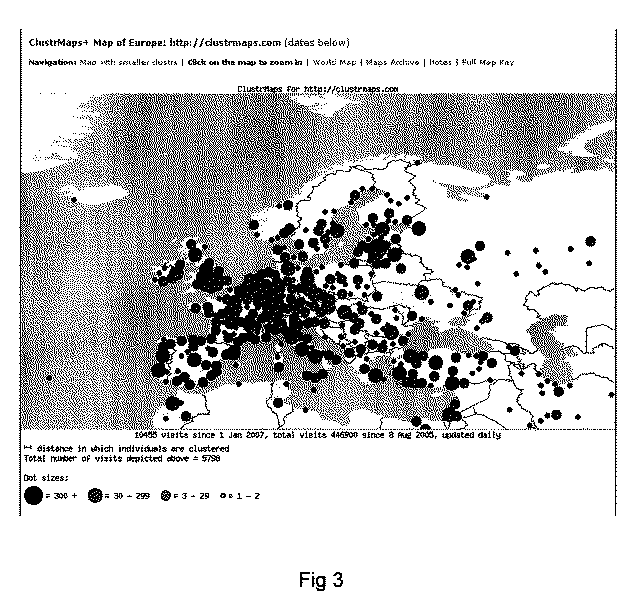
[0029]From the user's point of view the counter consists of a thumbnail-sized map, as shown in FIG. 1, that is displayed as a component of a web page. A user can click on the thumbnail-sized map to display a more-detailed map, as shown in FIG. 2. The user can then click on the more-detailed map to obtain a regional map, as shown in FIG. 3. In some regions, the regional map may itself be clickable to obtain a national map, an example being shown in FIG. 4.

[0030]FIG. 1 shows a typical example of the small thumbnail map that represents just over 41,000 visits to a website. This is displayed as a small image on a web page. That is, it is displayed within the context of the web site that is being monitored.

[0031]After clicking o...


PUM


Abstract

A method for monitoring and visualizing user access made to a web site is disclosed. The method comprises: embedding in a web page to be monitored code to request a thumbnail image from a site when the page is loaded into a browser. The embedded code also includes a user-activateable link to a page within the system server. At the system server, the requested thumbnail image is returned to the web browser, and the IP address from which the thumbnail was requested is recorded. For each recorded IP address, the server determines a corresponding geographical location. The server creates and stores an image that is a geographical representation of the geographical distribution of the recorded IP addresses, and a thumbnail representation of that image. Upon activation of the user-activateable link, the linked page within the system server that includes the image previously created is retrieved by the browser. The thumbnail image requested by the embedded code is the thumbnail image created in this step. A number of threshold, updating, clustering, storage and archiving routines are deployed to ensure large scalability.

Description

BACKGROUND OF THE INVENTION[0001]1. Field of the Invention[0002]This invention relates to a system for analyzing and visualizing access statistics for a web site.[0003]2. Description of the Related Art[0004]Many webmasters value the ability to obtain a detailed understanding of the number and location of those accessing their web sites. This information can be an essential tool in the quest to secure advertising revenue and to understand how better to make a site attractive to users in different locations (e.g. different language versions). Therefore, a range of hit counters and web analysis tools are available. These tools provide systems for counting the number of visitors to a web site, and for analyzing the log files kept by a server.[0005]U.S. Pat. No. 6,804,701 and U.S. Pat. No. 6,792,458 disclose a system and method for monitoring and analyzing Internet traffic. The disclosed system and method processes data by reading log files produced by web servers, or by interfacing with...

Claims


Application Information

Patent Timeline
Patent Type & Authority Patents(United States)
IPC IPC(8): G06F15/16G06F15/177G06F15/173
CPCG06F17/3089G06F16/958
Inventor EISENSTADT, MARCKOMZAK, JIRI
Owner CLUSTRMAPS
Why Eureka
Try Eureka