Methods and system for simultaneous visualization and manipulation of multiple data types

a technology of data types and methods, applied in the field of methods and systems for simultaneous visualization and manipulation of multiple data types, can solve the problems of difficult to view all relevant experimental data at once, difficult to compare visual results, and difficult to achieve the effect of observing data, easy and fast manipulation

Active Publication Date: 2012-03-06
AGILENT TECH INC
View PDF23 Cites 7 Cited by
  • Summary
  • Abstract
  • Description
  • Claims
  • Application Information

AI Technical Summary

Benefits of technology

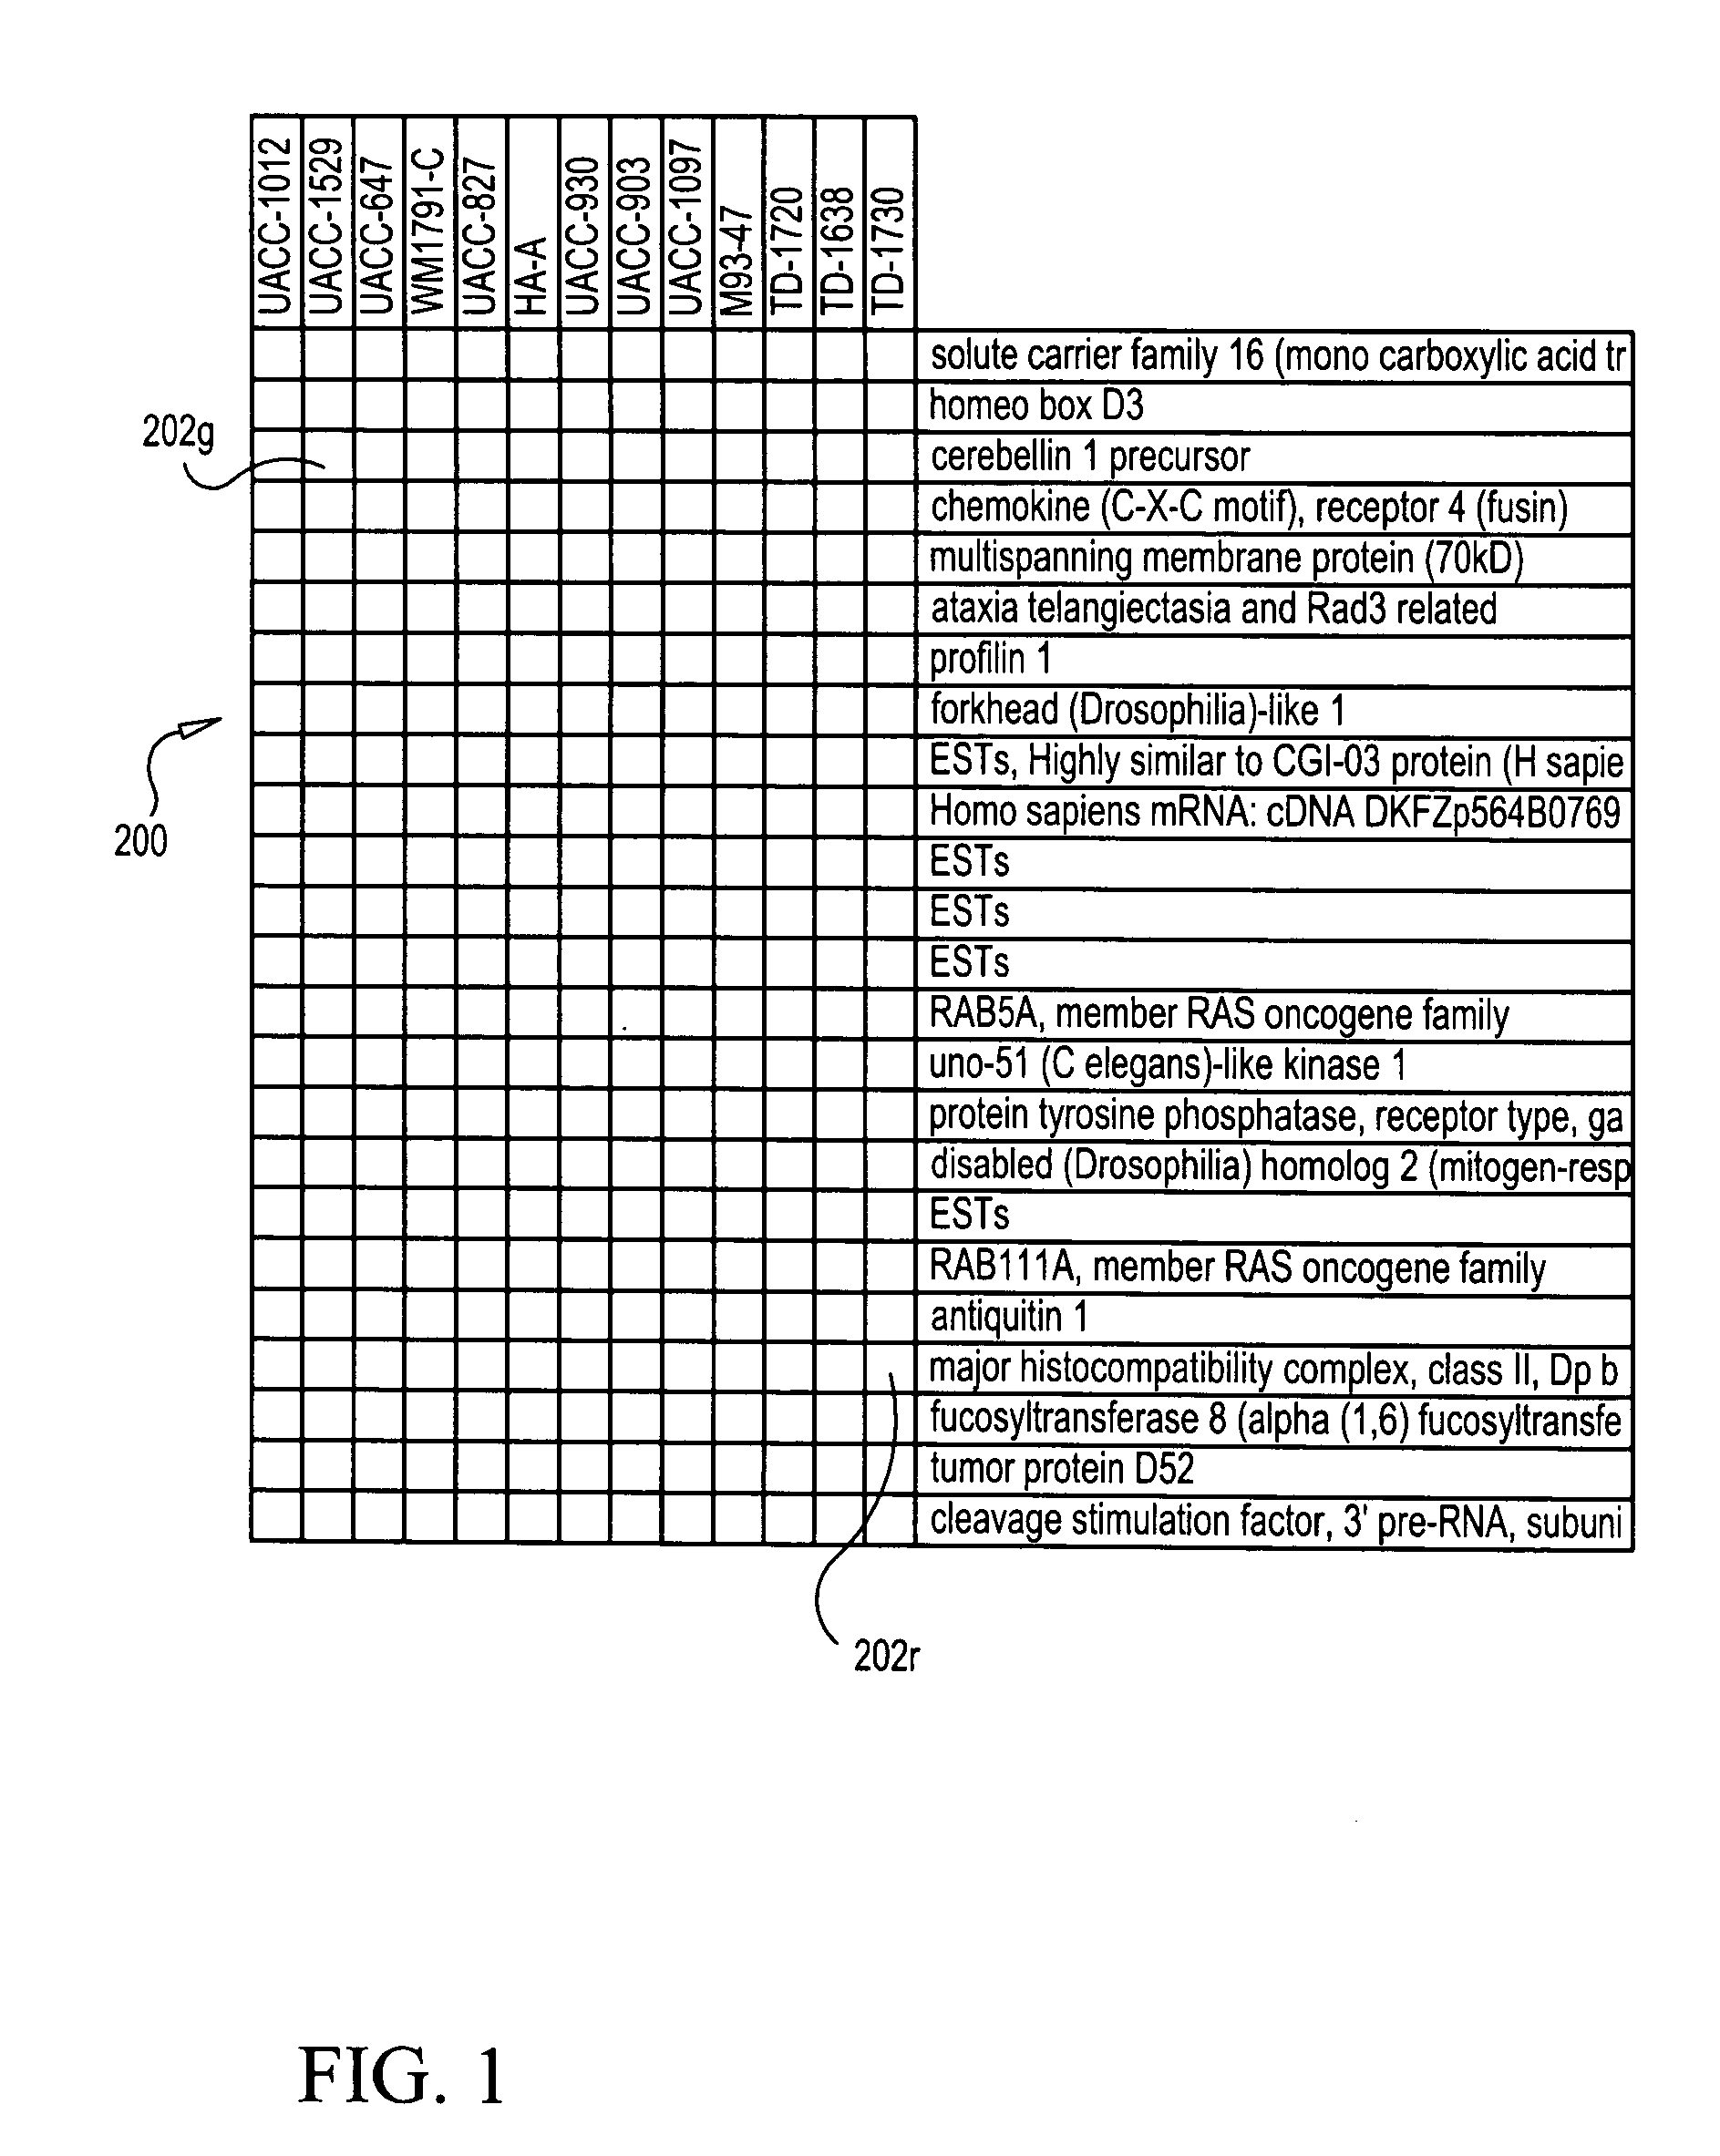
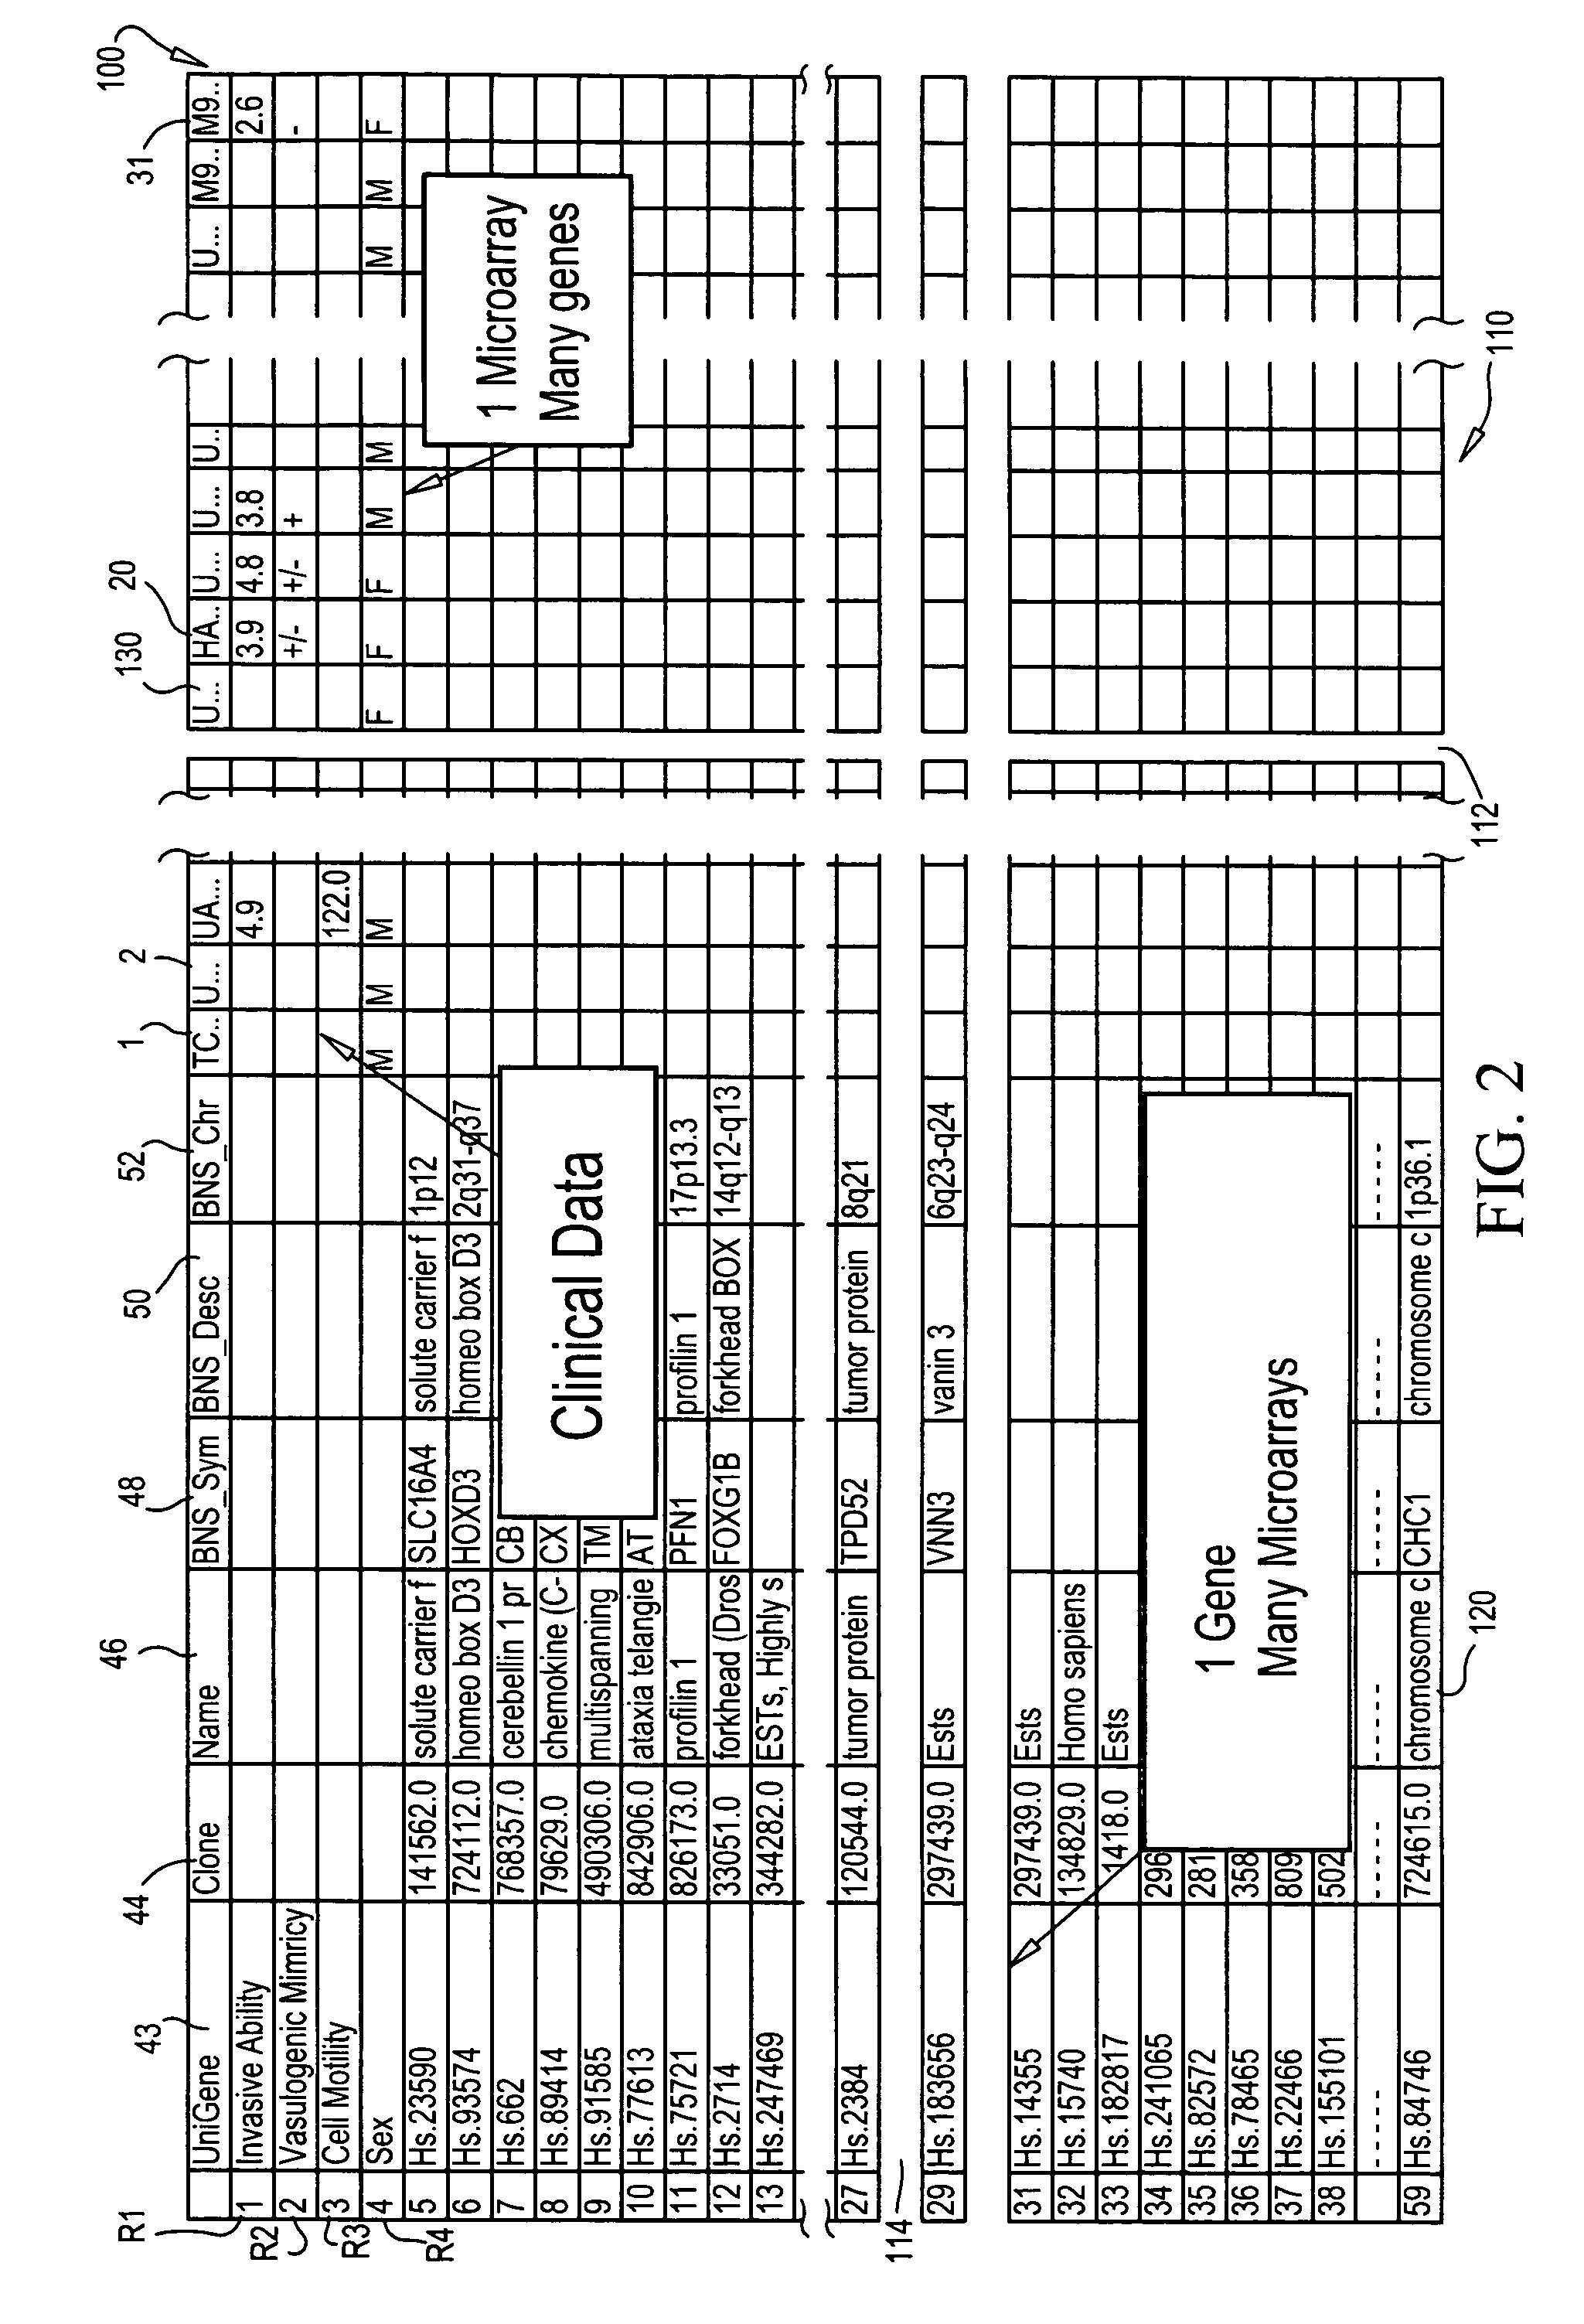
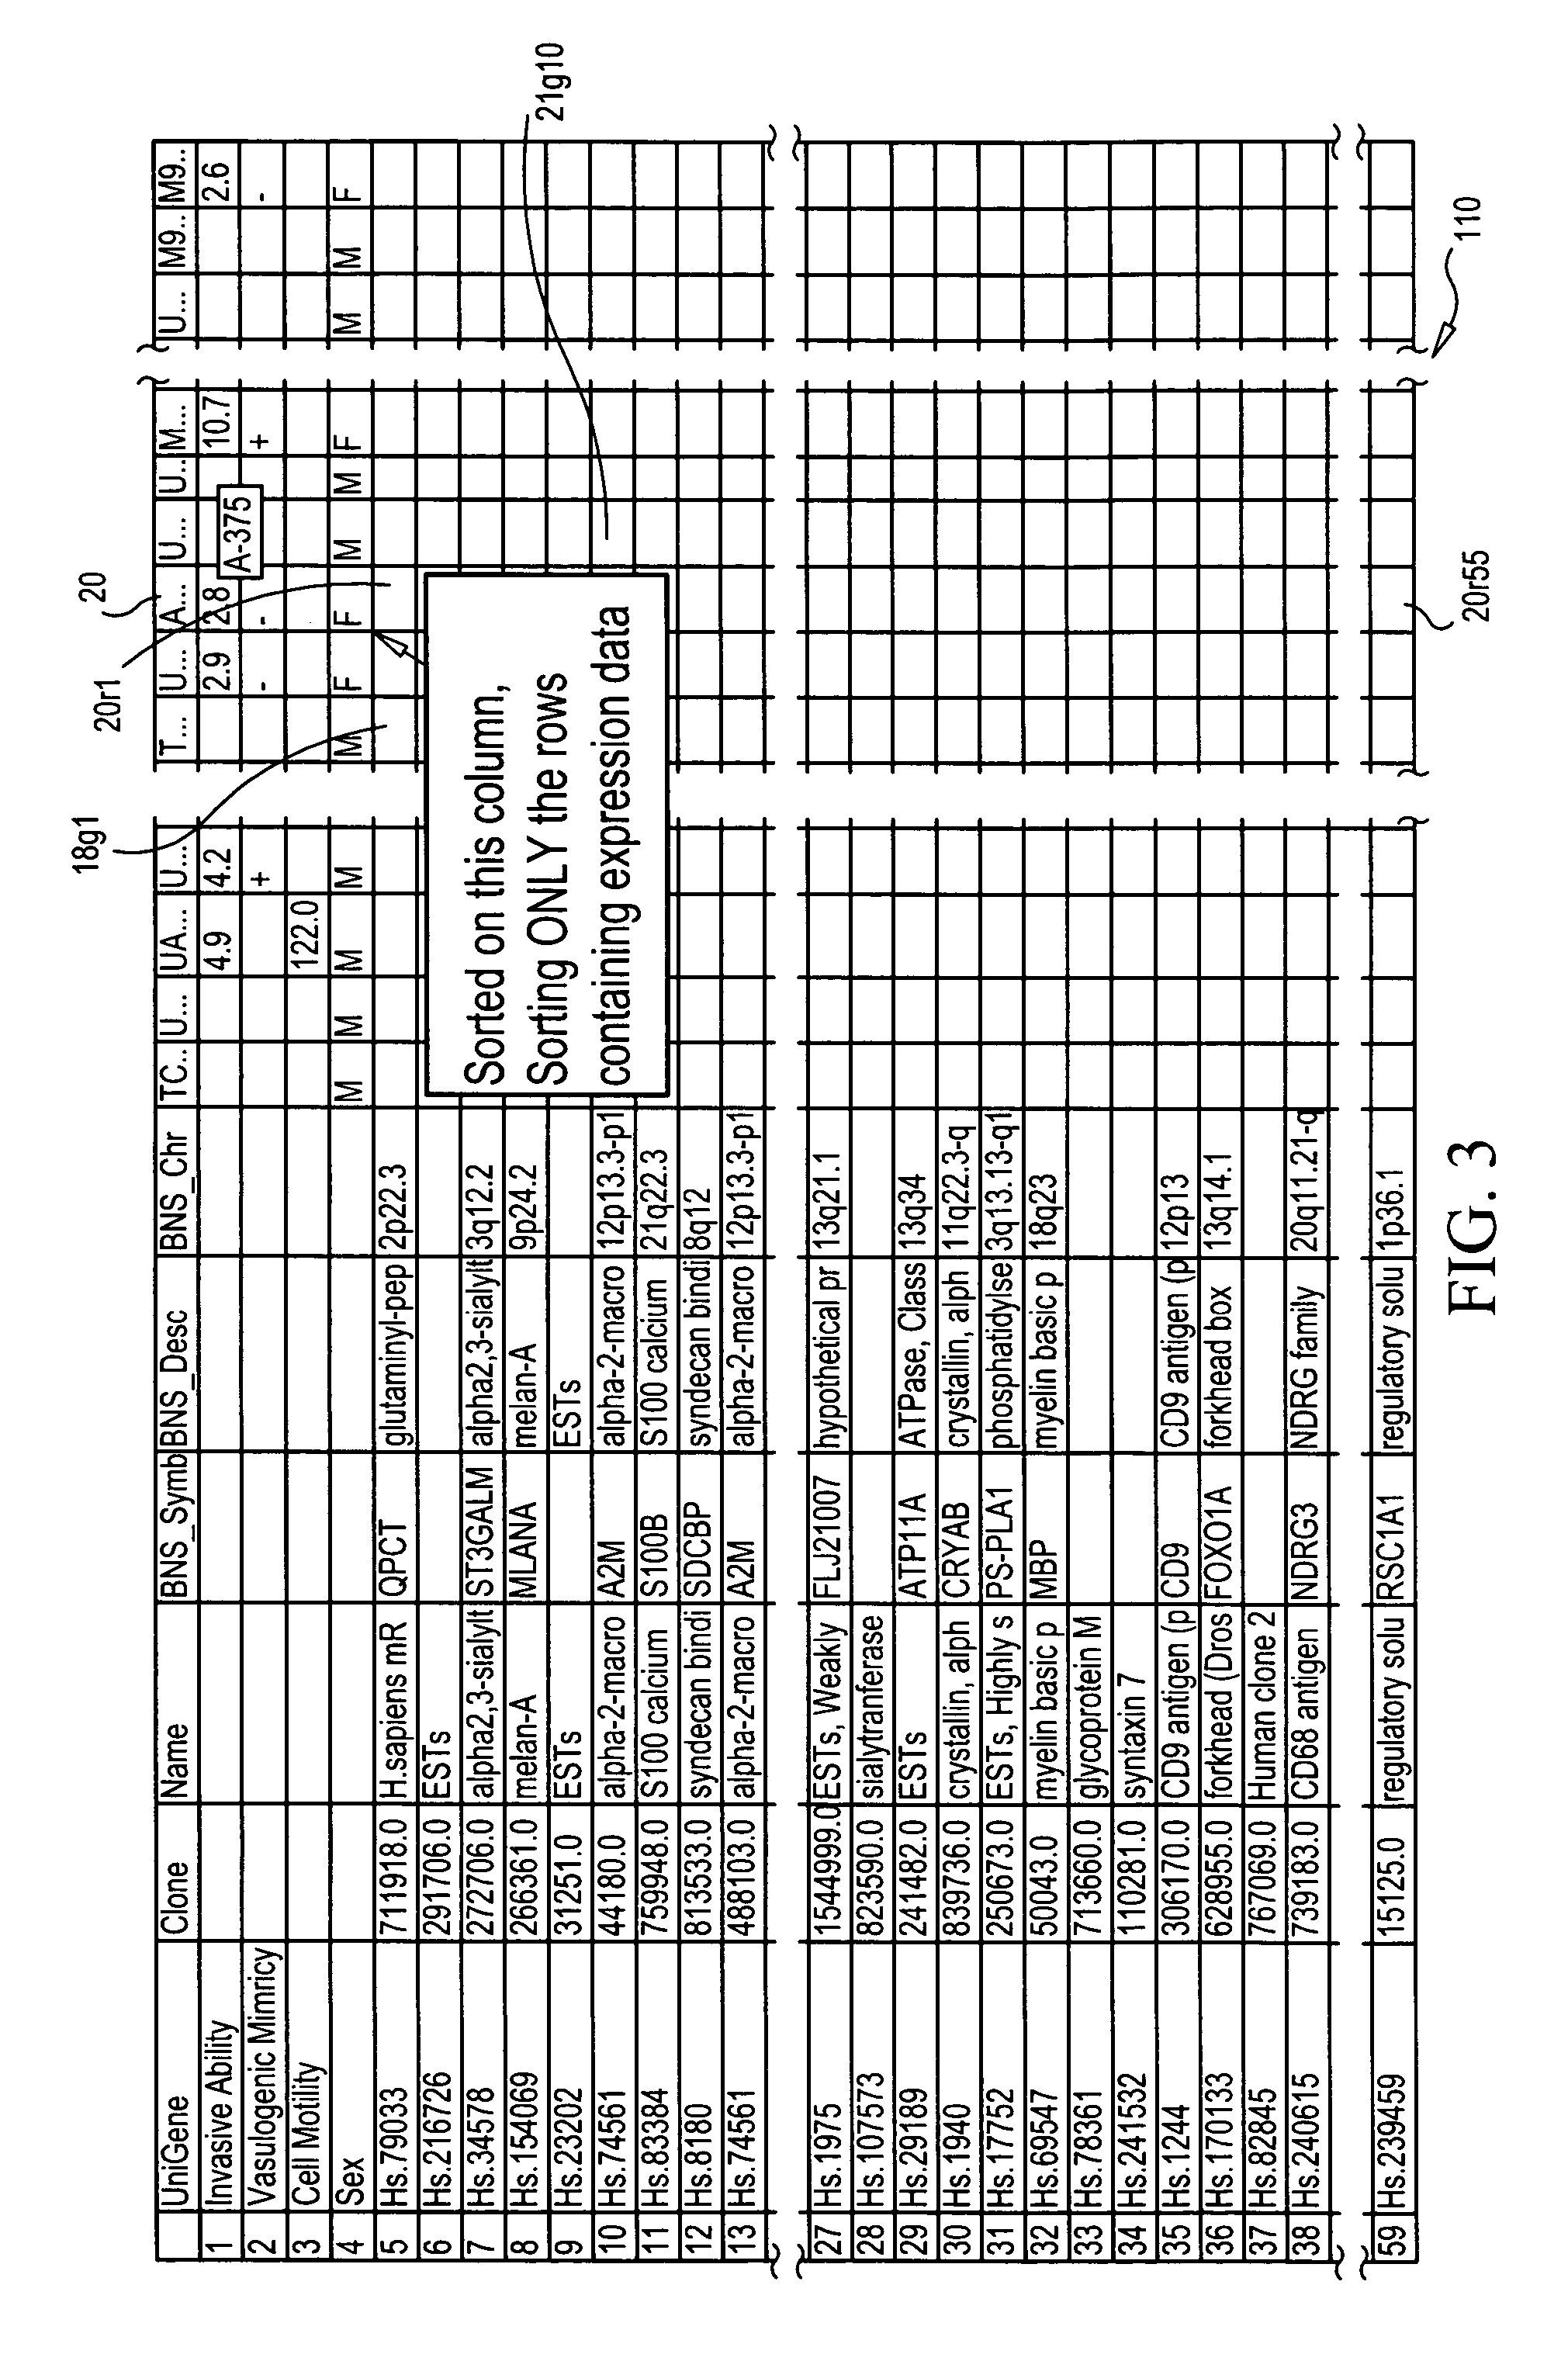
[0011]The present invention provides systems, methods and recordable media for manipulating large data sets for visually identifying relationships among the data that can be useful to a researcher. By manipulating the data according to the present methods, sorting of the data may be accomplished relative to one or more pseudo-data vectors calculated from any of a variety of sources. Data can be easily and quickly manipulated by sorting or reordering rows or columns to expose potentially meaningful correlations and trends in the data which are easily observed.
[0018]The present invention provides extremely powerful techniques for visualizing the massive datasets generated by high-throughput experiments such as DNA microarrays. Further, the results of these experiments can be visually manipulated to look for trends and correlations using simple human intelligence in lieu of more sophisticated analytical tools such as clustering or classification algorithms. Nothing precludes using these algorithmic tools, and the calculated data can even be incorporated into the dataset being examined by the invention. However, the human mind has adapted over evolution to have powerful pattern matching abilities, and this visualization leverages this ability to permit a high degree of ad-hoc high-level analysis and discovery to be performed. Algorithmic techniques are quite powerful, but usually directed toward looking at specific pre-defined correlations or trends. This invention allows approaching the data with no particular predisposition and can be used to provide insight as to which computational techniques might be useful.

Problems solved by technology

Further, the large volumes of data that are generated by current experimental data generating procedures, such as microarray procedures, for example, make this method of correlating an extremely tedious, if not impossible task.
However, the usefulness of these types of approaches has been limited because, due to the sheer volumes of data that usually need to be analyzed, it becomes impossible to view all relevant experimental data together, at once, on a single screen to allow visual comparison.
Not only does this make it difficult to easily make visual comparisons among the data contained in different screens, windows or views, but the ability to manipulate the data so as to make visual comparisons according to different characterizations of the data (different types of sorting, clustering, classification, etc.) to search for trends, correlations or other insights, becomes unwieldy and problematic.
Efforts have been made in attempting to visualize and discover overall gene expression patterns from large gene expression data sets with little success.
The use of scatter plots was reported to be incapable of managing the complexity of the data set being examined.
However, it was reported that Table Lens was ineffective, and “very difficult” for use in finding matching patterns.
Although the system and methods described in the above system can be very useful and powerful in preparing visualizations for the analysis of biological analysis, they also require a significant amount of learning and familiarization with what is otherwise a quite non-intuitive display for those trained in the biological research disciplines.
Those users that have not dedicated enough time to fully understand how to manipulate and interpret the display are likely to be confused or intimidated by the graphical representations of the compressed data and as to how to interpret them.

Method used


Image

  • Methods and system for simultaneous visualization and manipulation of multiple data types
  • Methods and system for simultaneous visualization and manipulation of multiple data types
  • Methods and system for simultaneous visualization and manipulation of multiple data types

Examples


Embodiment Construction

[0039]Before the present methods, tools and system are described, it is to be understood that this invention is not limited to particular data sets, manipulations, tools or steps described, as such may, of course, vary. It is also to be understood that the terminology used herein is for the purpose of describing particular embodiments only, and is not intended to be limiting, since the scope of the present invention will be limited only by the appended claims.

[0040]Unless defined otherwise, all technical and scientific terms used herein have the same meaning as commonly understood by one of ordinary skill in the art to which this invention belongs. Although any methods and materials similar or equivalent to those described herein can be used in the practice or testing of the present invention, the preferred methods and materials are now described. All publications mentioned herein are incorporated herein by reference to disclose and describe the methods and / or materials in connectio...


PUM

PropertyMeasurementUnit
physicalaaaaaaaaaa
physical measurementsaaaaaaaaaa
distanceaaaaaaaaaa

Abstract

Software systems, methods and recordable media for organizing and manipulating diverse data sets to facilitate identification, trends, correlations and other useful relationships among the data. Extremely large data sets such as microarray data and other biological data are graphically displayed and sorted in an effort to develop visual similarities, correlations or trends that can be seen by a user of the present invention. Various schemes for graphical representations of the data, as well as sorting schemes are provided, including sorting schemes performed relative to pseudo-data vectors.

Description

CROSS-REFERENCE[0001]This application is a continuation-in-part application of application Ser. No. 10 / 403,762, filed Mar. 31, 2003, which claims the benefit of Provisional Application No. 60 / 402,566, filed Aug. 8, 2002. Application Ser. No. 10 / 403,762 and Provisional Application No. 60 / 402,566 are both incorporated herein, in their entireties, by reference thereto, and to which applications we claim priority under 35 USC §120.FIELD OF THE INVENTION[0002]The present invention pertains to software systems and methods for organizing and manipulating diverse data sets to facilitate identification, trends, correlations and other useful relationships among the data.BACKGROUND OF THE INVENTION[0003]The advent of new experimental technologies that support molecular biology research have resulted in an explosion of data and a rapidly increasing diversity of biological measurement data types. Examples of such biological measurement types include gene expression from DNA microarray or Taqman ...

Claims


Application Information

Patent Timeline
Patent Type & Authority Patents(United States)
IPC IPC(8): G01N33/48G01N33/50G06F17/30G06T11/20G16B25/10G16B25/30G16B40/10G16B45/00
CPCG06F19/26G06T11/206G06F19/20G06F19/24G06F19/3443G16H50/70G16B25/00G16B40/00G16B45/00G16B25/30G16B40/10G16B25/10
Inventor KINCAID, ROBERT
Owner AGILENT TECH INC
Why Eureka
Try Eureka