Method and apparatus for quantifying, predicting and monitoring the conversational quality

a conversational quality and quantitative technology, applied in the field of assessing voice quality, can solve the problems of degrading the transmitted voice signal, affecting normal and natural conversational patterns, and modern telecommunication networks adding significant transmission delays

Inactive Publication Date: 2012-05-22
MINDSPEED TECH INC
View PDF6 Cites 22 Cited by
  • Summary
  • Abstract
  • Description
  • Claims
  • Application Information

AI Technical Summary

Benefits of technology

[0014]There are provided systems and methods for assessing quantifying, predicting and monitoring conversational quality in a telecommunication system, substantially as shown in and / or described in connection with at least one of the figures, as set forth more completely in the claims.

Problems solved by technology

All of these technologies contribute significantly to the degradation of the transmitted voice signal over VoIP networks, and consequently, to conversational quality.
For example, in the process of transmitting the speech signal from one side to another, modern telecommunication networks add significant transmission delay that are typically caused by digitization and packetization of the speech signal, which include signal processing delay, routing delay, packet loss, jitter delay, etc.
As these transmission delays increase, they interfere with normal and natural conversational patterns.
Rather, the increased delay significantly impacts conversational effort, ease and satisfaction.
As further examples, noise reduction, automatic gain control, comfort noise generation and echo cancellation technologies add their own degradation to the speech signal.
These degradations, in turn, impact conversational quality, effort and user satisfaction in these telecommunication systems.
These current techniques, however, do not include any metrics or models for quantifying the effects of delay and other communication impairments on the ease and naturalness of conversations.
This model does not actually monitor the calls in progress to determine the voice quality of a given call.
Further, this model is confined to narrow-band telephony (300 Hz-3400 Hz) and includes a limited set of voice technologies, such as narrow-band speech codecs, round-trip delays below 600 ms, bit errors, packet loss, and limited levels of residual echo.
However, E-Model fails to include effects of a number of significant voice technologies, such as wideband telephony (for example, 50 Hz-7000 Hz bandwidth), hands-free communications (such as speaker phones), multi-party conversations (conferencing), round-trip delays of greater than 600 ms, noise reduction system, more annoying effects of residual echoes, etc.
Even more, E-Model does not measure the actual conversational patterns in predicting voice quality, but it only computes an estimated conversational quality (CQE) due to the effects of a limited set of voice technologies incorporated in that model.
However, both models fail to include the effects of a number of significant voice technologies, such as wideband telephony (for example, 50 Hz-7000 Hz bandwidth), hands-free communications (such as speaker phones), multi-party conversations (conferencing), round-trip delays, noise reduction system, effects of residual echoes and echo cancellers, etc.
Even more, these models also do not predict total conversational voice quality, but they merely predict a one-way voice quality.
Additionally, these models also do not utilize actual conversational parameters and patterns in predicting voice quality.
Similar to the limitations of all of the above models, the relevance of this model is confined to narrow-band telephony (300 Hz-3400 Hz) and includes a limited set of voice technologies, such as narrow-band speech codecs, bit errors, packet loss, VAD, and jitter.
The PESQ model fails to include the effects of a number of significant voice technologies, such as extended wideband telephony (for example, 50 Hz-14000 Hz bandwidth), hands-free communications (such as speaker phones), multi-party conversations (conferencing), round-trip delays, noise reduction system, effects of residual echoes and echo cancellers, etc.
Further, The PESQ model does not predict conversational voice quality; but it merely predicts one-way voice quality, and also does not utilize actual conversational parameters and patterns in predicting voice quality.
While this is a very useful first step, it does not capture the true conversational ease or user dis / satisfaction.

Method used


Image

  • Method and apparatus for quantifying, predicting and monitoring the conversational quality
  • Method and apparatus for quantifying, predicting and monitoring the conversational quality
  • Method and apparatus for quantifying, predicting and monitoring the conversational quality

Examples


example 1

Linear Combination, Power Low—Based on CII and TII Values

[0094]CQMON=∑n⁢wn⁡(fn)α⁢n[0095]n Number of features used to derive CQMON, where n[0096]wn Feature-specific weight (includes normalizarion)[0097]αn Exponent associated with each feature[0098]fn Value for each feature

example 2

Weighted Log Combination

[0099]CQMON=∑n⁢logbn⁡(wn⁡(fn)αn)[0100]bn indicates that the log base need not be the same for all features

[0101]The feature set={CII, TII} or a subset of {DTR, FSDT, FSST, MS, MSR, RTS_LTN_SNR, NTLP, ANR, VAD, TrFO, TFO, PLC, NPJ, SCT, ERLE, RT, CII, TII}. The weight and exponents for each feature will be derived based on subjective conversation evaluation. The impact of language and contents can be considered during this evaluation phase.

example 3

Statistical Models of CQMON (Mapping Functions}

[0102]If we define the CQMON space as the set Q={q1, q2, . . . , qM}, where M can be finite or infinite. This set may include all possible values for CQMON. Similarly, we can define the feature space as the set Γcqmon={F1, F2, . . . , }, where each element consists of an n dimensional vector whose elements are a subset of {DTR, FSDT, FSST, MS, MSR, RTS_LTN_SNR, NTLP, ANR, VAD, TrFO, TFO, PLC, NPJ, SCT, ERLE, RT, CII, TII}. The feature set may include all possible values for feature vector. Further, designing a classifier for statistical models may include:[0103]Training phase: Define a training set consisting of a representative subset of feature space. These are the points in the feature space that one considers representative for a particular scenario (technology framework, network, devices, etc.)[0104]Labeling phase: Associate a value from the CQMON space to each element of the training set. (Experimentation and subjective evaluation...


PUM


Abstract

There is provided a method of quantifying a voice quality in a telecommunication system including a first gateway in communication with a second gateway over a packet network. The method comprises deriving speech parameters from a first speech signal of a first talker received by the first gateway over a first communication line and a second speech signal of a second talker received by the first gateway from the second gateway over the packet network, determining a conversational impairment index using the speech parameters, deriving technology parameters based on voice technology and components in the telecommunication system, determining a technology impairment index using the technology parameters, and mapping the conversational impairment index and the technology impairment index into a conversational quality index to quantify the voice quality in the telecommunication system.

Description

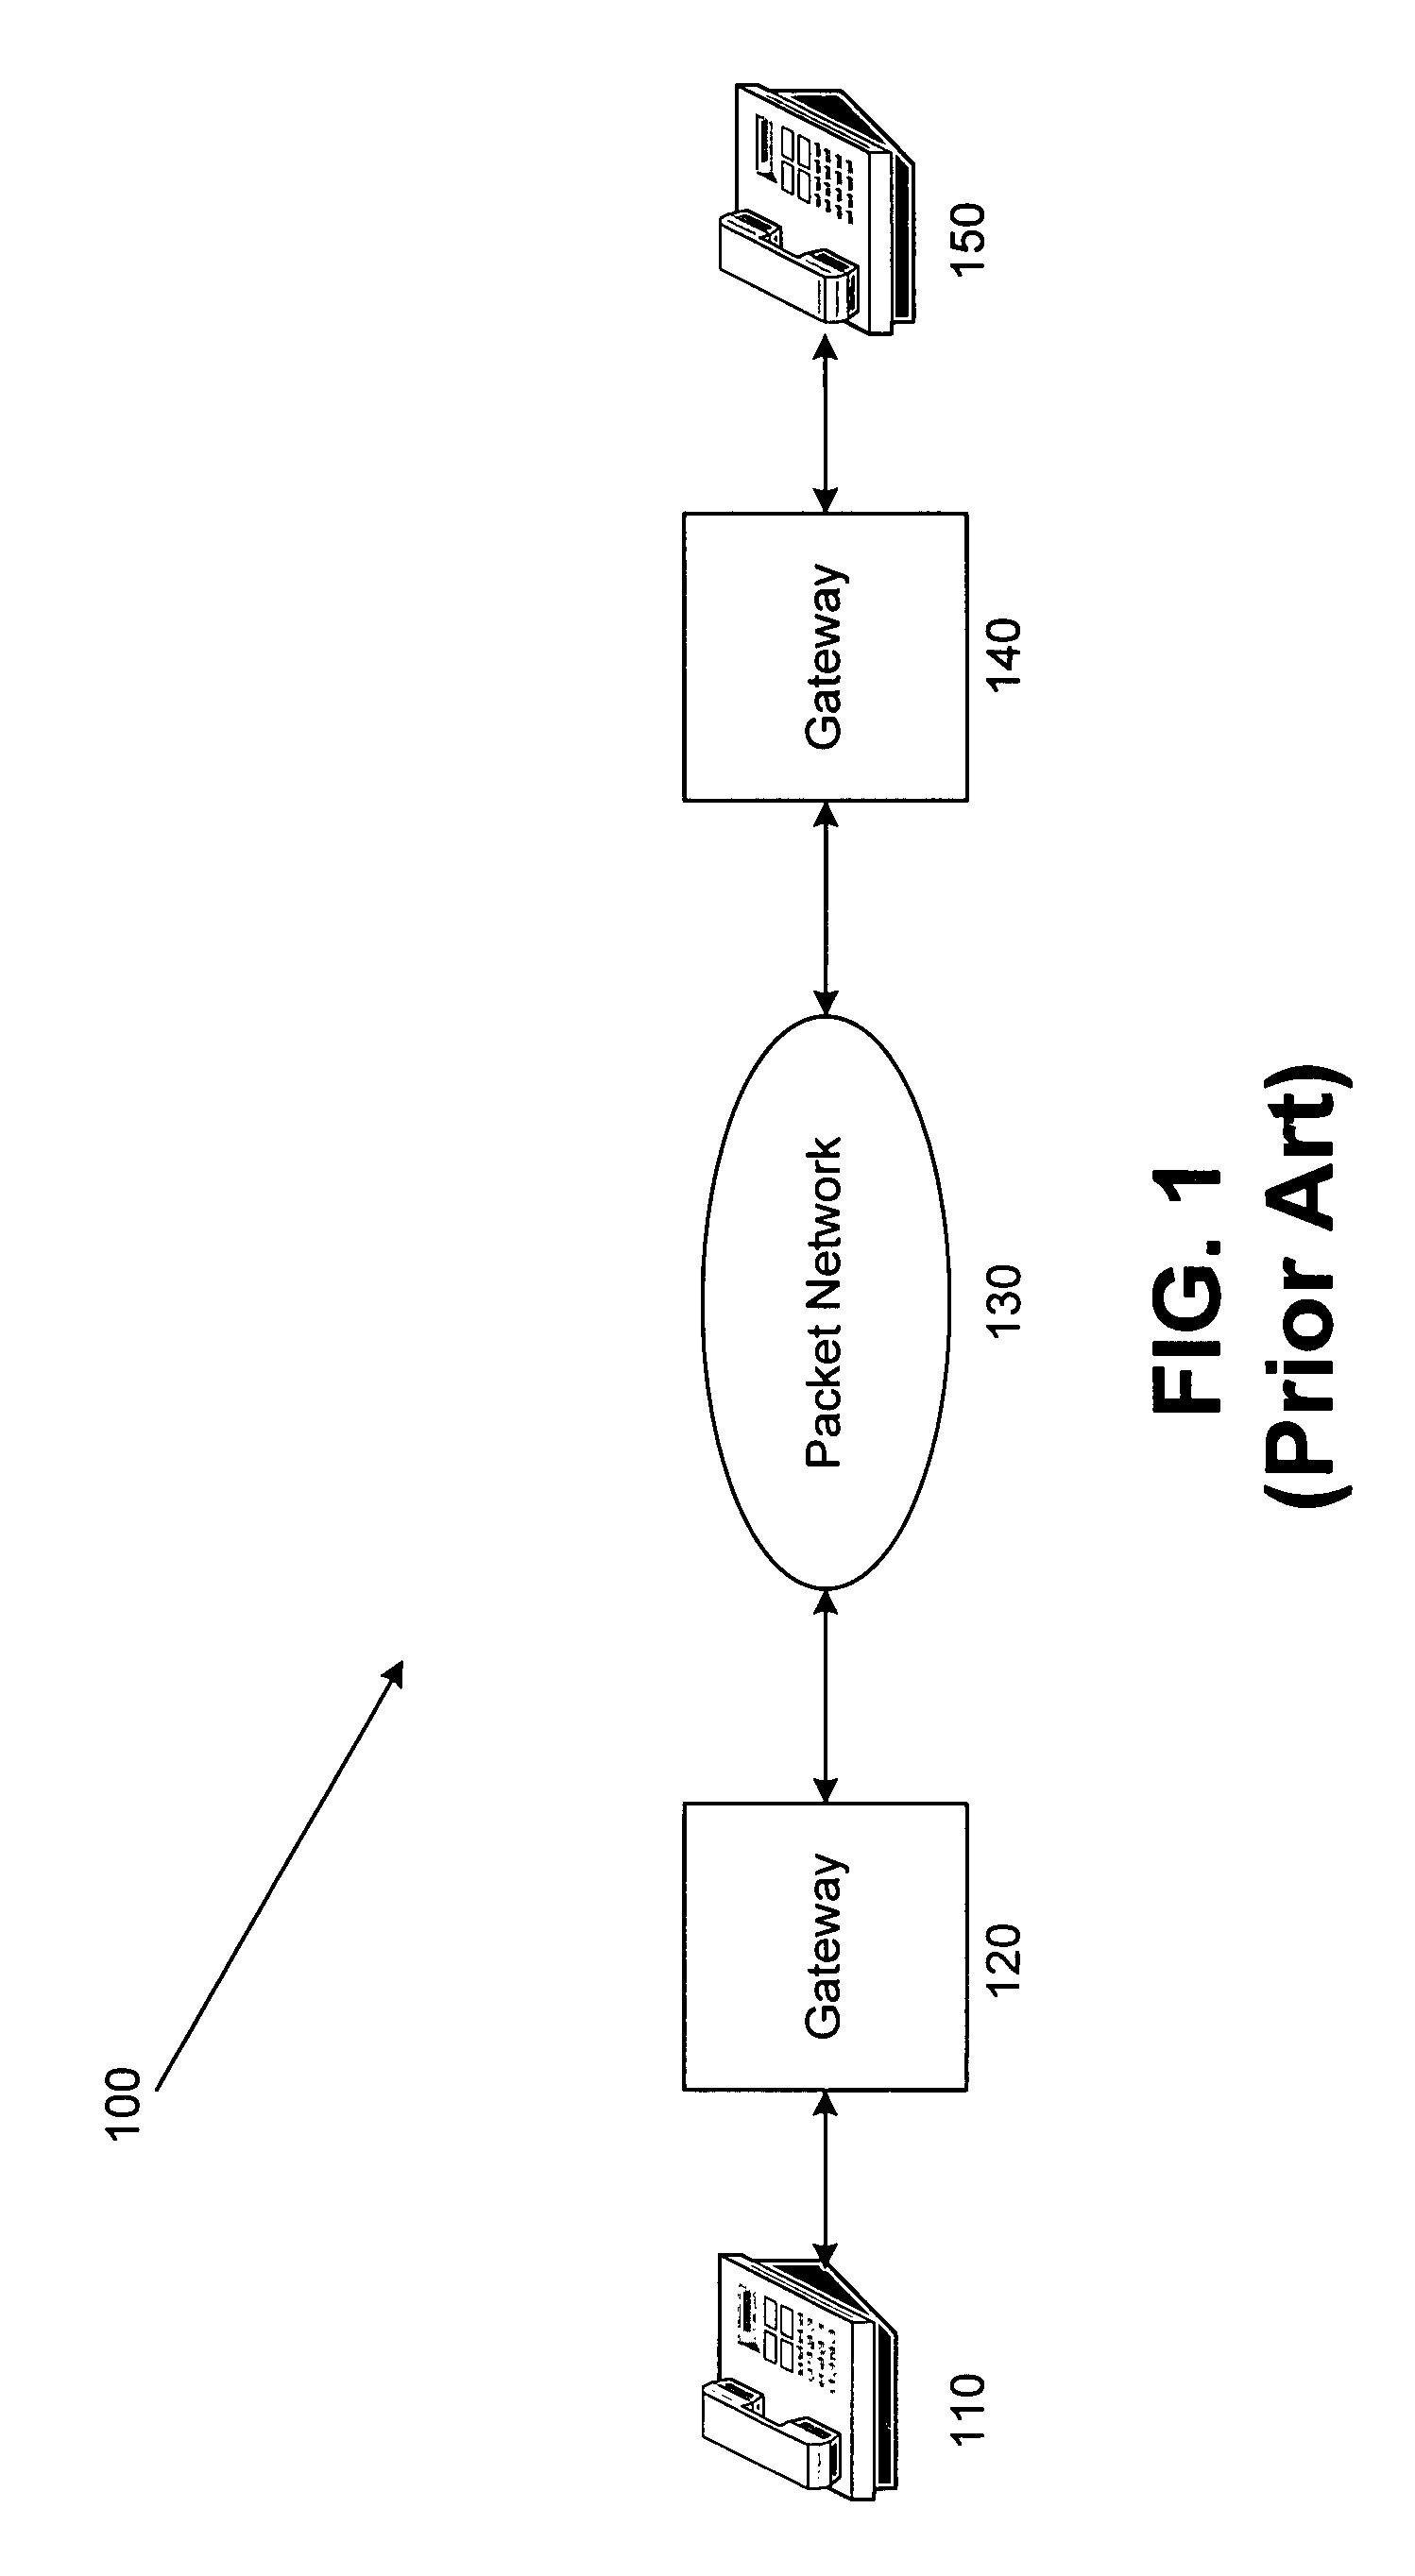
RELATED APPLICATIONS[0001]The present application is based on and claims priority to U.S. Provisional Application Ser. No. 60 / 772,363, filed Feb. 10, 2006, which is hereby incorporated by reference in its entirety.BACKGROUND OF THE INVENTION[0002]1. Field of the Invention[0003]The present invention relates to assessing voice quality in a telecommunication system.[0004]2. Related Art[0005]Modern telecommunication systems, including VoIP networks, use a multitude of telecommunication technologies, which include packetization, echo cancellation, speech coding, noise reduction, automatic gain control (AGC), voice activity detection (VAD), comfort noise generation (CNG), packet loss control (PLC), jitter buffers, etc. All of these technologies contribute significantly to the degradation of the transmitted voice signal over VoIP networks, and consequently, to conversational quality.[0006]FIG. 1 illustrates conventional telecommunication system 100 utilizing packet network 130. As shown, t...

Claims


Application Information

Patent Timeline
Patent Type & Authority Patents(United States)
IPC IPC(8): H04L12/26H04L12/66
CPCH04M3/2236H04M7/1205H04L65/80H04L43/0864H04L65/752
Inventor GOPAL, HUNDRAJ S.ZAD-ISSA, MOHAMMAD REZACHU, KEITH T.
Owner MINDSPEED TECH INC
Why Eureka
Try Eureka