SEM imaging method

a scanning electron microscopy and sample technology, applied in material analysis using wave/particle radiation, instruments, nuclear engineering, etc., can solve the problems of inability to perform inter-image contrast adjustment (key step), prior applications of this technique have tended to limit themselves, and the known technique has not yet been successfully applied in life sciences investigations

Active Publication Date: 2012-07-31
FEI CO
View PDF28 Cites 61 Cited by
  • Summary
  • Abstract
  • Description
  • Claims
  • Application Information

AI Technical Summary

Problems solved by technology

A drawback of such known approaches is that said inter-image contrast adjustment (which is a key step) can only be performed using knowledge about the composition and geometry of the sample.
Consequently, prior applications of this technique have tended to limit themselves to wafer defect inspection and other semiconductor applications, in which there is generally good a priori knowledge of the sample's (default) composition and geometry.
Since the required compositional and geometrical information is typically not available for biological samples, the known technique has not yet been successfully applied to investigations in the life sciences.

Method used


Image

  • SEM imaging method
  • SEM imaging method
  • SEM imaging method

Examples


embodiment 1

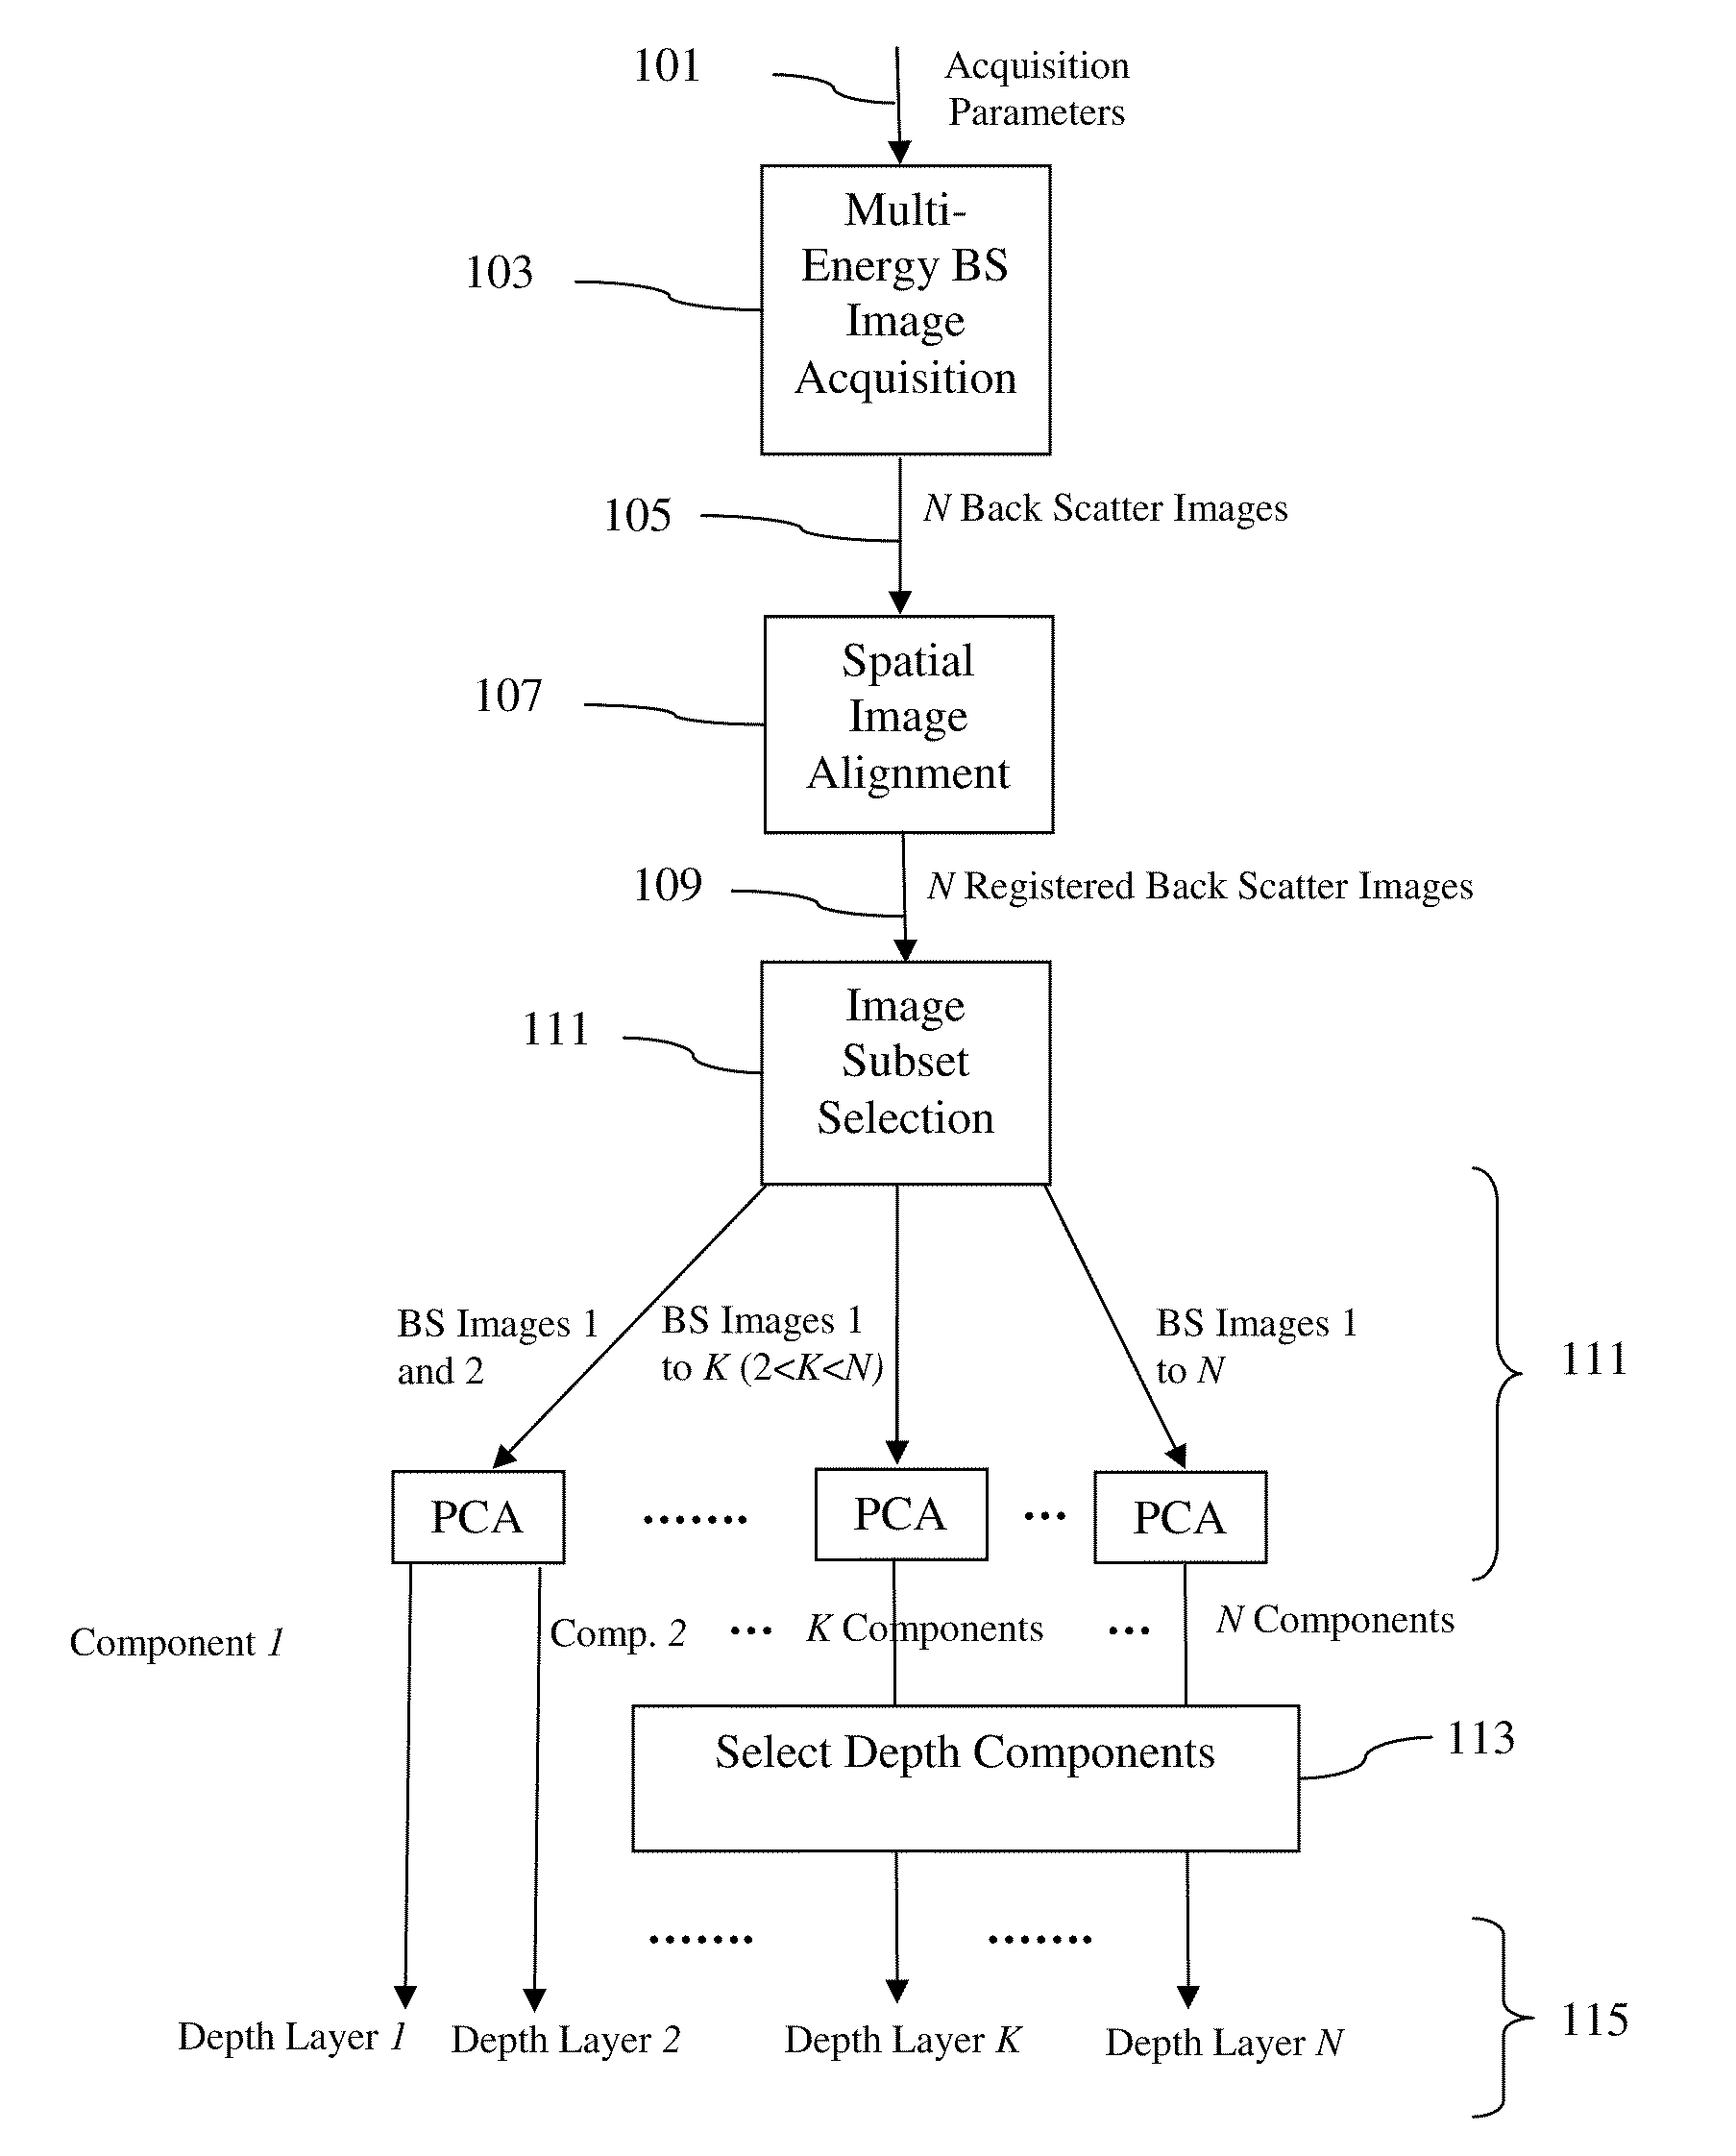
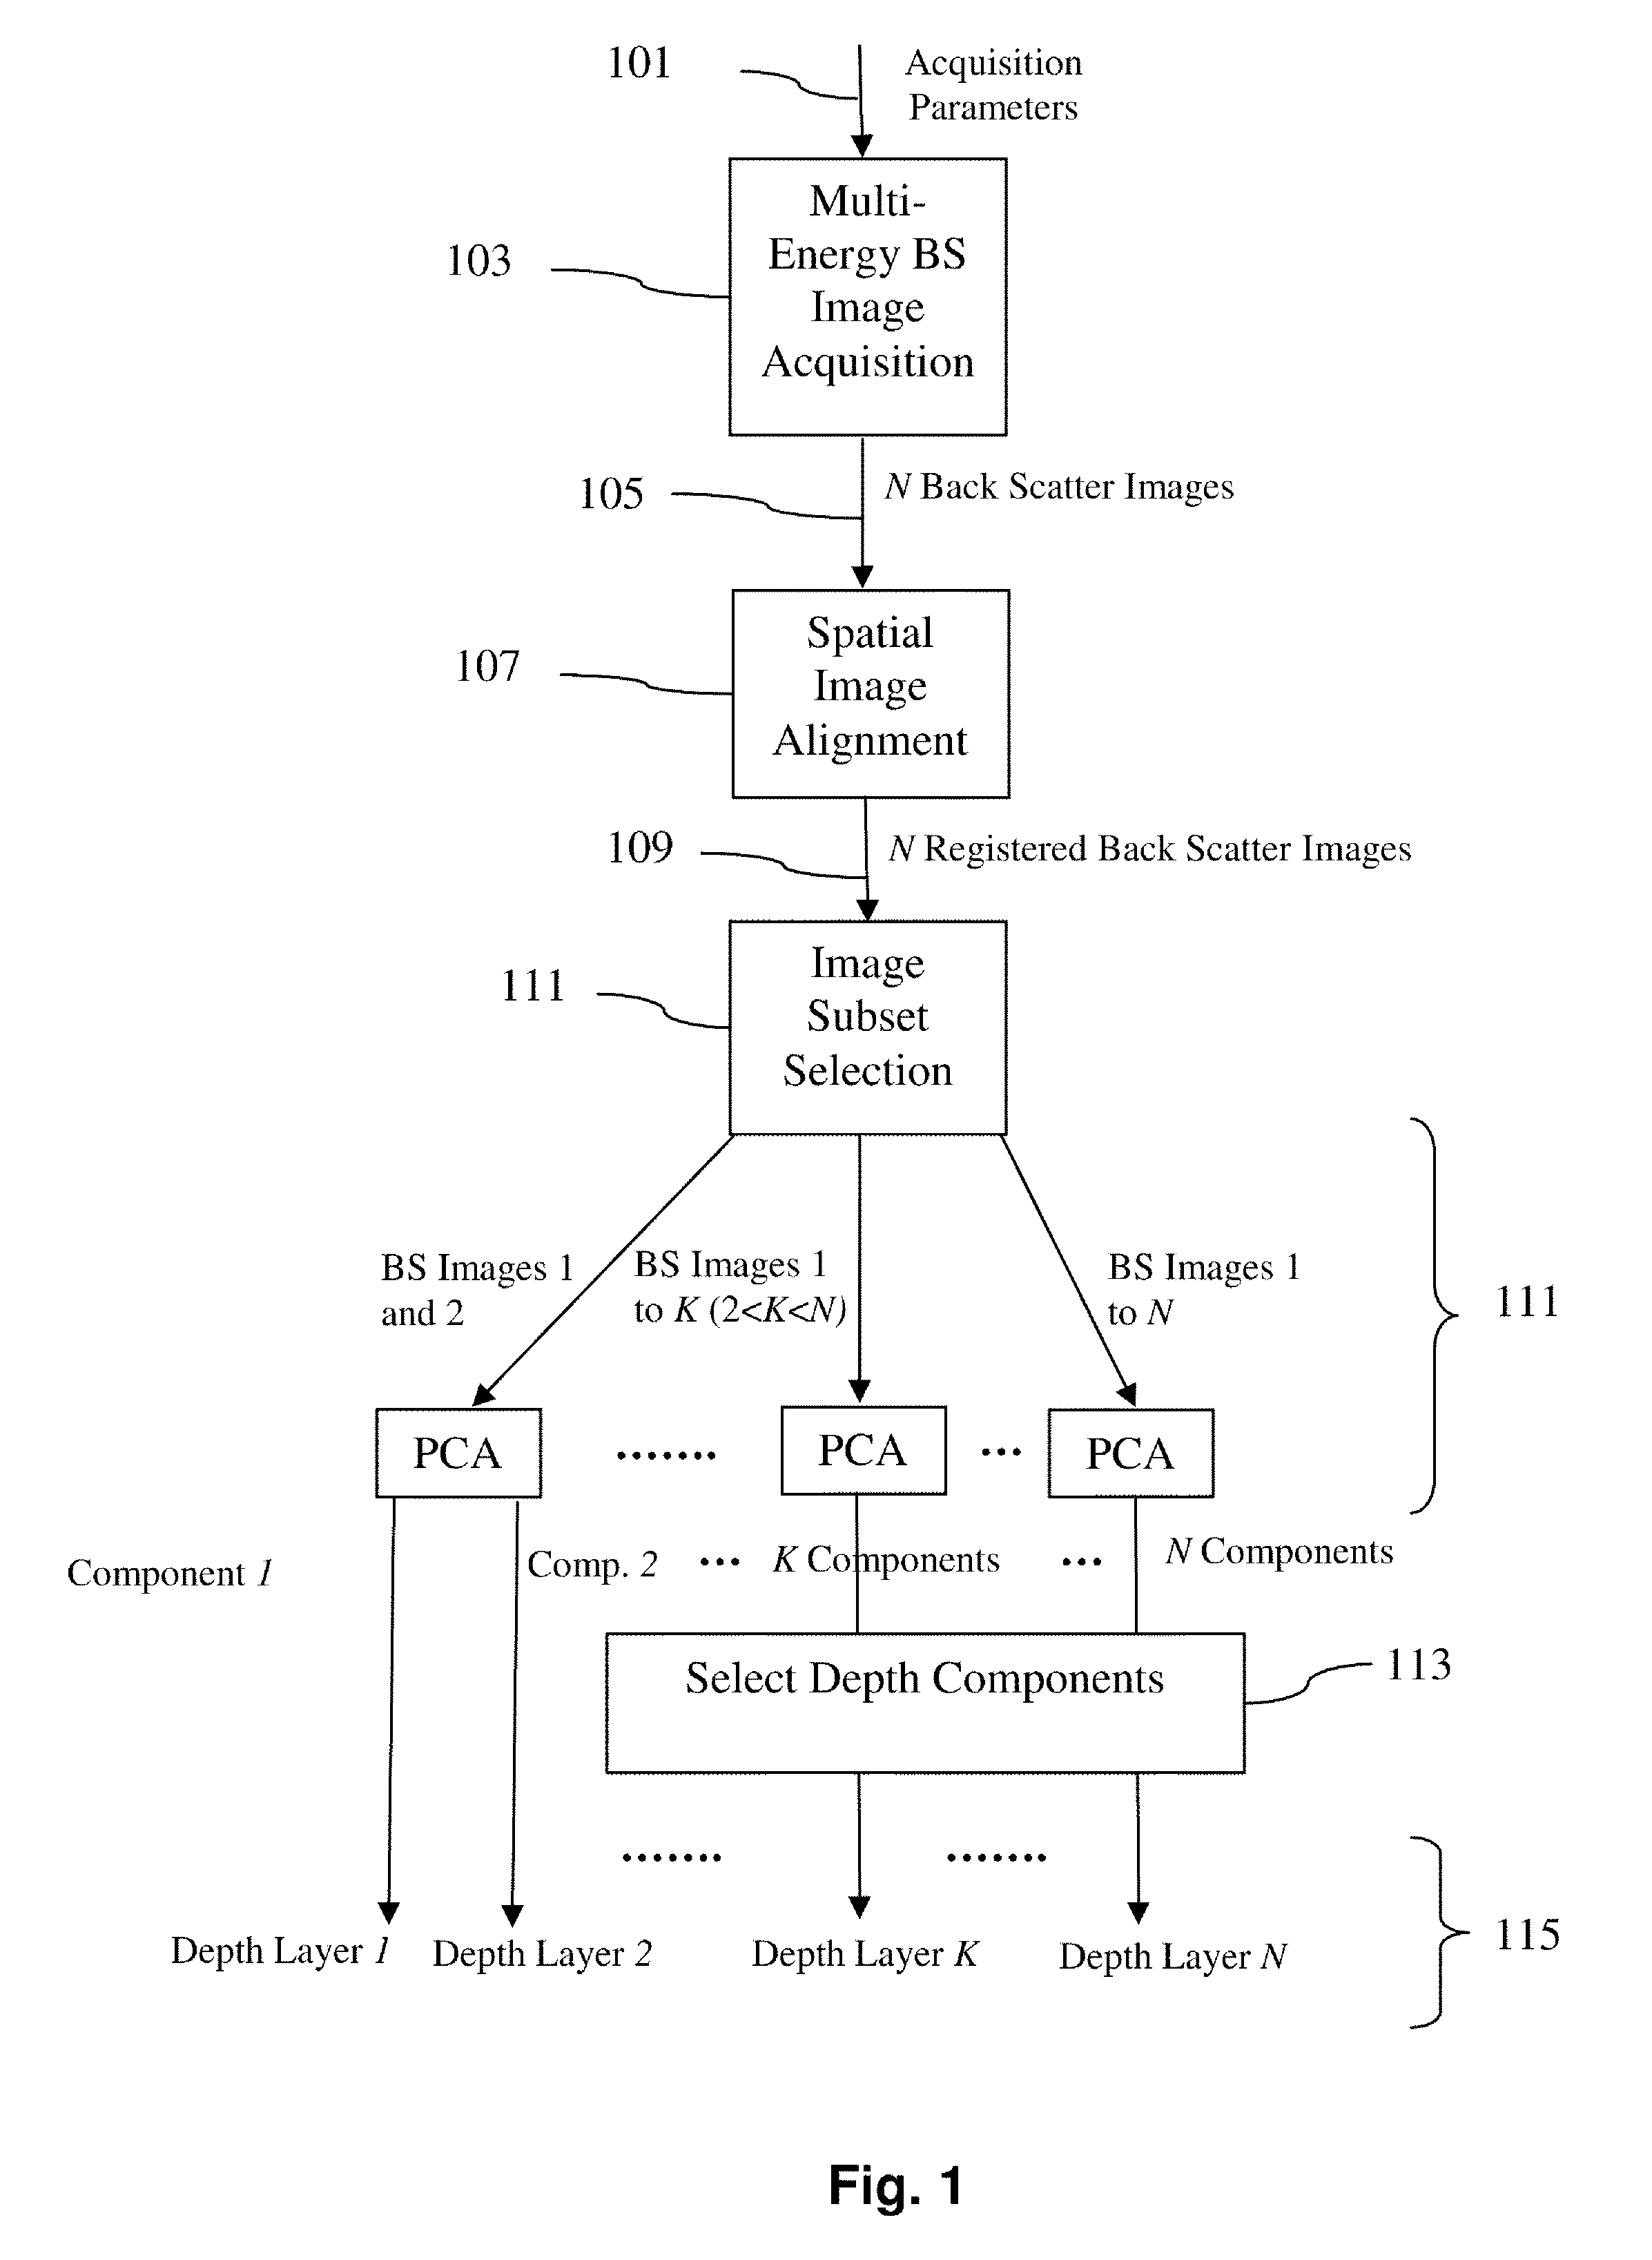
[0059]FIG. 1 shows a flowchart of an embodiment of a SEM-based 3D volume imaging method according to the present invention. The various steps in this flowchart can be further elucidated as follows:[0060]101: Acquisition parameters are decided upon. Here, one makes selections as regards N (number of measurement sessions), P (beam parameter to be varied between measurement sessions), ΔP (size of increment in P between measurement sessions), the stimulated radiation to be detected, and M (which measurand of the stimulated radiation is to be measured). For example, one may choose N=7, P=landing energy, ΔP=100 eV, stimulated radiation=BS electrons, M=BS electron current.[0061]103: On the basis of the parameters selected in step 101, a set of BS images is acquired. These images represent convoluted data as regards depth information in the sample under investigation.[0062]105: The N acquired BS images form a raw data set.[0063]107: The elements of the data set are laterally aligned and / or ...

embodiment 2

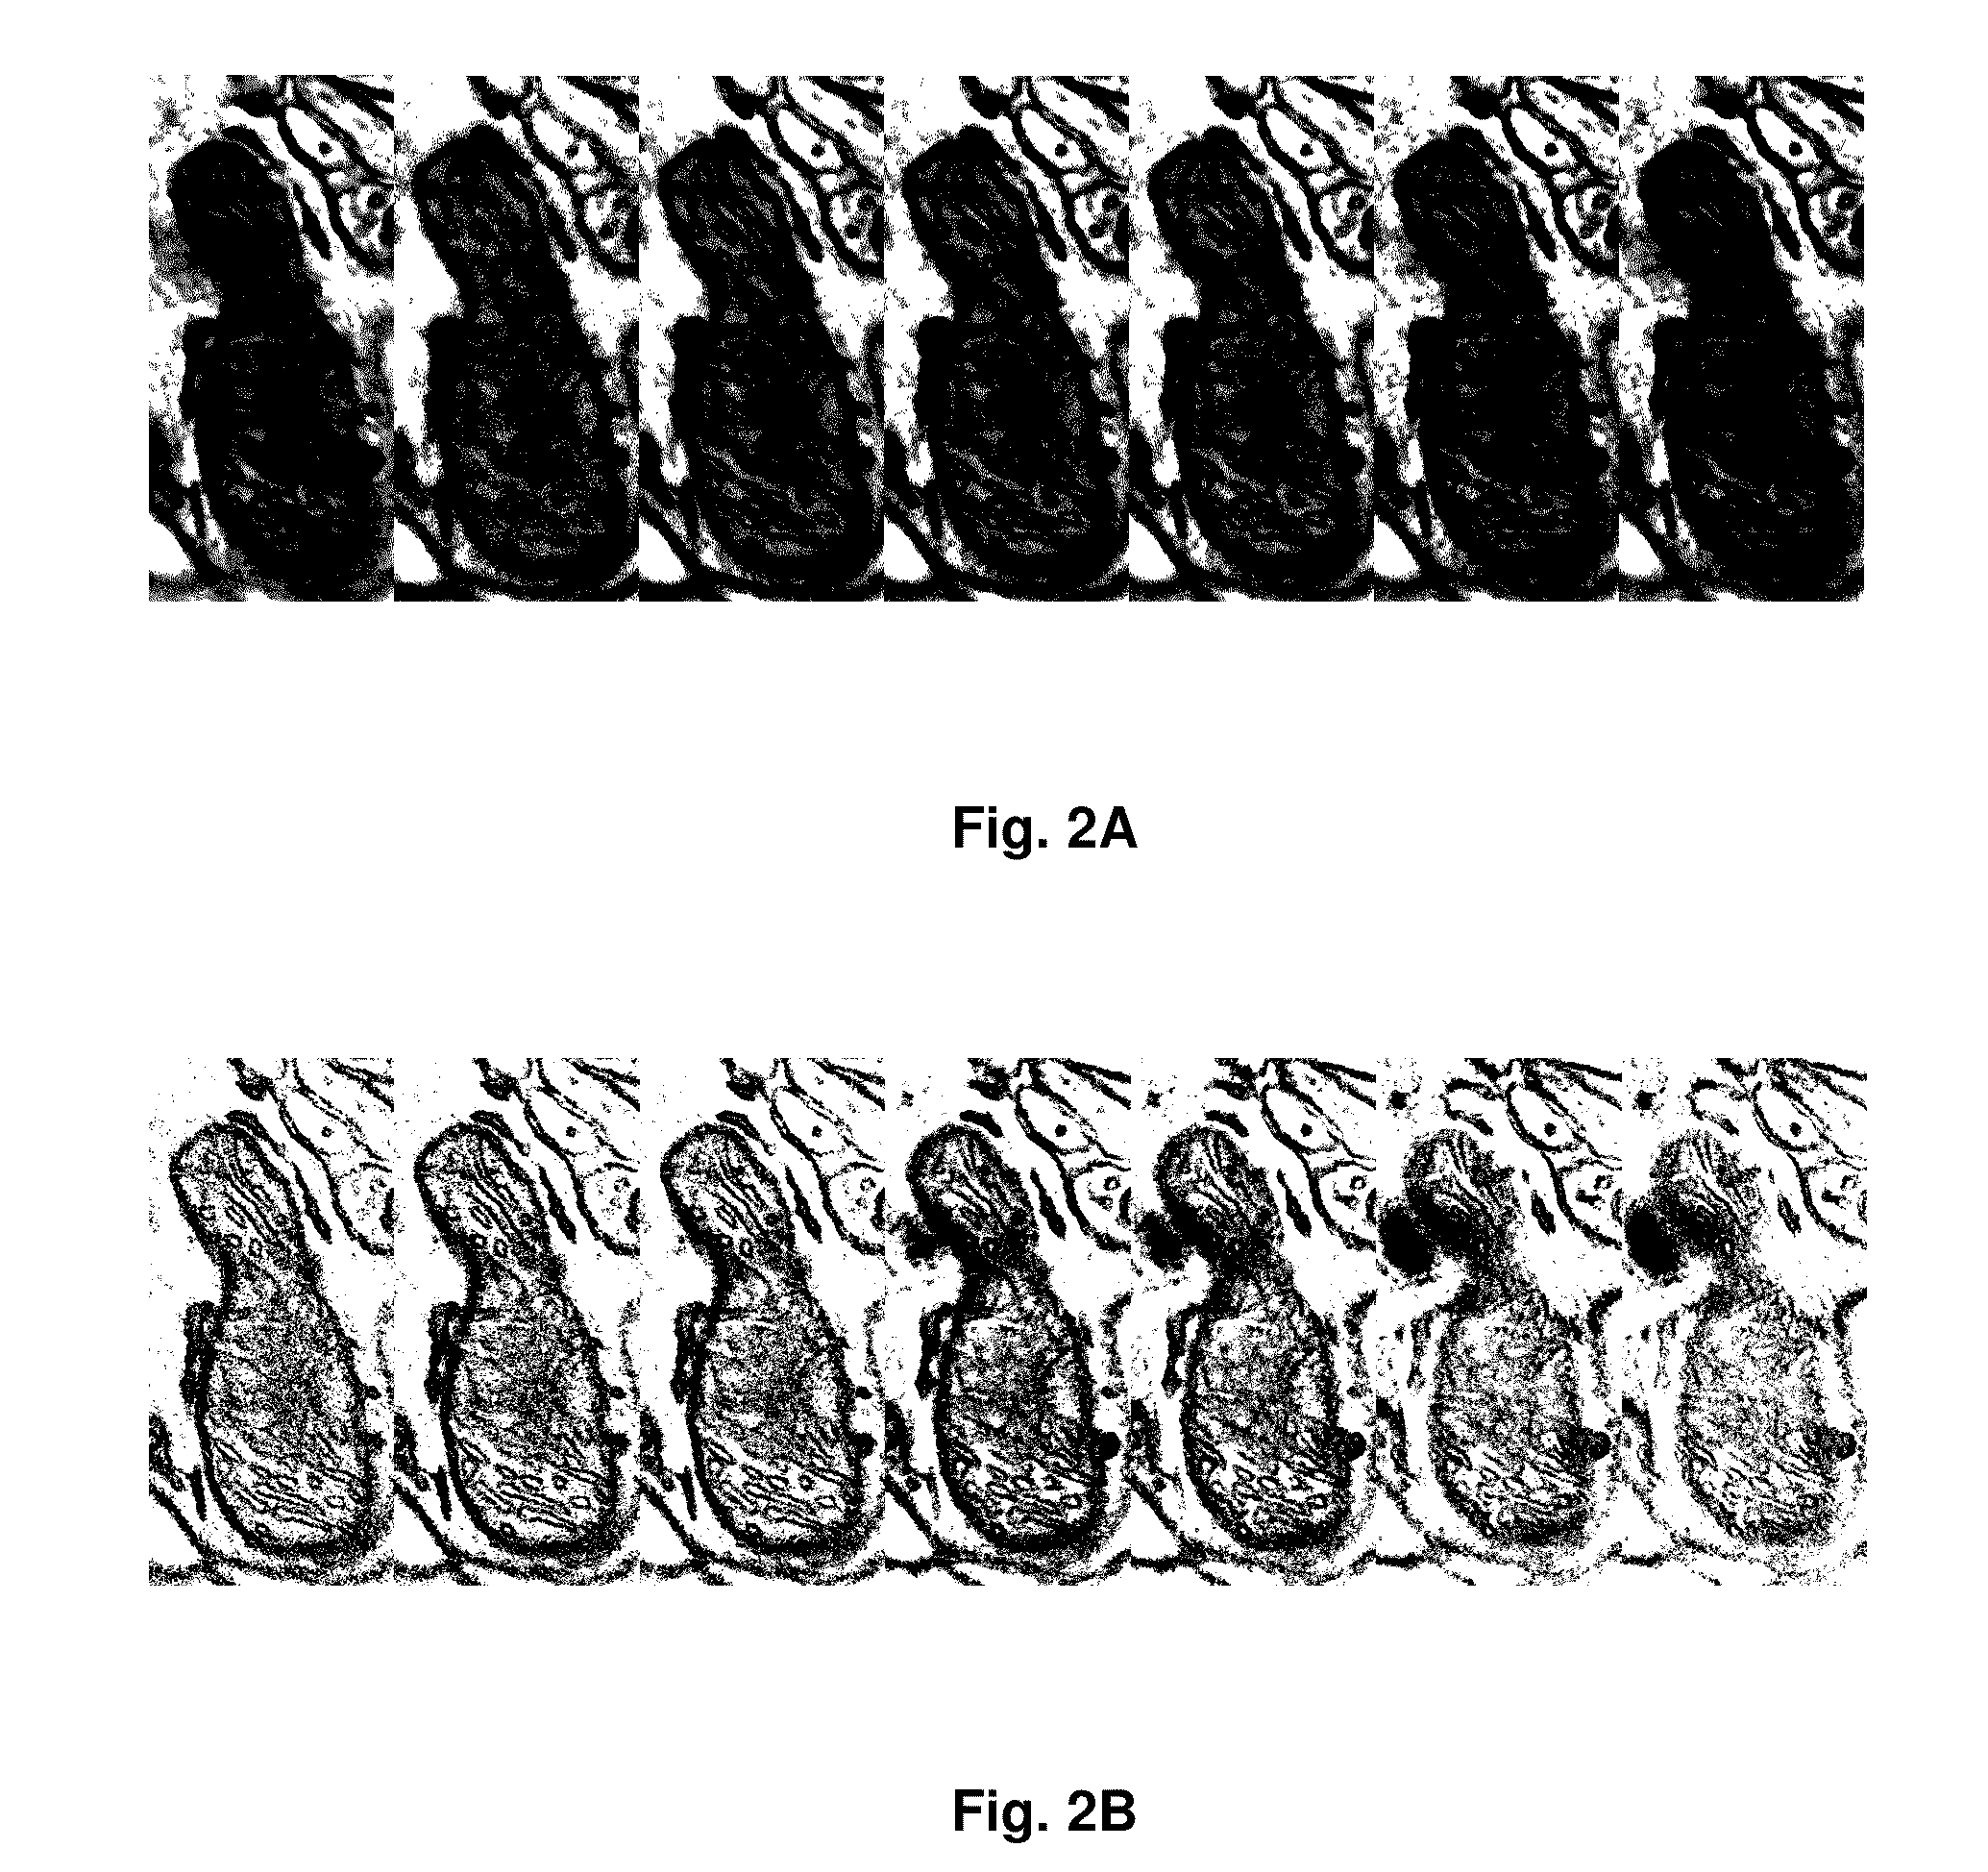
[0069]FIGS. 2A and 2B show results of SEM-based 3D slicing into progressively deeper layers of a stained biological sample (in this particular case, a brain cell of a mouse). In both cases, the sample was irradiated at progressively higher energies—in the range 700 eV to 1900 eV, in 200 eV increments—and BS electrons emanating from the irradiated sample were detected. The results are illustrated as follows:[0070]FIG. 2A shows the BS image sequence of a mitochondrion in the sample, without any attempt at de-convolution of detected data.[0071]FIG. 2B shows a corresponding image sequence after application of a method according to the present invention, representing de-convolved, depth-resolved images of the same mitochondrion, and revealing 3D structures not (clearly) visible in FIG. 2A.

embodiment 3

[0072]The linearity assumptions in image formation elucidated above can be represented in the model:

Q=AI  (1)

in which:[0073]I=(I1, I2, . . . , IN)T is the set of images acquired by varying beam parameters;[0074]Q=(Q1, Q2, . . . , QN)T is a set of source images that are statistically de-correlated and that represent information coming from different depth layers (levels);[0075]A=(a1, a2, . . . , aN)T is a square matrix transforming the original images into so-called principal components.

[0076]PCA decomposition obtains the factorization in equation (1) by finding a set of orthogonal components, starting with a search for the one with the highest variance.

The first step consists in minimizing the criterion:

[0077]a1=arg⁢⁢maxa=1⁢⁢E⁢{(aT⁢I)2}(2)

[0078]The next step is to subtract the found component from the original images, and to find the next layer with highest variance.

At iteration 1

[0079]ak=arg⁢⁢maxa=1⁢⁢E⁢{(aT⁡(I-∑i=1k-1⁢wi⁢wiT⁢I))2...


PUM

PropertyMeasurementUnit
landing energyaaaaaaaaaa
thicknessaaaaaaaaaa
Scanning Electron Microscopyaaaaaaaaaa

Abstract

A method of investigating a sample using Scanning Electron Microscopy (SEM), comprising the following steps:Irradiating a surface (S) of the sample using a probing electron beam in a plurality (N) of measurement sessions, each measurement session having an associated beam parameter (P) value that is chosen from a range of such values and that differs between measurement sessions;Detecting stimulated radiation emitted by the sample during each measurement session, associating a measurand (M) therewith and noting the value of this measurand for each measurement session, thus allowing compilation of a data set (D) of data pairs (Pi, Mi), where 1≦i≦N,wherein:A statistical Blind Source Separation (BSS) technique is employed to automatically process the data set (D) and spatially resolve it into a result set (R) of imaging pairs (Qk, Lk), in which an imaging quantity (Q) having value Qk is associated with a discrete depth level Lk referenced to the surface S.

Description

[0001]This application claims priority from U.S. Provisional Pat. App. 61 / 394,971, filed Oct. 20, 2010, which is hereby incorporated by reference.TECHNICAL FIELD OF THE INVENTION[0002]The invention relates to a method of investigating a sample using Scanning Electron Microscopy (SEM), comprising the following steps:[0003]Irradiating a surface (S) of the sample using a probing electron beam in a plurality (N) of measurement sessions, each measurement session having an associated beam parameter (P) value that is chosen from a range of such values and that differs between measurement sessions;[0004]Detecting stimulated radiation emitted by the sample during each measurement session, associating a measurand (M) therewith and noting the value of this measurand for each measurement session, thus allowing compilation of a data set (D) of data pairs (Pi, Mi), where 1≦i≦N.BACKGROUND OF THE INVENTION[0005]A method as set forth in the opening paragraph is known from U.S. Pat. No. 5,412,210, an...

Claims


Application Information

Patent Timeline
Patent Type & Authority Patents(United States)
IPC IPC(8): G01N23/00G21K7/00
CPCH01J37/222H01J37/28H01J2237/226H01J2237/2611
Inventor BOUGHORBEL, FAYSALKOOIJMAN, CORNELIS SANDERLICH, BEREND HELMERUSBOSCH, ERIC GERARDUS THEODOOR
Owner FEI CO
Why Eureka
Try Eureka