In vitro analyte sensor, and methods
a technology of analyte sensor and sample chamber, applied in the field of electrochemical sensors, can solve the problems of increasing the difficulty of repeatedly manufacturing the small volume sample chamber, increasing the difficulty of accurately analyzing the sample amount, etc., and achieve the effect of accurate and repeatable analysis
- Summary
- Abstract
- Description
- Claims
- Application Information
AI Technical Summary
Benefits of technology
Problems solved by technology
Method used
Image
Examples
examples
[0110]The following examples are provided to show analyte sensors in accordance with the present invention. However, it will be understood that the following examples are exemplary only, and are in nowise comprehensive of the many different types of sensors which may be made in accordance with the present invention.
examples 1-4
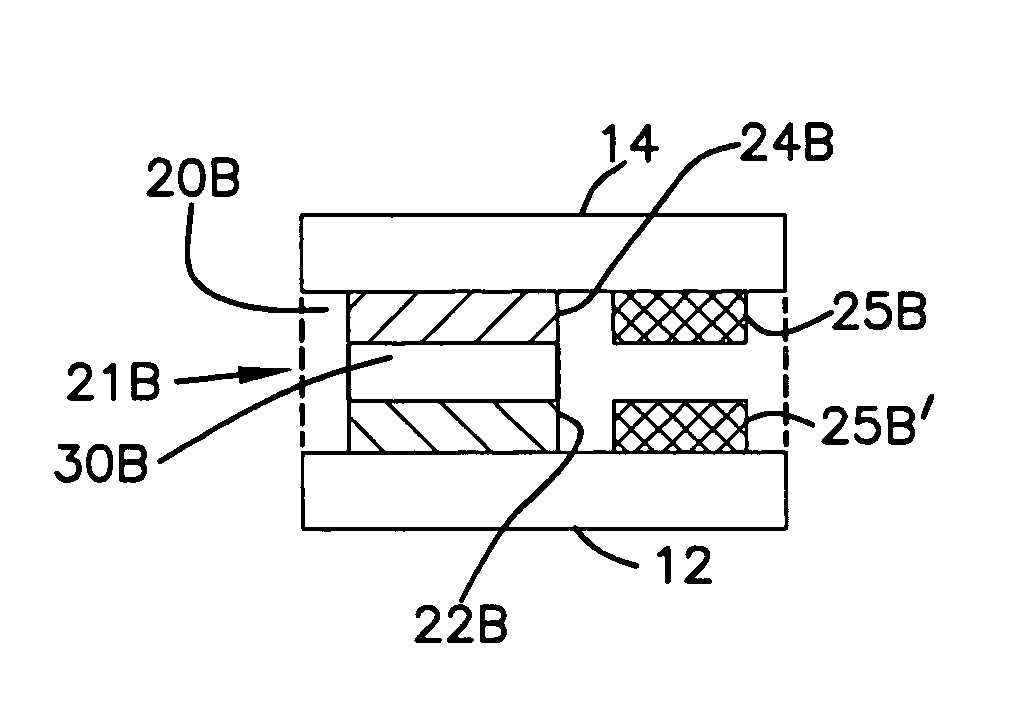
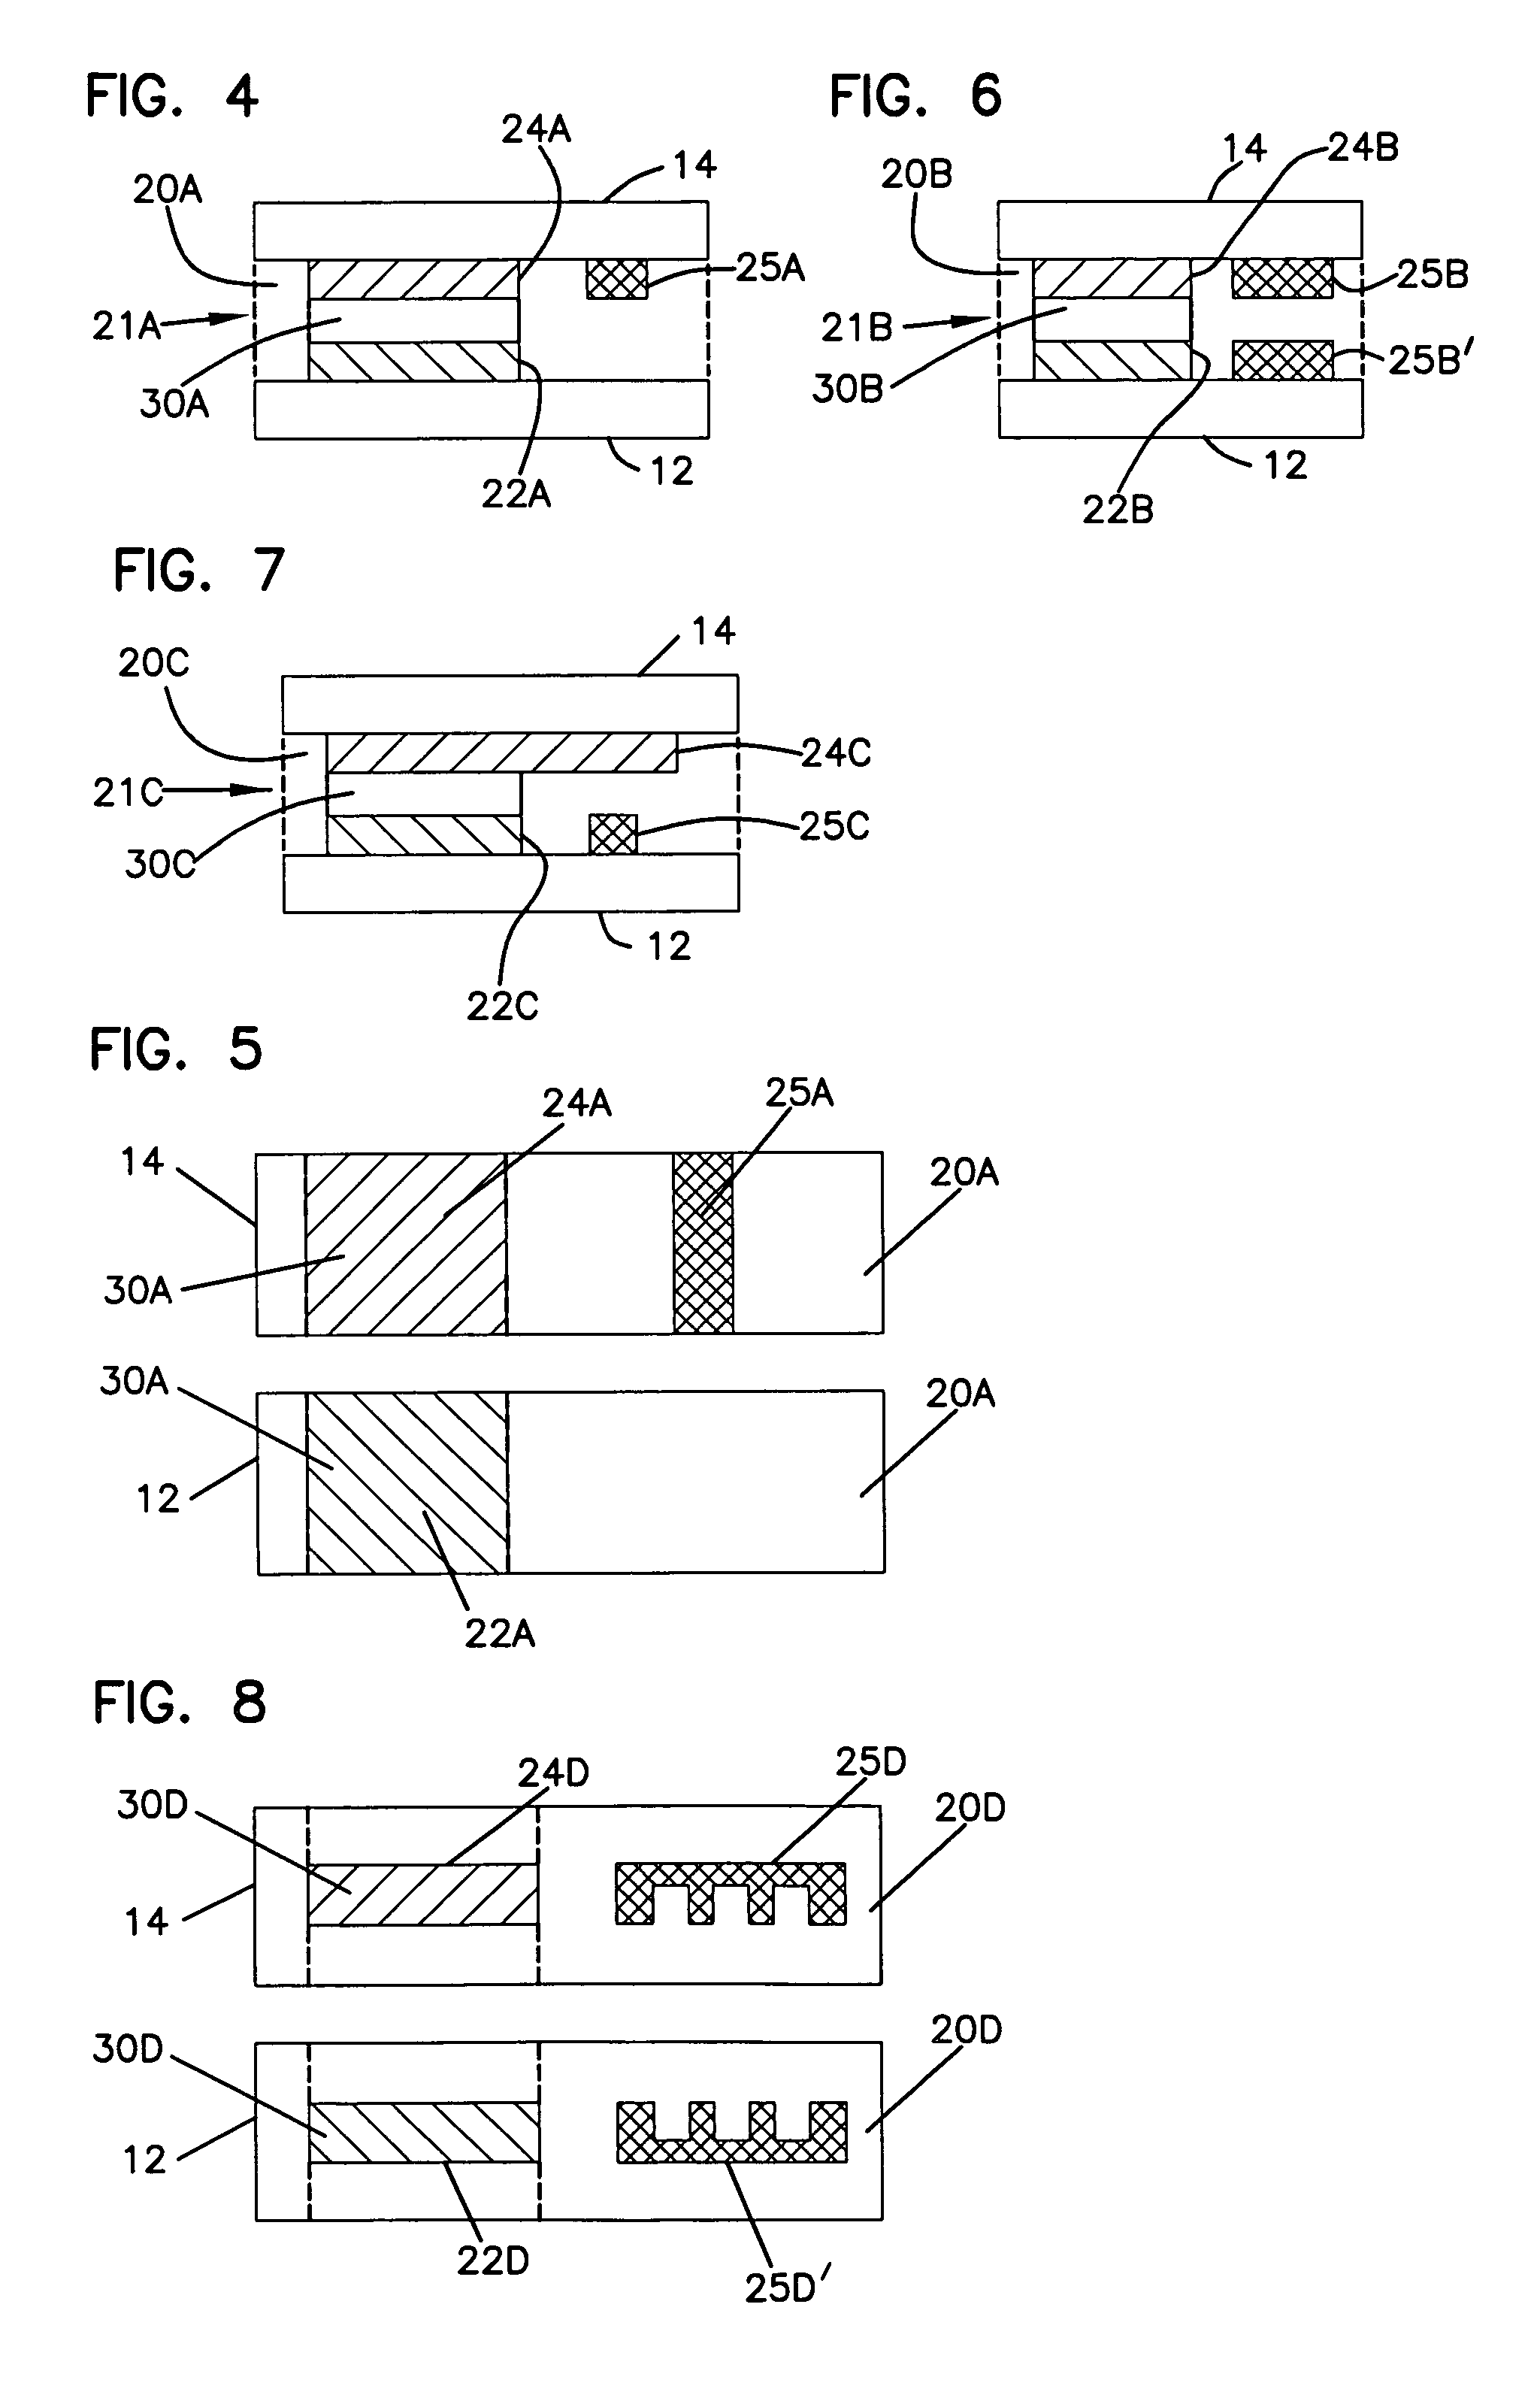
[0111]Analyte sensor strips were made with four different electrode axial lengths, similar to the layout illustrated in FIG. 6. For each of the examples, the transverse width and axial length of the sample chamber were 1 mm and 6 mm, respectively; the thickness between facing electrodes (i.e., the sample chamber and measurement zone thickness) was 0.05 mm; and the measurement zone axial length was varied from 1 mm, 2 mm, 3 mm to 4 mm. Thus, the chamber volume was 0.3 μL while the volume of the measurement zone was varied: 0.05 μL, 0.1 μL, 0.15 μL to 0.20 μL, respectively. The axial width of the measurement zone, along with the total volumes of the measurement zones, are provided below:
[0112]As a comparison, a separated sensor strip having both the chamber sample volume and measurement zone volume at 0.3 μL was built by extending the working electrode axial length to extend the entire chamber length.
[0113]
ExampleAxial LengthVolume11 mm (0.04 inch)0.05 μL22 mm (0.08 inch) 0.1 μL33 mm ...
examples 5-8
[0116]Four different analyte sensor strips and the comparison strip were constructed in the same configuration as in Examples 1-4. Blood samples from a single donor adjusted to different hematocrit levels (Hct, 20%, 40% and 60%) were tested. The results are shown in FIG. 10 with the standard deviation as error bars (n=8 / condition). The linear relationship was still present for the different blood samples tested. The correlation coefficient R2 of all three linear fittings is higher than 0.98 and the standard deviation of each test is <5%.
PUM
| Property | Measurement | Unit |
|---|---|---|
| volume | aaaaa | aaaaa |
| volume | aaaaa | aaaaa |
| volume | aaaaa | aaaaa |
Abstract
Description
Claims
Application Information
 - R&D
- Intellectual Property
- Life Sciences
- Materials
- Tech Scout
- Unparalleled Data Quality
- Higher Quality Content
- 60% Fewer Hallucinations
Browse by: Latest US Patents, China's latest patents, Technical Efficacy Thesaurus, Application Domain, Technology Topic, Popular Technical Reports.
© 2025 PatSnap. All rights reserved.Legal|Privacy policy|Modern Slavery Act Transparency Statement|Sitemap|About US| Contact US: help@patsnap.com


