Enterprise information security management software for prediction modeling with interactive graphs

a technology of information security management and prediction modeling, applied in the field of information systems, can solve problems such as lost business, identity theft, and even bankruptcy of the organization, and new product lines to fall into the hands of competitors

Inactive Publication Date: 2013-08-20
ALLGRESS
View PDF17 Cites 23 Cited by
  • Summary
  • Abstract
  • Description
  • Claims
  • Application Information

AI Technical Summary

Benefits of technology

[0009]Various baseline security measurements of assets are collected and calculated by the system. A user creates a what-if scenario by changing one or more baseline security measurements. The system generates interactive, animated graphs that compare the baseline security measurements against the what-if scenario. This allows the user to perform strategic security analysis and planning.
[0013]An information security (IT) security software application helps IT managers identify potential security risks in a system. This system can be help assess and remedy network security, to prevent problems involving, for example, unwanted intrusions into the system, authentication failures, viruses, malwares, spoofing, theft of confidential data, denial-of-service attacks, shutting down the network, degrading the network, or other network attacks. For example, sites such as Amazon and eBay run businesses using the Internet. Every second that such a site is down or degraded impacts the amount of sales the company is doing. Further, there is confidential information associated with such sites so that if a user were to obtain a customer list or information like credit info or social security numbers, the sites' users might be subject to attack directly. Also, the sites would lose credibility with their customers on their ability to keep customer information confidential. Therefore, IT security software application is an important tool in managing, identifying, and mitigating network security risks.
[0015]In an implementation, an information technology (IT) security software application permits performing what-if analysis based on factors including current risk analysis and future activities. Given current risk analysis data (from historical or current data), the user inputs future budgets and information about future activities such as expansion into other location, new offices, closing of offices, new software or hardware being deployed, more money being allocated to one location, less money being allocated at another location, and other future factors. This future activities information can be entered into the system as numerical info and given a date. For example, the expected budget for a San Francisco office for each month of a future year can be entered into the system. The IT security will provide charts, reports, and graphs showing and reflecting the potential changes in security risks, costs, vulnerabilities, controls, and others. Many different future inputs are provided to the what-if system (possibly from many different users or many different sources), the system's charts, reports, and graphs make it easier for a user to comprehend the vast amount of input data and to identify potential future security problems (such as seeing changes in an animated graph over time). Based on the what-if analysis, the IT security manager can effect changes to prevent or mitigate the potential future security problems.
[0016]Another feature of the module is reporting. An animated report shows risk by business unit or organization and how it changes over time (e.g., trending). In an implementation, an information technology (IT) security software application includes graphics that are animated. An animated graph can includes “play” or “start” button, a “pause” button, and a “stop button.” For example, once the play button is indicated, the elements of a graph will move on the computer screen (e.g., tails may be shown or not shown), without further interaction by the user. The user can stop or pause the animated elements. Other controls may include forward, rewind, and multiple speeds for forward and rewind. The graph may also have a timeline, which has an indicator to show at what particular point in time the graph is at. The animated graphs show trends in the quantities of information (e.g., including information about future activities) in a easier to understand format, and make identifying potential future security problems easier. Colors can be used in the animated graphs to highlight features, such as potential problems. Based on the animated changes, an IT security manager can effect changes to prevent or mitigate the potential future security problems.

Problems solved by technology

Security breaches could allow new product lines to fall into the hands of competitors, lost business, law suits, identity theft, and even bankruptcy of the organization.
This can be a very difficult and expensive process.

Method used


Image

  • Enterprise information security management software for prediction modeling with interactive graphs
  • Enterprise information security management software for prediction modeling with interactive graphs
  • Enterprise information security management software for prediction modeling with interactive graphs

Examples


Embodiment Construction

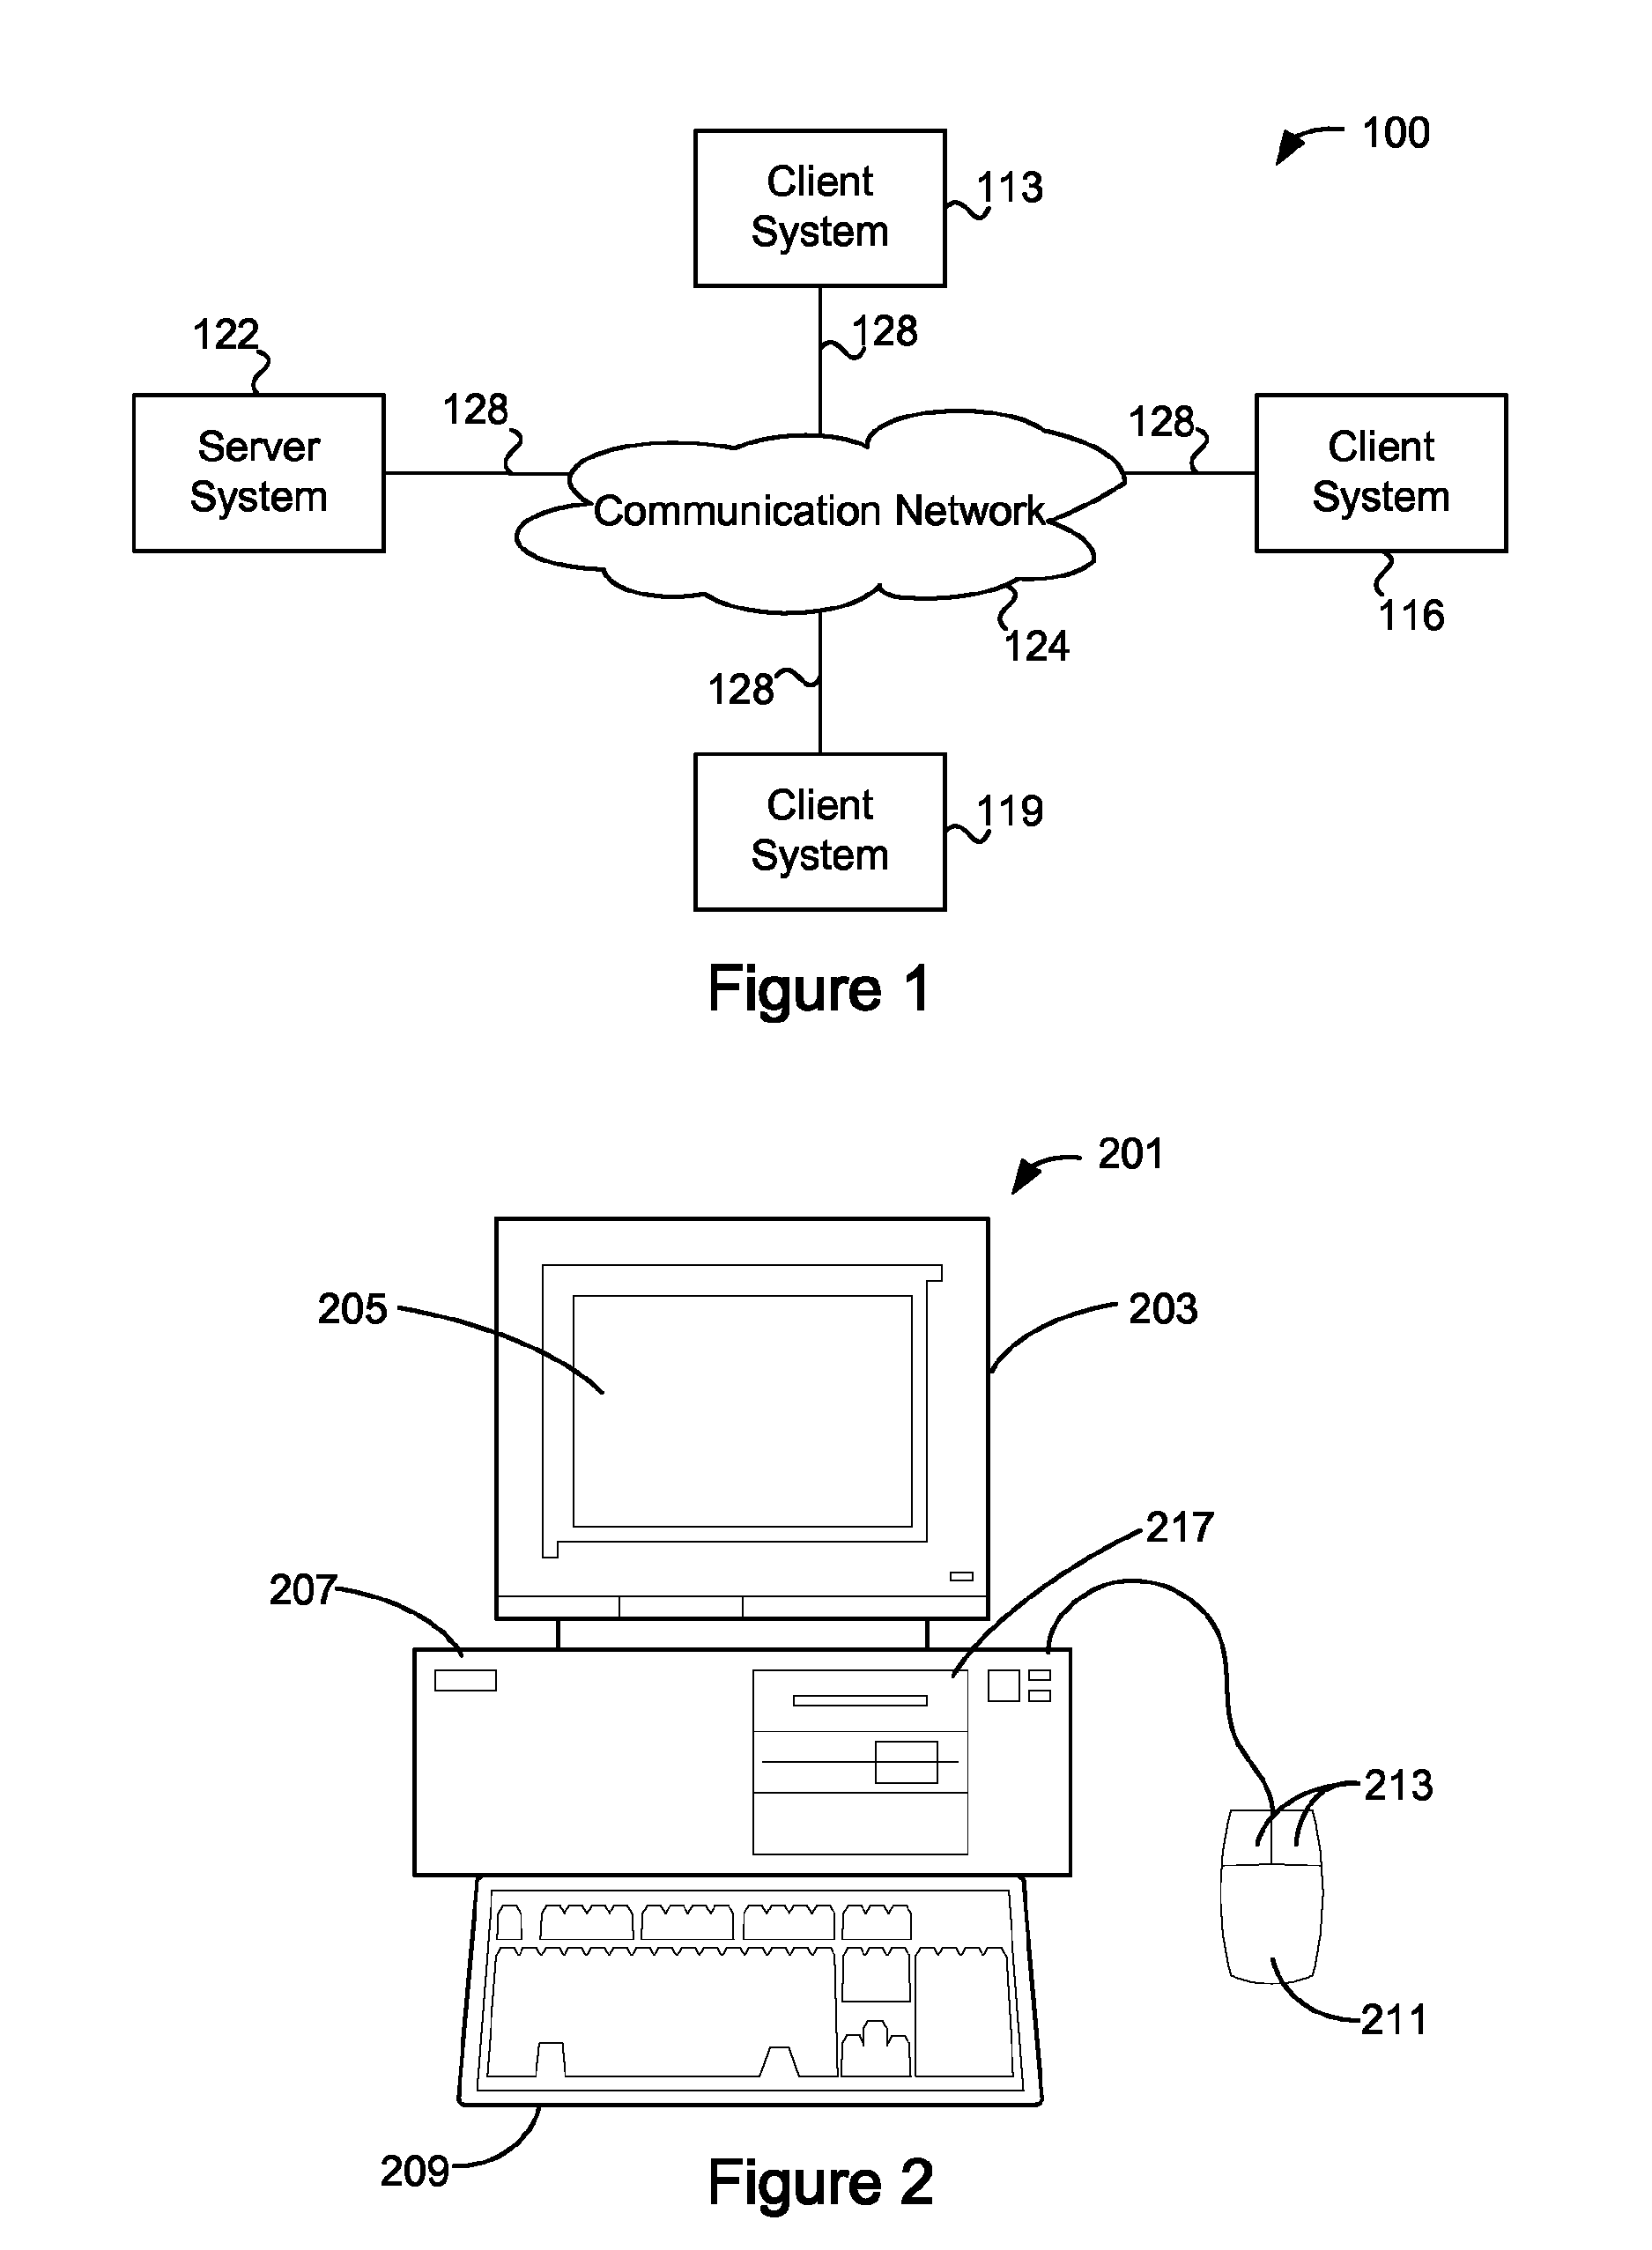
[0046]FIG. 1 is a simplified block diagram of a distributed computer network 100 incorporating an embodiment of the present invention. Computer network 100 includes a number of client systems 113, 116, and 119, and a server system 122 coupled to a communication network 124 via a plurality of communication links 128. Communication network 124 provides a mechanism for allowing the various components of distributed network 100 to communicate and exchange information with each other.

[0047]Communication network 124 may itself be comprised of many interconnected computer systems and communication links. Communication links 128 may be hardwire links, optical links, satellite or other wireless communications links, wave propagation links, or any other mechanisms for communication of information. Various communication protocols may be used to facilitate communication between the various systems shown in FIG. 1. These communication protocols may include TCP / IP, HTTP protocols, wireless applic...


PUM


Abstract

Various baseline security measurements of assets are collected and calculated by the system. A user creates a what-if scenario by changing one or more baseline security measurements. The system generates interactive, animated graphs that compare the baseline security measurements against the what-if scenario.

Description

CROSS-REFERENCE TO RELATED APPLICATIONS[0001]This patent application claims the benefit of U.S. provisional patent application 61 / 172,616, filed Apr. 24, 2009, which is incorporated by reference along with all other references cited in this application.BACKGROUND OF THE INVENTION[0002]This invention relates to the field of information systems, and more specifically to enterprise information security.[0003]Organizations and enterprises are essentially a collection of assets. An asset is anything that has value to an organization. Assets can range from data files to physical assets. Assets may also include intangibles such as an organization's reputation and the skill sets of its workforce.[0004]These assets include a great deal of information. In many cases, the information is confidential. The information may concern employees, customers, products, research, and financial status. The information may be stored on a variety of media including, for example, disk drives, floppy disks, m...

Claims


Application Information

Patent Timeline
Patent Type & Authority Patents(United States)
IPC IPC(8): G08B23/00
CPCG06F21/577G06T11/206G06T11/001
Inventor BENNETT, JEFFSTAGER, MIKESHEVLIN, GORDONTANG, WILLIAM
Owner ALLGRESS
Why Eureka
Try Eureka