Method and device for evaluating evolution of tumoural lesions

a tumour and evolution technology, applied in the field of methods and devices for evaluating the evolution of tumours, can solve the problems of losing residual hot spots, affecting so as to improve the prognosis of patients, reduce side effects, and shorten the hospital stay

Active Publication Date: 2014-04-29
DR K COENEGRACHTS
View PDF22 Cites 3 Cited by
  • Summary
  • Abstract
  • Description
  • Claims
  • Application Information

AI Technical Summary

Benefits of technology

[0024]Thus, the invention essentially segments tumoural lesions in concentric areas, e.g. 3D concentric rings or 3D concentric shapes that follow the perimeter of the tumour lesions, and compares corresponding concentric areas over time using functional parameters. As an example, the current invention may for instance divide a tumoural lesion in ten concentric compartments, each covering 10% concentric area of the tumour lesion. The quantitative comparison of functional parameters between corresponding concentric areas over time is thereafter represented in a simple-to-interpret graphical format, i.e. a two-dimensional or three-dimensional model of the tumoural lesions wherein the concentric areas are visualized. This approach is advantageous because the concentric areas are expected to globally follow the expected patterns within tumour lesions. The invention consequently provides a more detailed, quantitative analysis of the pathology when compared with traditional techniques based on averaging over the entire tumour region of interest. This is realized without increasing the need for user interaction and without the need for very advanced and time consuming algorithms. Since the concentric areas are expected to follow typical tumour evolution, the method according to the invention shall be able to quantify and visualize heterogeneity in tumour evolution without leaving the physician with the difficulty of interpreting scattery images that are pixel / voxel wise encoded.
[0083]The invention will also enable improvement of patient prognosis, a decrease of side-effects, shorter hospital stay and earlier return to the work environment. Merely morphologic criteria like for instance RECIST criteria, WHO criteria, volumetric criteria, etc., are inappropriate for the accurate monitoring of a therapy in oncologic patients. In many cases of regressive and progressive disease, the volume or diameter of tumoural lesions only changes late during treatment, definitely much later than functional parameters and laboratory values change. Further, e.g. in case of good response to therapy, volumes of tumoural lesions can even increase initially due do the cytotoxic edema. Also, anti-angiogenetic agents may not alter the volume of tumoural lesions in cases of complete response.

Problems solved by technology

The detection of such hot spots through improved image acquisition and post-processing is important because patients with residual hot spots are not tumour-free as a result of which their prognosis has not improved meaningfully.
Low resolution analysis averages the perfusion information resulting in loss of very high and very low values, thereby losing residual hot spots.
Such an approach results in loss of hot spots, and US 2003 / 0211036 fails to seek further improvements to this problem.
In summary, the method known from US 2003 / 0211036 recognizes but does not adequately solve the resolution problem.
As a result, residual malignant tumour cells that are therapy-resistant are not detected and efficient prognosis of therapy response by the physician remains difficult or impossible.
Although the article addresses the problem of whole tumour region-of-interest averaging, the article fails to teach a solution for improving the accuracy of evaluating tumour evolution through post-processing of temporal images.
Although automated, colour-coded voxel / pixel wise quantification of functional parameters allows follow-up of oncologic patients and enables evaluation of the presence respectively absence of response to therapy, the generated images are noisy and difficult to interpret by the physician.
Although these methods are quantitative, they may not show significant changes and definitely fail to quantify and visualize the heterogeneity of the tumour evolution, leaving for instance residual hot spots invisible for the physician.
These techniques generally fail to provide quantitative output, and the produced images are difficult to interpret rapidly and accurately by physicians as a result of which they are of poor value for clinical practice.

Method used


Image

  • Method and device for evaluating evolution of tumoural lesions
  • Method and device for evaluating evolution of tumoural lesions
  • Method and device for evaluating evolution of tumoural lesions

Examples


Embodiment Construction

)

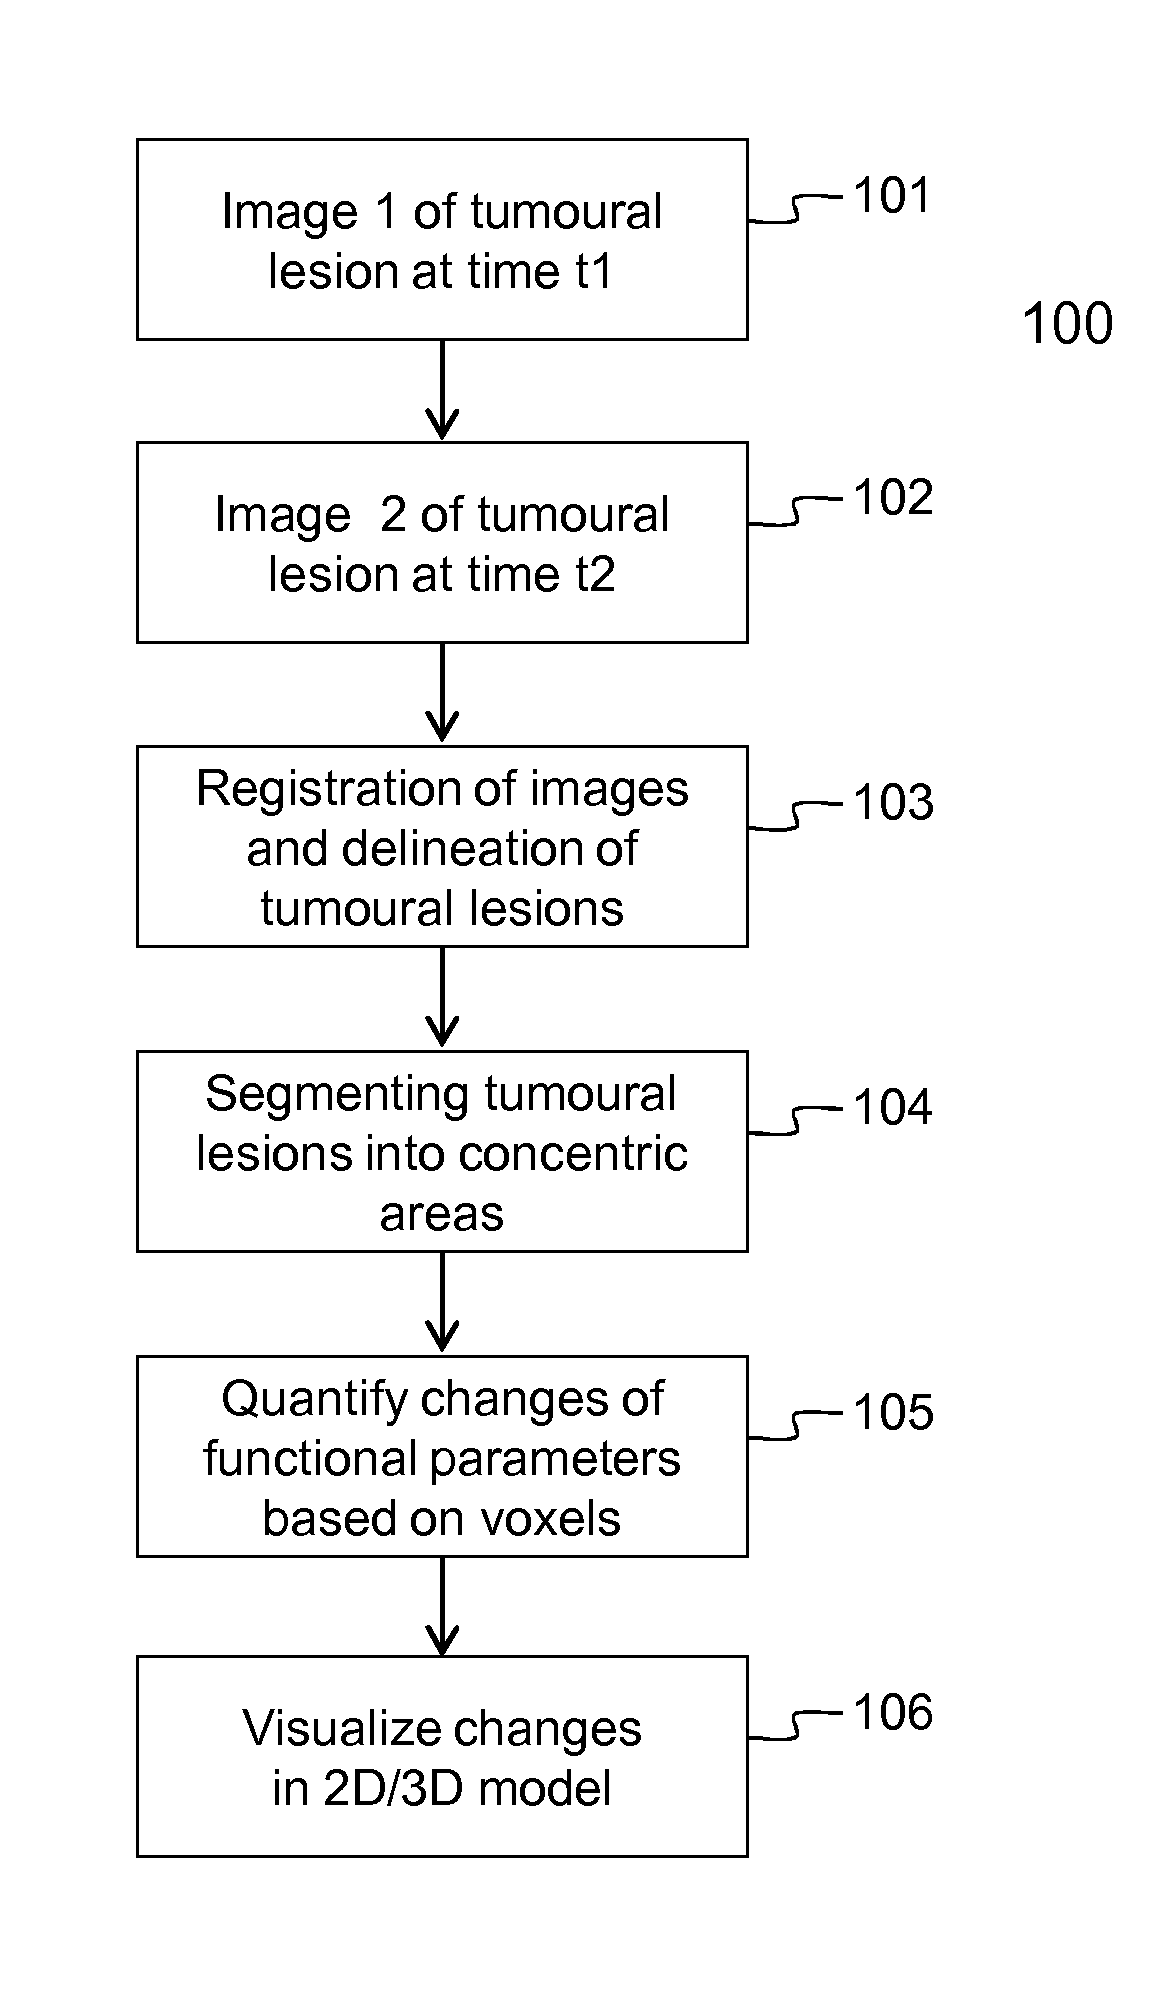
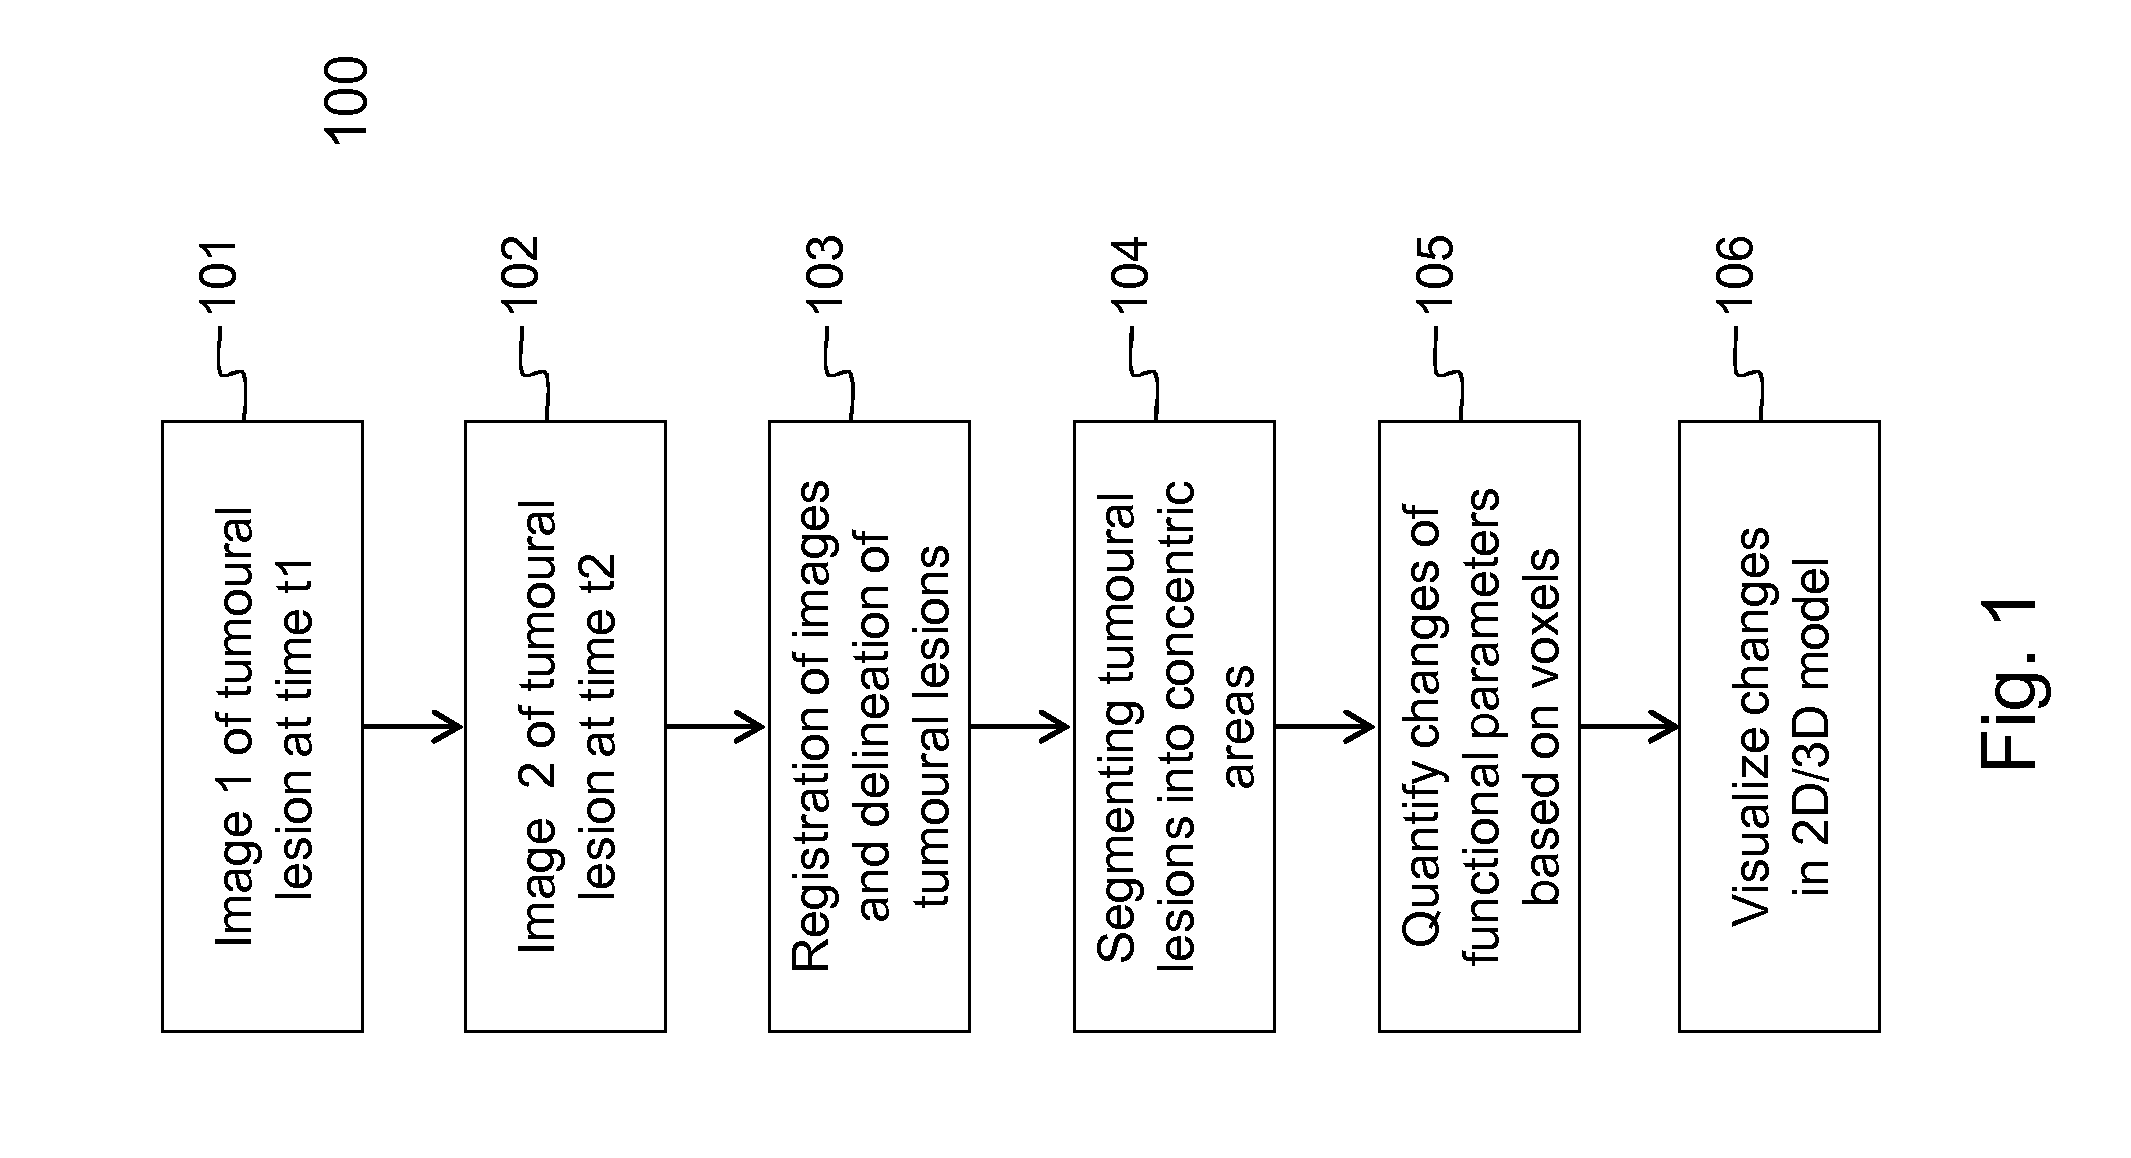
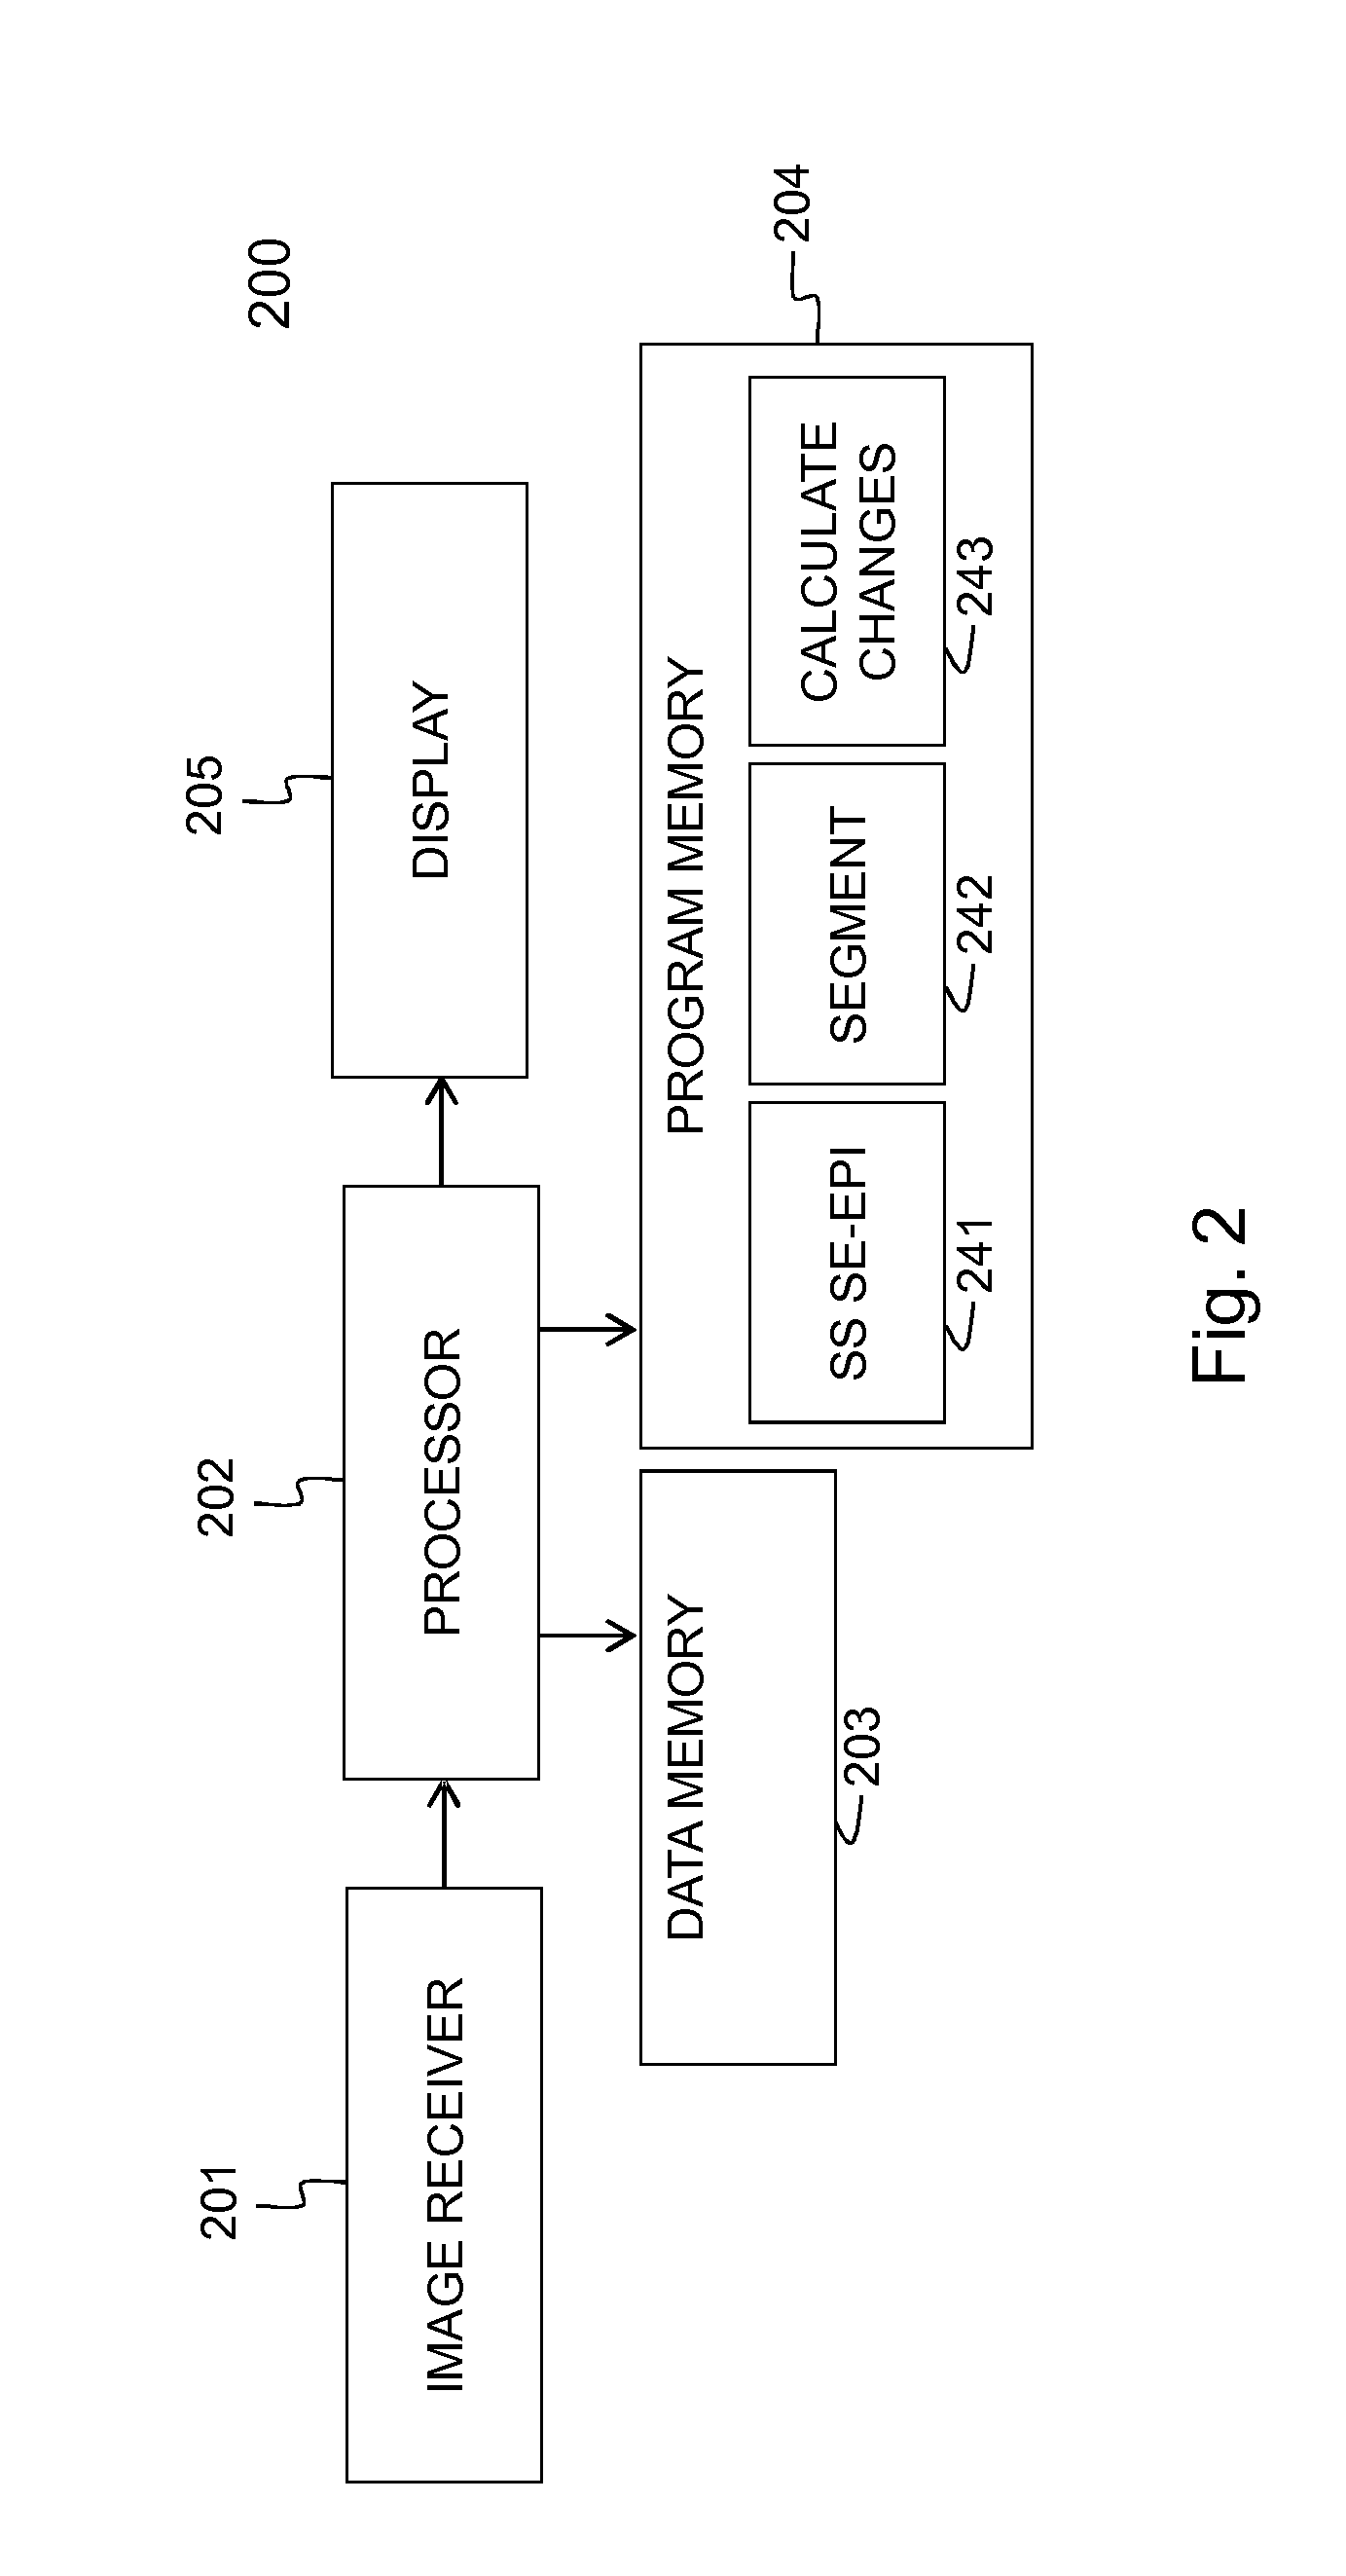
[0106]Embodiments of the method 100 and device 200 for evaluating the evolution of tumour lesions over a period of time t1-t2 are illustrated respectively by FIG. 1 and FIG. 2. In step 101, a first image taken at time t1 is received via the interface 201, e.g. a network connection or connection to an MRI scanner. Similarly, in step 102, a second image taken at time t2, is received via the interface 201. The images are temporarily stored in data memory 203 for being processed by processor 202. In the images, the tumour lesions are delineated using the SS SE-EPI algorithm. The delineation followed by registration of the images, i.e. step 103 in FIG. 1, is executed by the processor 202 that is software controlled. The SS SE-EPI algorithm 241 may be one out of several delineation algorithms that is available in the program memory 204 of the device 200 according to the invention. The delineation of tumour lesions may be fully automated, i.e. the algorithm also detects the tumour lesions...


PUM


Abstract

A new method (100) for evaluating evolution of tumoral lesions includes: —providing (101) a first image of the tumoral lesions, the first image being made at a first time instant; —providing (102) a second image of the tumoral lesions, the second image being made at a second time instant that is later than the first time instant; —delineating (103) a border of the tumoral lesions in the first image and the second image; —registration (103) of the tumoral lesions in the first image the second image; —segmenting (104) the tumoral lesions in the first image and the second image into concentric areas; —quantifying (105) changes of at least one functional parameter between the concentric areas in the first image and respective corresponding concentric areas in the second image; and —visualizing (106) the changes in a two-dimensional or three-dimensional model of the tumoral lesions.

Description

[0001]This application claims the benefit of European patent application No. 10007371.7, filed Jul. 16, 2010, which is hereby incorporated by reference in its entirety.FIELD OF THE INVENTION[0002]The present invention generally relates to a method and device for evaluating the evolution of tumour lesions through imaging systems, e.g. during oncology therapy like for instance radio-therapy or chemo-therapy. Through temporal imaging, plural 2D-digital images (pixel-based) or 3D-digital images (voxel-based) of the same tumour-affected organ may be acquired over a period in time, for instance a three month period during which the tumour is treated with a certain therapy. Advanced digital image acquisition systems such as scanners generating ultrasound (US) images, computed tomography (CT) images, magnetic resonance (MR) images, positron emission tomography (PET) images, positron emission tomography-computed tomography (PET-CT) images and single photon emission computed tomography (SPECT...

Claims


Application Information

Patent Timeline
Patent Type & Authority Patents(United States)
IPC IPC(8): G06K9/00
CPCG06K9/00362G06T2207/10132G06T2207/30096G06T2207/10072G06T7/2053G06T7/0016G06T7/254G06V40/10
Inventor COENEGRACHTS, KENNETH, LOUIS, STEFAN
Owner DR K COENEGRACHTS
Why Eureka
Try Eureka