Transmural perfusion gradient image analysis

a technology of transmural perfusion and image analysis, applied in image analysis, image enhancement, instruments, etc., can solve the problems of lack of diagnostic capability and system analysis of sequence of datasets representing sequential images of objects

Active Publication Date: 2014-06-17
KONINKLIJKE PHILIPS ELECTRONICS NV
View PDF6 Cites 5 Cited by
  • Summary
  • Abstract
  • Description
  • Claims
  • Application Information

AI Technical Summary

Benefits of technology

[0012]The system according to the invention determines a gradient at a particular place of the object, as represented by analysis rays, for the images. Since the analysis ray connects the first border with the second border, the analysis ray runs across the image region. Accordingly, a sequence of gradients is obtained, which represent the time-dependent development of the gradient. This makes it possible to inspect the established gradients and to diagnose deviation in the gradients from the norm.
[0034]It is of advantage to assess the location and severity of a perfusion deficit, i.e., of gradients. By selecting multiple combinations, the location is determined, namely through the selection of the analysis rays. The severity is determined through selecting the gradients themselves (high gradients being indicative of severe perfusion deficit) and through the selection of the images (a high gradient which persists across many images, i.e., for a relatively long time, being indicative of severe perfusion deficit). In particular, high gradient values in many locations of the heart are an indication of a severe perfusion deficit. A particular form of high gradient values in many locations is the occurrence of high gradients across a large angle of a section of the myocardium, in particular across a consecutive angle. Accordingly, determining the extent, e.g. the angle, across which the gradients are higher than a pre-determined value, is of advantage.

Problems solved by technology

Current systems for analyzing a sequence of datasets representing sequential images of an object, as may be used for, e.g., diagnosing coronary artery disease, lack diagnostic capability.

Method used


Image

  • Transmural perfusion gradient image analysis
  • Transmural perfusion gradient image analysis
  • Transmural perfusion gradient image analysis

Examples


Embodiment Construction

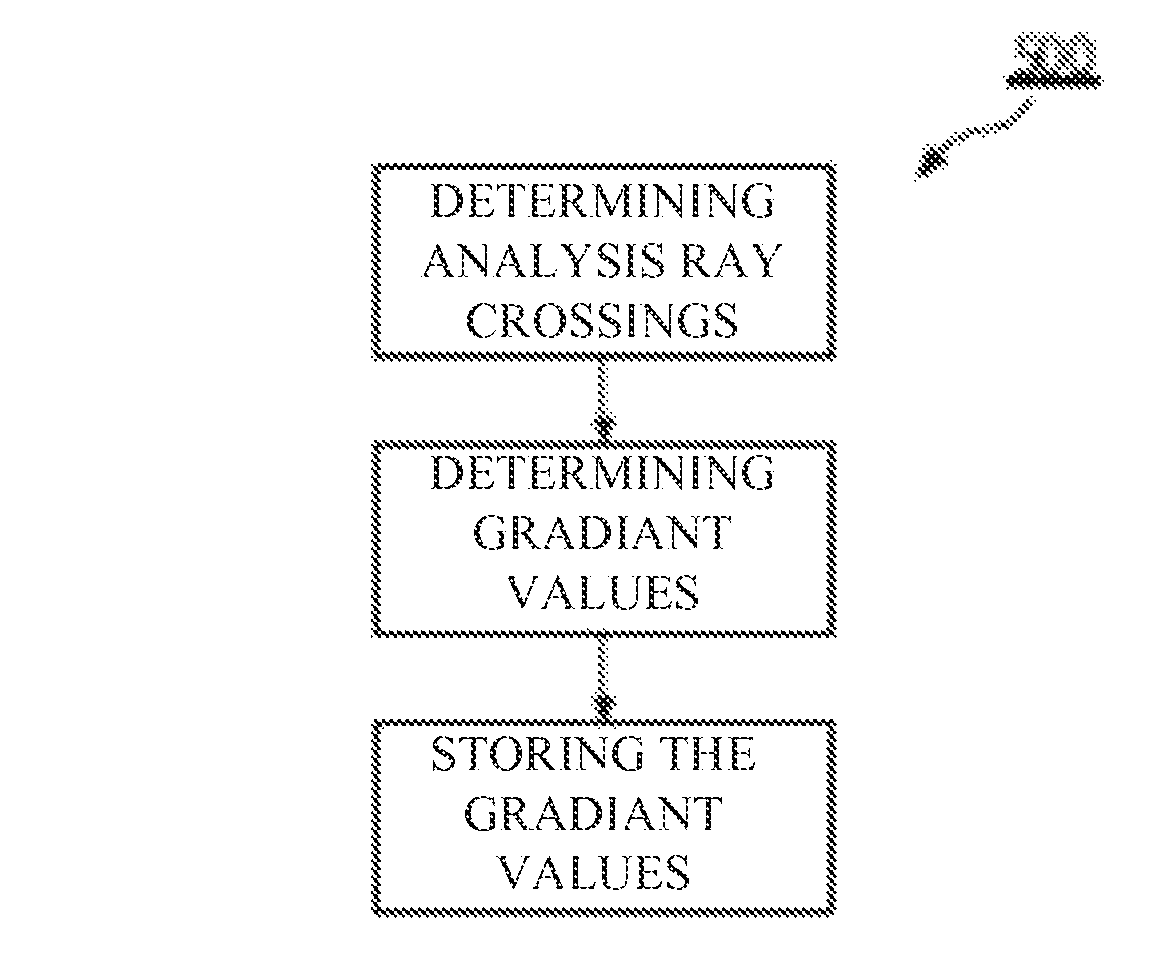
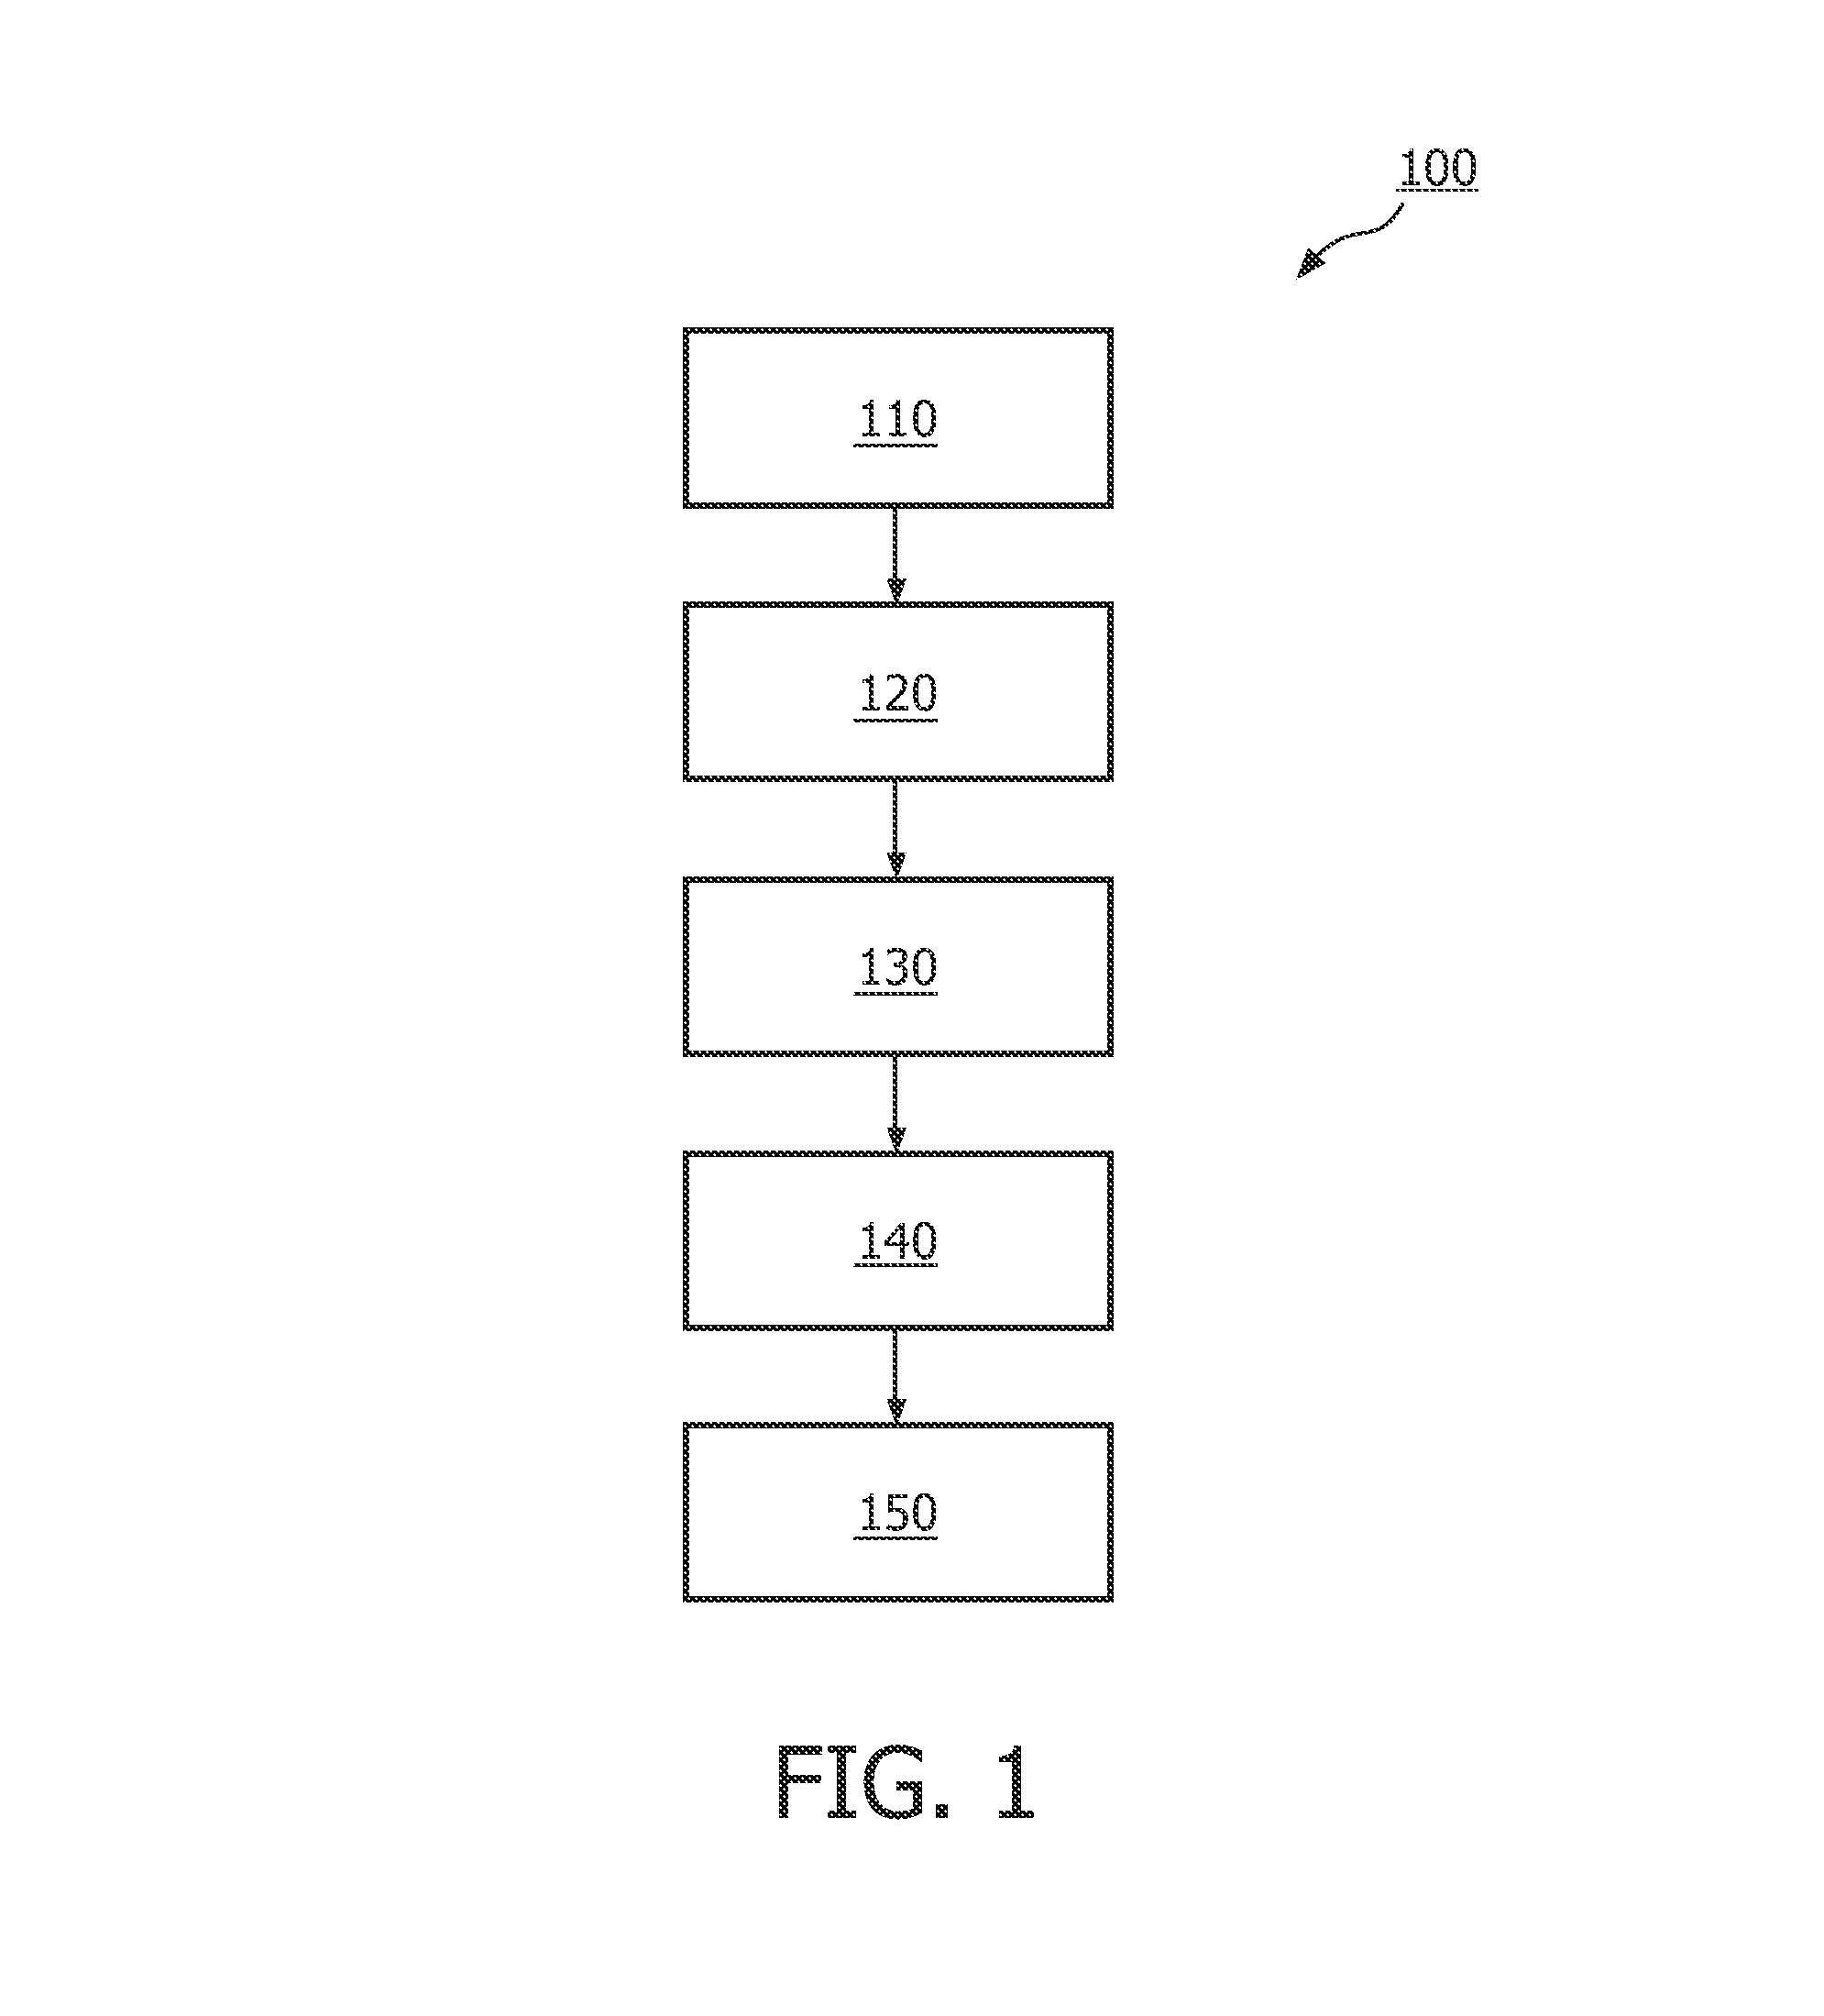
[0061]In FIG. 1, the architecture of an image analyzing system 100 is schematically illustrated. The image analyzing system 100 comprises an image acquisition module 110, an image pre-processing module 120, a ray determination means 130, a gradient determination means 140 and a data storage means 150.

[0062]The various modules and means of system 100, such as an image pre-processing module 120, a ray determination means 130, a gradient determination means 140, may comprise, e.g., dedicated hardware, a microprocessor arranged for executing a suitable software program, or combinations thereof.

[0063]The image acquisition module 110 is arranged to acquire a suitable sequence of images, which are encoded using at least a two-dimensional array of values. The values may be floating point-type or integer-type. The values may be constraint to some range. For example, the values may be integers in a range from 0 up to and including 255. Various imaging modalities may be used to obtain image da...


PUM


Abstract

A system (100) for analyzing a sequence of datasets representing sequential images of an object, a dataset associating data values with positions, the images having an image region having a first border (210) and a second border (220) associated with the object, the system comprising a ray establishing means (130) for establishing for individual images an analysis ray (232; 234; 236) connecting the first and second border of the image region, the analysis rays being in a respective position representing a substantially same position with respect to the object, a gradient establishing means (140) for establishing, for individual analysis rays, a gradient value which is representative of a rate of change in the data values across the image region and along the analysis ray from the first border to the second border. The system is well suited to locate perfusion deficits in the myocardium through the identification of transmural gradients.

Description

FIELD OF THE INVENTION[0001]The invention relates to a system for analyzing a sequence of datasets representing sequential images of an object.[0002]The invention further relates to a corresponding method and computer program product.BACKGROUND OF THE INVENTION[0003]The most frequent heart disease is ischemia due to an at least partial occlusion (stenosis) of a coronary artery. Occlusion of a coronary artery may lead to a deficit in the perfusion of myocardial tissue. Various imaging modalities may be used to obtain data on the perfusion, e.g., MRI, PET, SPECT, CT, etc.[0004]For example, cardiac MRI allows quantification of myocardial perfusion. In particular, first pass enhancement cardiac MRI may be used to assess the severity of perfusion deficits caused by coronary artery occlusions. In first pass enhancement cardiac MRI the uptake of a contrast agent in the myocardial tissue after the first pass of a contrast bolus is measured.[0005]The contrast agent highlights the perfusion i...

Claims


Application Information

Patent Timeline
Patent Type & Authority Patents(United States)
IPC IPC(8): G06K9/46
CPCG06T7/0014G06T2207/30048G06T2207/10016
Inventor HAUTVAST, GILION LEOPOLD THEODORUS FREDERIKCHIRIBIRI, AMEDEOPLEIN, SVENNAGEL, EIKE CASPAR CORNELIUS
Owner KONINKLIJKE PHILIPS ELECTRONICS NV
Why Eureka
Try Eureka