Reparametrized bull's eye plots

a plot and parametrisation technology, applied in the field of visualizing quantitative analysis results in a bull's eye plot, can solve the problems that the current scanning procedure does not yet allow the acquisition of functional, perfusion and viability images of the same resolution, and it is difficult to compare the complementary information comprised in the function, perfusion and viability bull's eye plots. achieve the effect of improving the visualizing results

Active Publication Date: 2014-12-09
KONINK PHILIPS ELECTRONICS NV
View PDF16 Cites 5 Cited by
  • Summary
  • Abstract
  • Description
  • Claims
  • Application Information

AI Technical Summary

Benefits of technology

[0008]It would be advantageous to have a system which improves visualizing results of a quantitative analysis of a structure comprised in first image data in a first bull's eye plot, which first bull's eye plot can easily be compared to a second bull's eye plot visualizing results of a quantitative analysis of the same structure described in second image data.
[0015]The radius may be, e.g., the external or the internal radius of the ring. The dependence of the first bull's eye plot concentric ring radius on the position of the data slice associated with said concentric ring of the first bull's eye plot, with respect to the object, defines an objective framework for the first bull's eye plot, based on the geometry of the object. Thus, the results of the first quantitative analysis of the object visualized in the first bull's eye plot can be more easily compared with results of a second quantitative analysis of the same object represented in second image data visualized in a second bull's eye plot when the length of the radiuses of the concentric rings of the second bull's eye plot are also defined on the basis of the positions of the data slices associated with said concentric rings of a second first bull's eye plot, with respect to the object. This is because the length of the radius of a concentric ring associated with a slice of the first plurality of data slices, said slice being at a certain position with respect to the object, will be similar to the length of the radius of a concentric ring associated with a slice of the second plurality of data slices, said slice being at a similar position with respect to the object.
[0016]In an embodiment of the system, the data slice associated with the concentric ring comprises a data sector, the slice unit further comprises a slice-sector unit for associating the data sector of the data slice with a ring sector of the concentric ring, the value unit comprises a sector-value unit for computing at least one value for displaying in the ring sector of the concentric ring, on the basis of the data sector associated with the ring sector of the concentric ring, and the position of the ring sector with respect to the concentric ring is defined on the basis of the position of the data sector associated with the ring sector, with respect to the object. By choosing smaller sectors, it is possible to increase the resolution of the first bull's eye plot. Because the position of each sector is based on the position of the corresponding data sector with respect to the object, the objective framework for the first bull's eye plot is based on a more detailed geometry of the object.

Problems solved by technology

Unfortunately, current scanning procedures do not yet allow acquiring functional, perfusion and viability images of the same resolution.
Therefore, the derived bull's eye plots consist of arbitrarily distributed different numbers of rings, such that it becomes difficult to compare the complementary information comprised in function, perfusion and viability bull's eye plots.

Method used


Image

  • Reparametrized bull's eye plots
  • Reparametrized bull's eye plots
  • Reparametrized bull's eye plots

Examples


Embodiment Construction

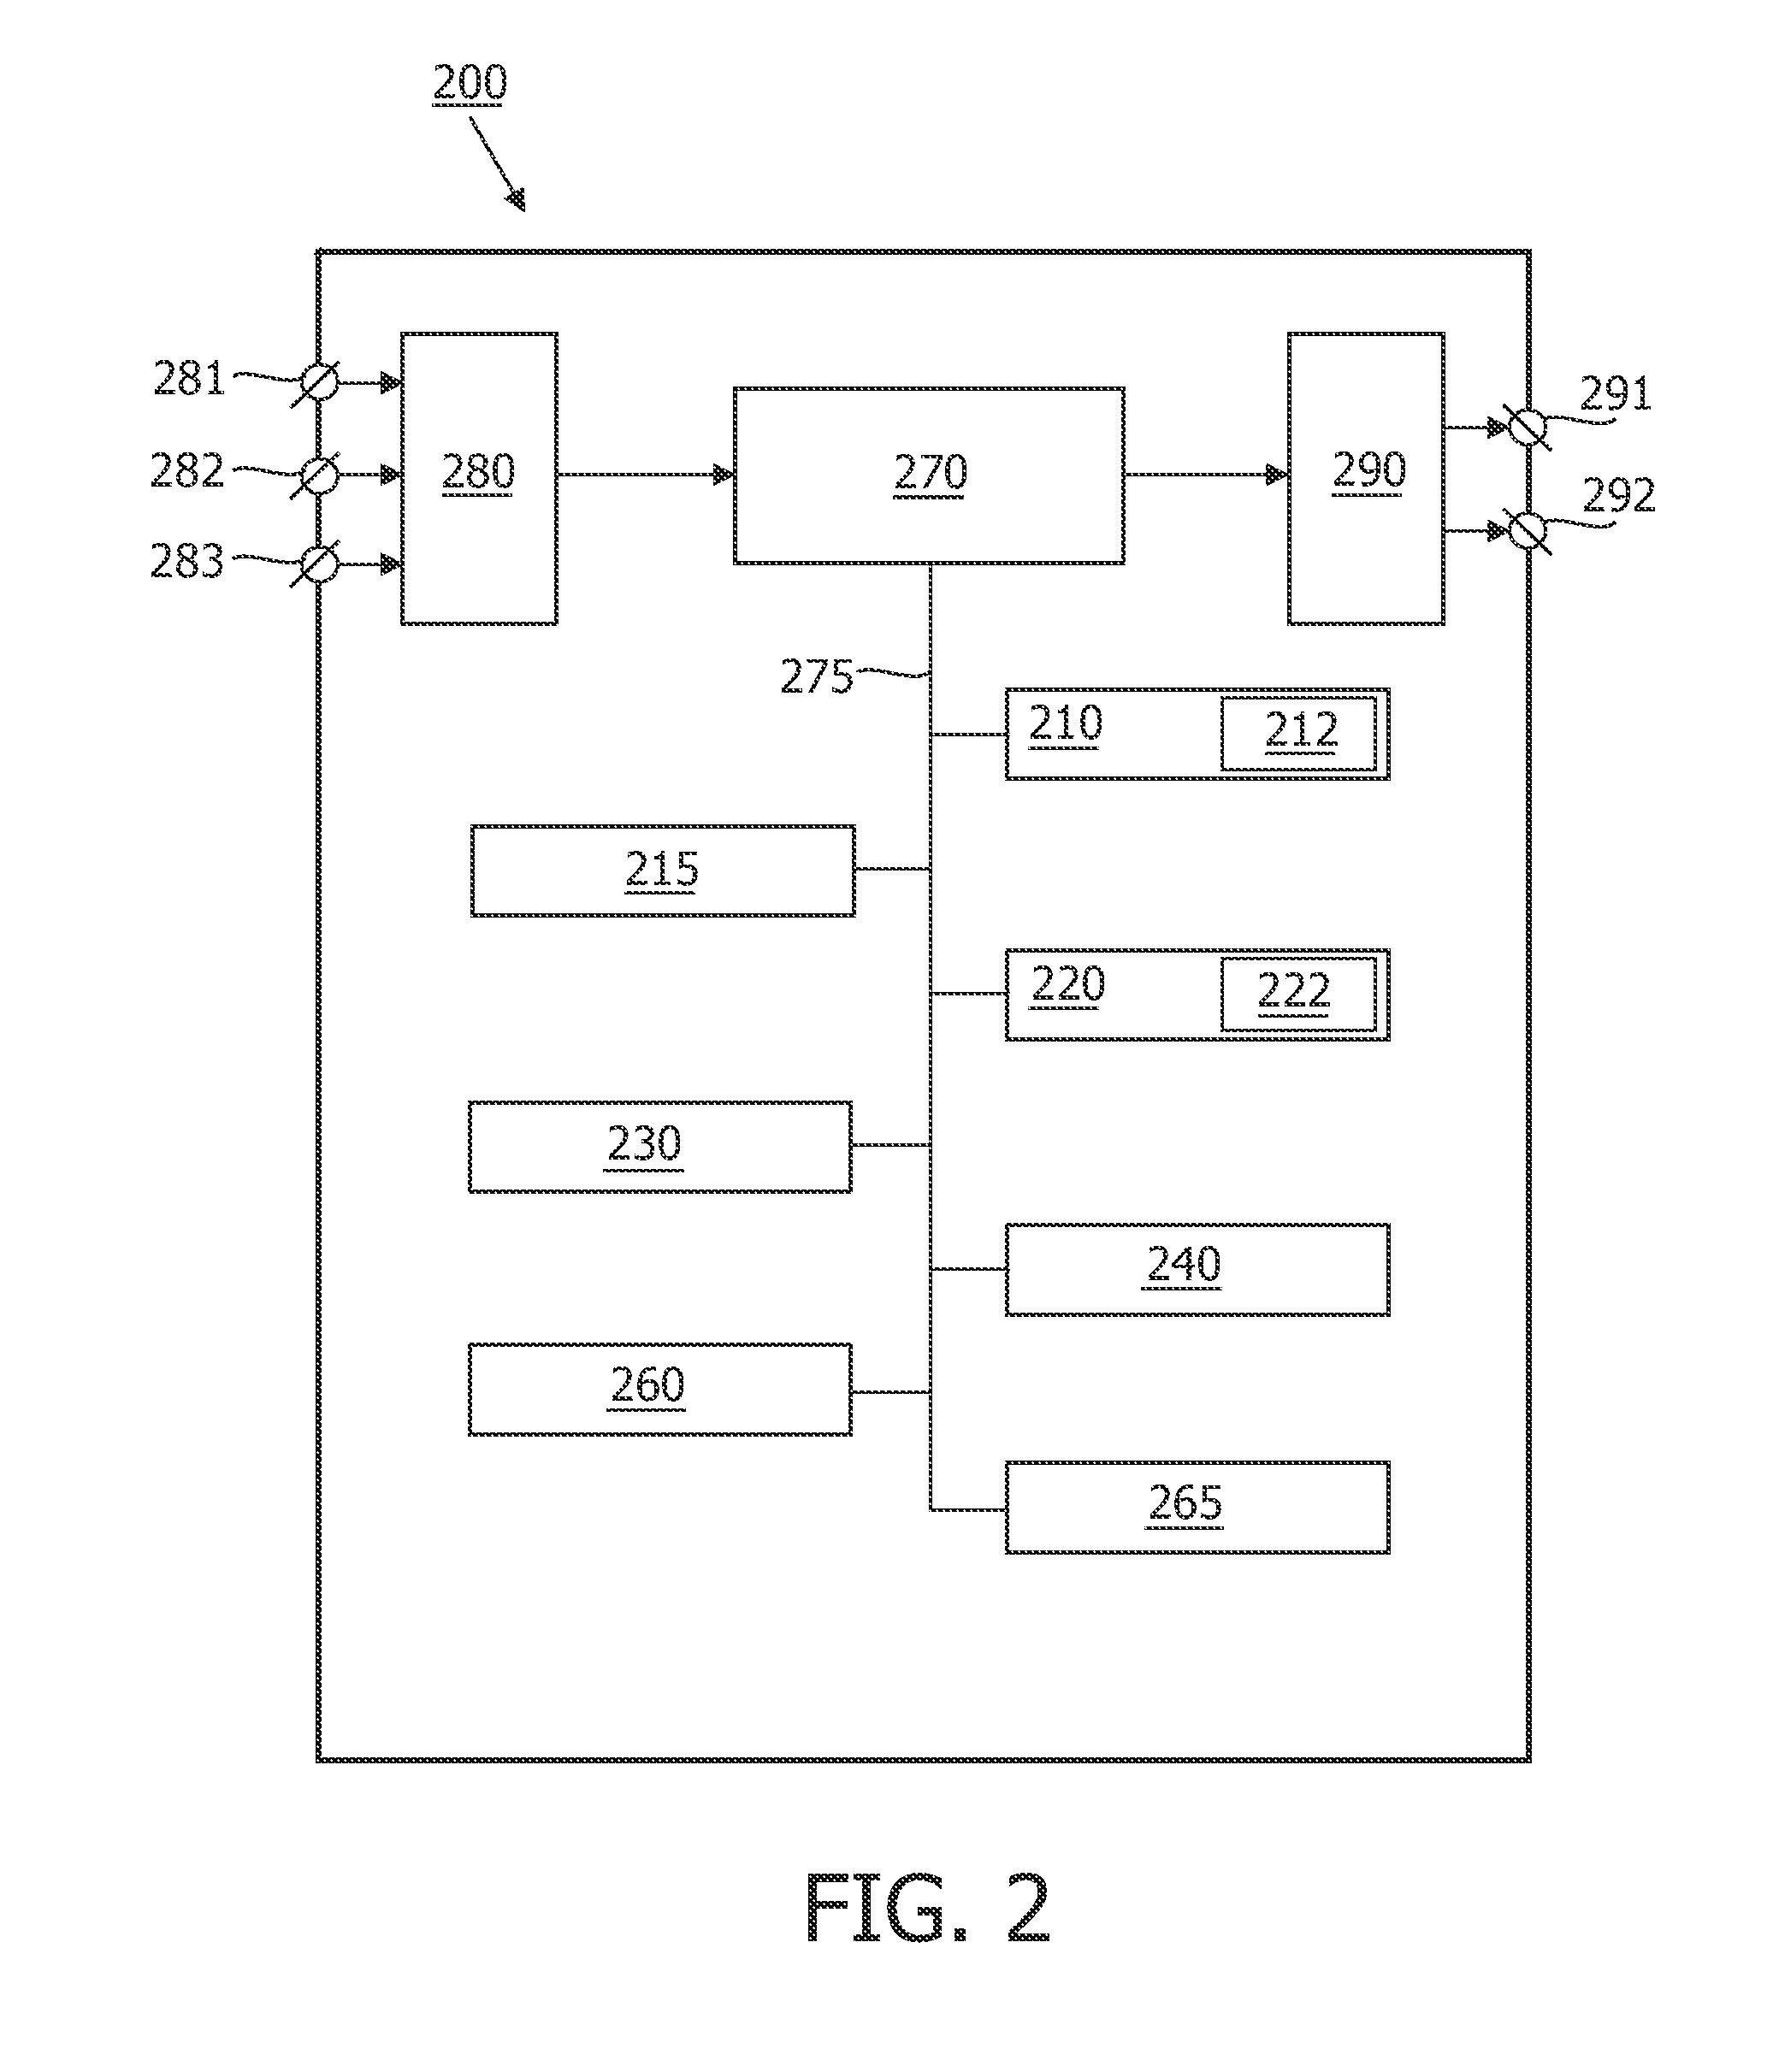
[0065]FIG. 2 schematically shows a block diagram of an exemplary embodiment of the system 200 for visualizing, in a first bull's eye plot, results of a first quantitative analysis of an object represented in first image data, the first image data comprising a first plurality of data slices, the system 200 comprising:[0066]a slice unit 210 for associating a data slice of the first plurality of data slices with a concentric ring of the first bull's eye plot;[0067]a radius unit 215 for computing the length of a radius of the concentric ring of the first bull's eye plot; and[0068]a value unit 220 for computing at least one value for displaying in the concentric ring of the first bull's eye plot, on the basis of the data slice associated with the concentric ring of the first bull's eye plot;[0069]and wherein the length of a radius of the concentric ring of the first bull's eye plot is defined on the basis of the position of the data slice, of the first plurality of data slices, associate...


PUM


Abstract

The invention relates to a system for visualizing, in a first bull's eye plot, results of a first quantitative analysis of an object represented in first image data, in particular for cardiac analysis. The first image data comprises a first plurality of data slices, and the system comprises a slice unit for associating a data slice of the first plurality of data slices with a concentric ring of the first bull's eye plot, a radius unit for computing the length of a radius of the concentric ring of the first bull's eye plot, and a value unit for computing at least one value for displaying in the concentric ring of the first bull's eye plot, on the basis of the data slice associated with the concentric ring of the first bull's eye plot, and wherein the length of the radius of the concentric ring of the first bull's eye plot is defined on the basis of the position of the data slice, of the first plurality of data slices, associated with the concentric ring of the first bull's eye plot, with respect to the object. The dependence of the first bull's eye plot concentric ring radius on the position of the data slice associated with said concentric ring of the first bull's eye plot, with respect to the object, defines an objective framework for the first bull's eye plot, based on the geometry of the object. Thus, the results of the first quantitative analysis of the object visualized in the first bull's eye plot can be more easily compared with results of a second quantitative analysis of the same object represented in second image data visualized in a second bull's eye plot, when the length of the radiuses of the concentric rings of the second bull's eye plot are also defined on the basis of the positions of the data slices associated with said concentric rings of a second first bull's eye plot, with respect to the object. In an embodiment, the corresponding locations in each bull's eye plot may be indicated by couples pointers. In addition, further pointers, each pointer coupled to the respective pointer in one of the bull's eye plots, may be adapted for pointing at corresponding locations in the corresponding data slices of the first and second image data.

Description

FIELD OF THE INVENTION[0001]The invention relates to the visualization of quantitative analysis results in a bull's eye plot, in particular to the visualization of quantitative cardiac analysis results.BACKGROUND OF THE INVENTION[0002]Cardiac imaging can be used to determine local myocardial function, perfusion and viability. Nowadays, such images can be obtained using various modalities such as magnetic resonance imaging (MRI), computed tomography (CT), ultrasound (US) and nuclear medicine (PET / SPECT). The images for function, perfusion and viability may be obtained using one modality (MRI) or using hybrid imaging, for instance PET / CT.[0003]After acquisition, the images are analyzed independently, resulting in a number of measurements performed at different positions at the myocardium. The functional images are used to quantify wall motion abnormalities, the perfusion images are used to quantify perfusion deficits and the viability images are used to quantify scarring of the myocar...

Claims


Application Information

Patent Timeline
Patent Type & Authority Patents(United States)
IPC IPC(8): G06K9/00G06T17/00A61B5/00A61B5/055G06T11/20
CPCA61B5/024A61B5/7475A61B5/7425G06T11/206A61B6/507A61B6/503A61B5/055A61B5/7435
Inventor HAUTVAST, GUILLAUME, LEOPOLD, THEODORUS, FREDERIK
Owner KONINK PHILIPS ELECTRONICS NV
Why Eureka
Try Eureka