

Measurement of properties of fluids using MRI
a technology of fluid properties and measurement methods, applied in the direction of liquid/fluent solid measurement, analysis using nuclear magnetic resonance, reradiation, etc., can solve the problem of not teaching a method of deriving rheological parameters from velocity data
- Summary
- Abstract
- Description
- Claims
- Application Information
AI Technical Summary
Benefits of technology
Problems solved by technology
Method used
Image

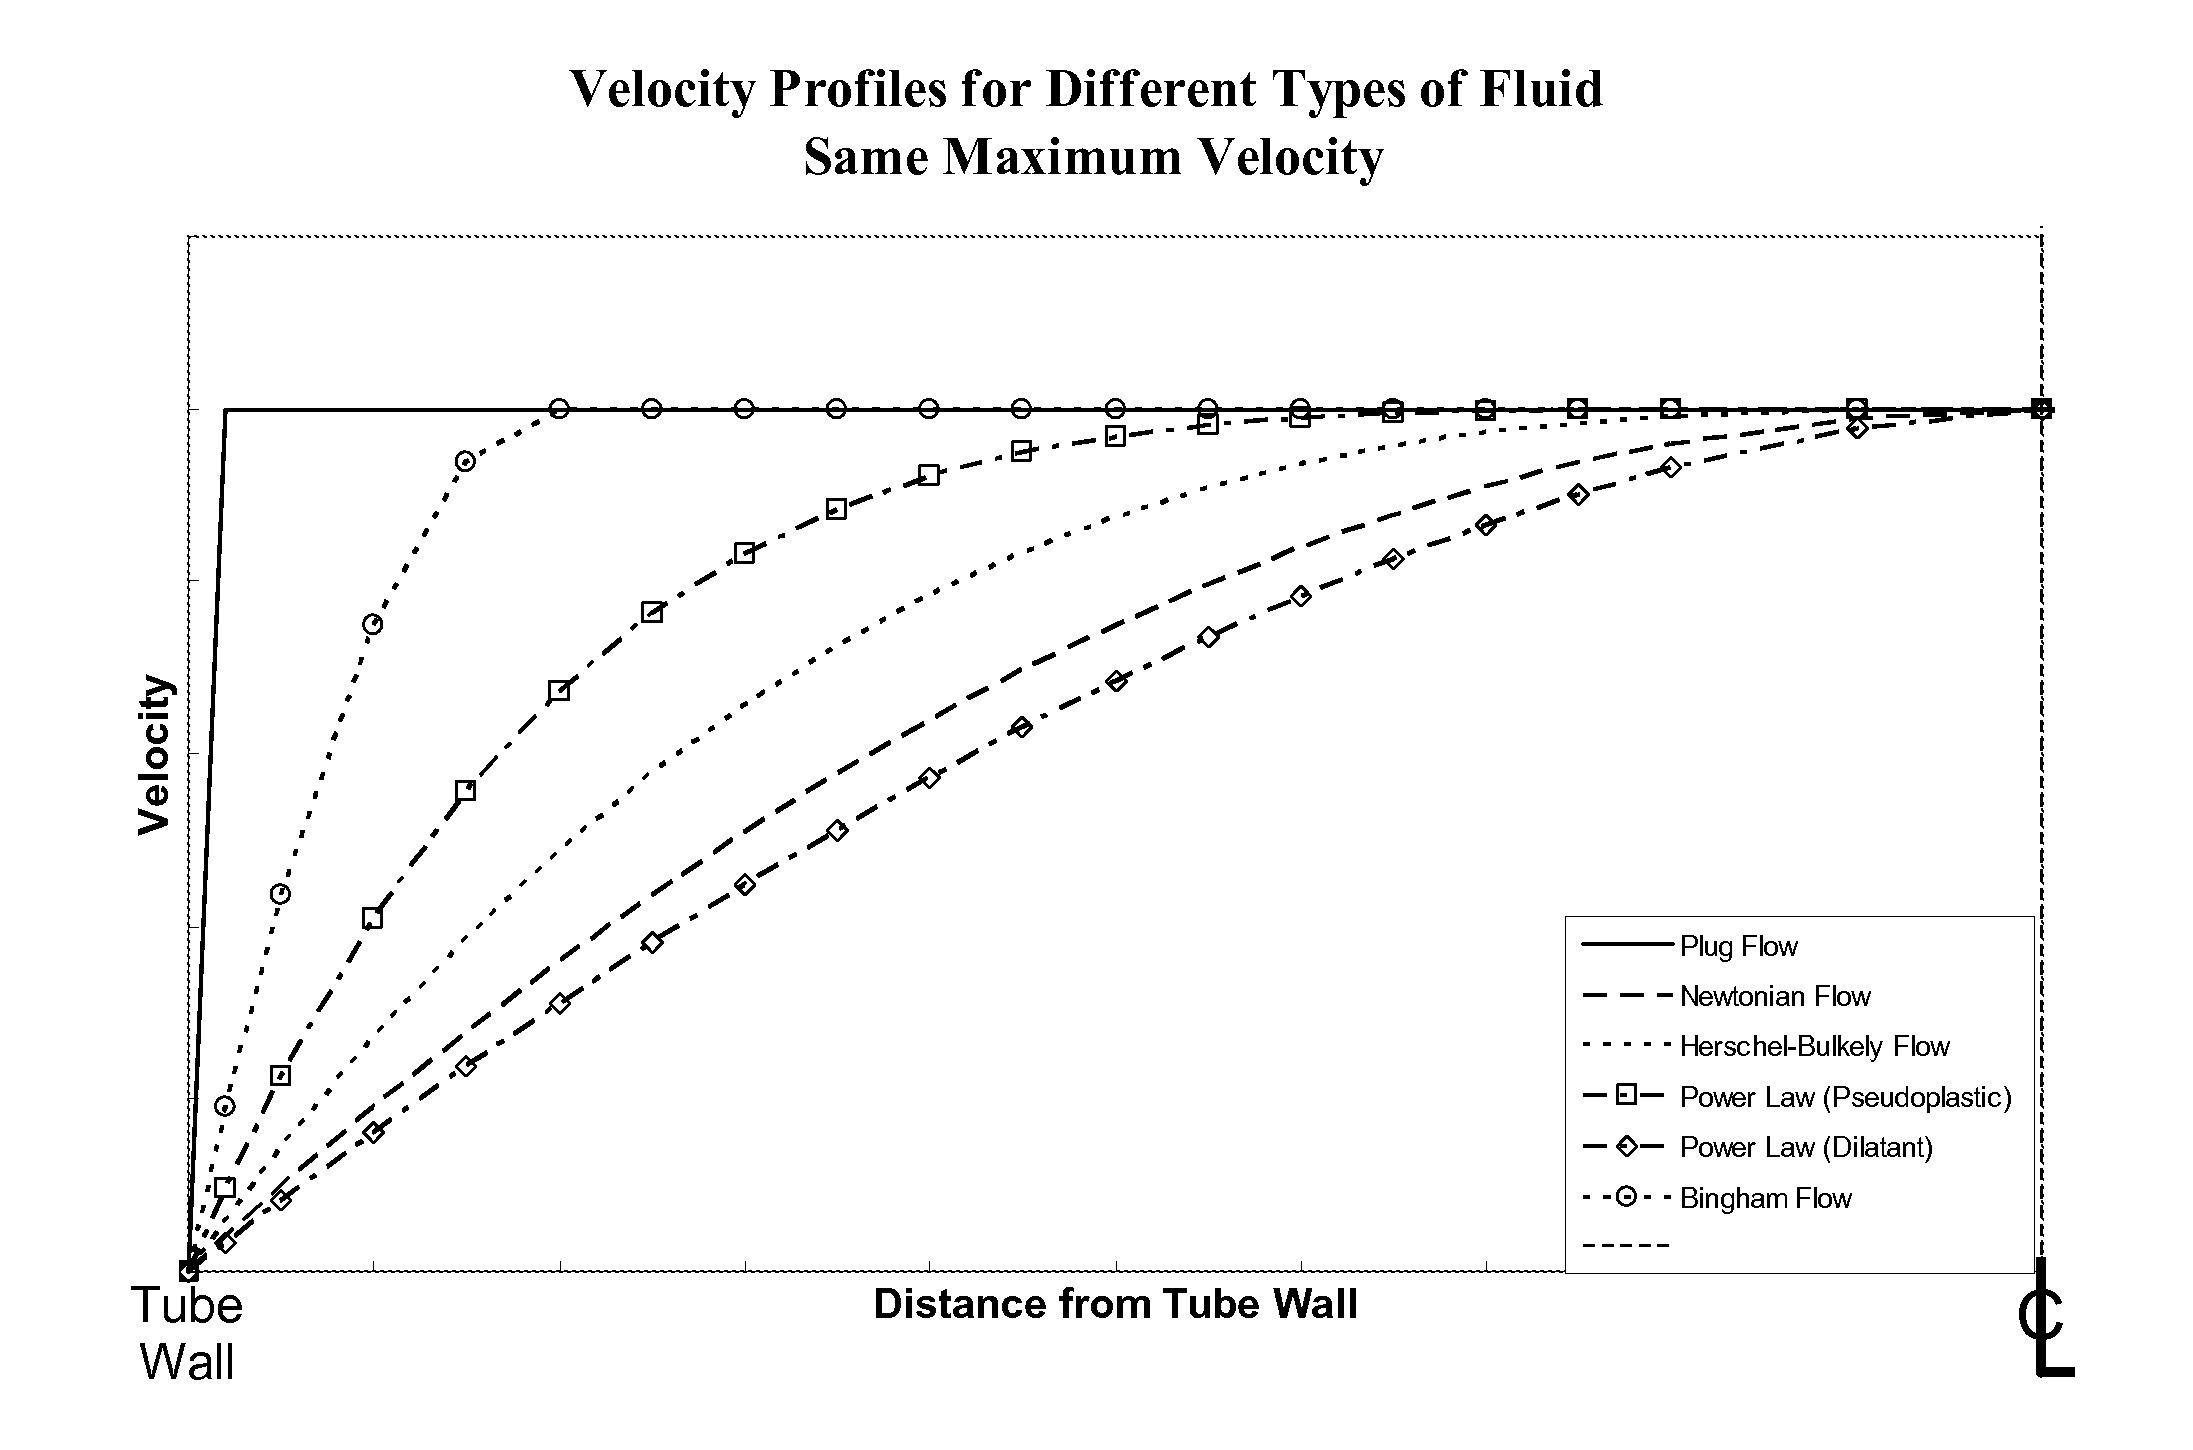
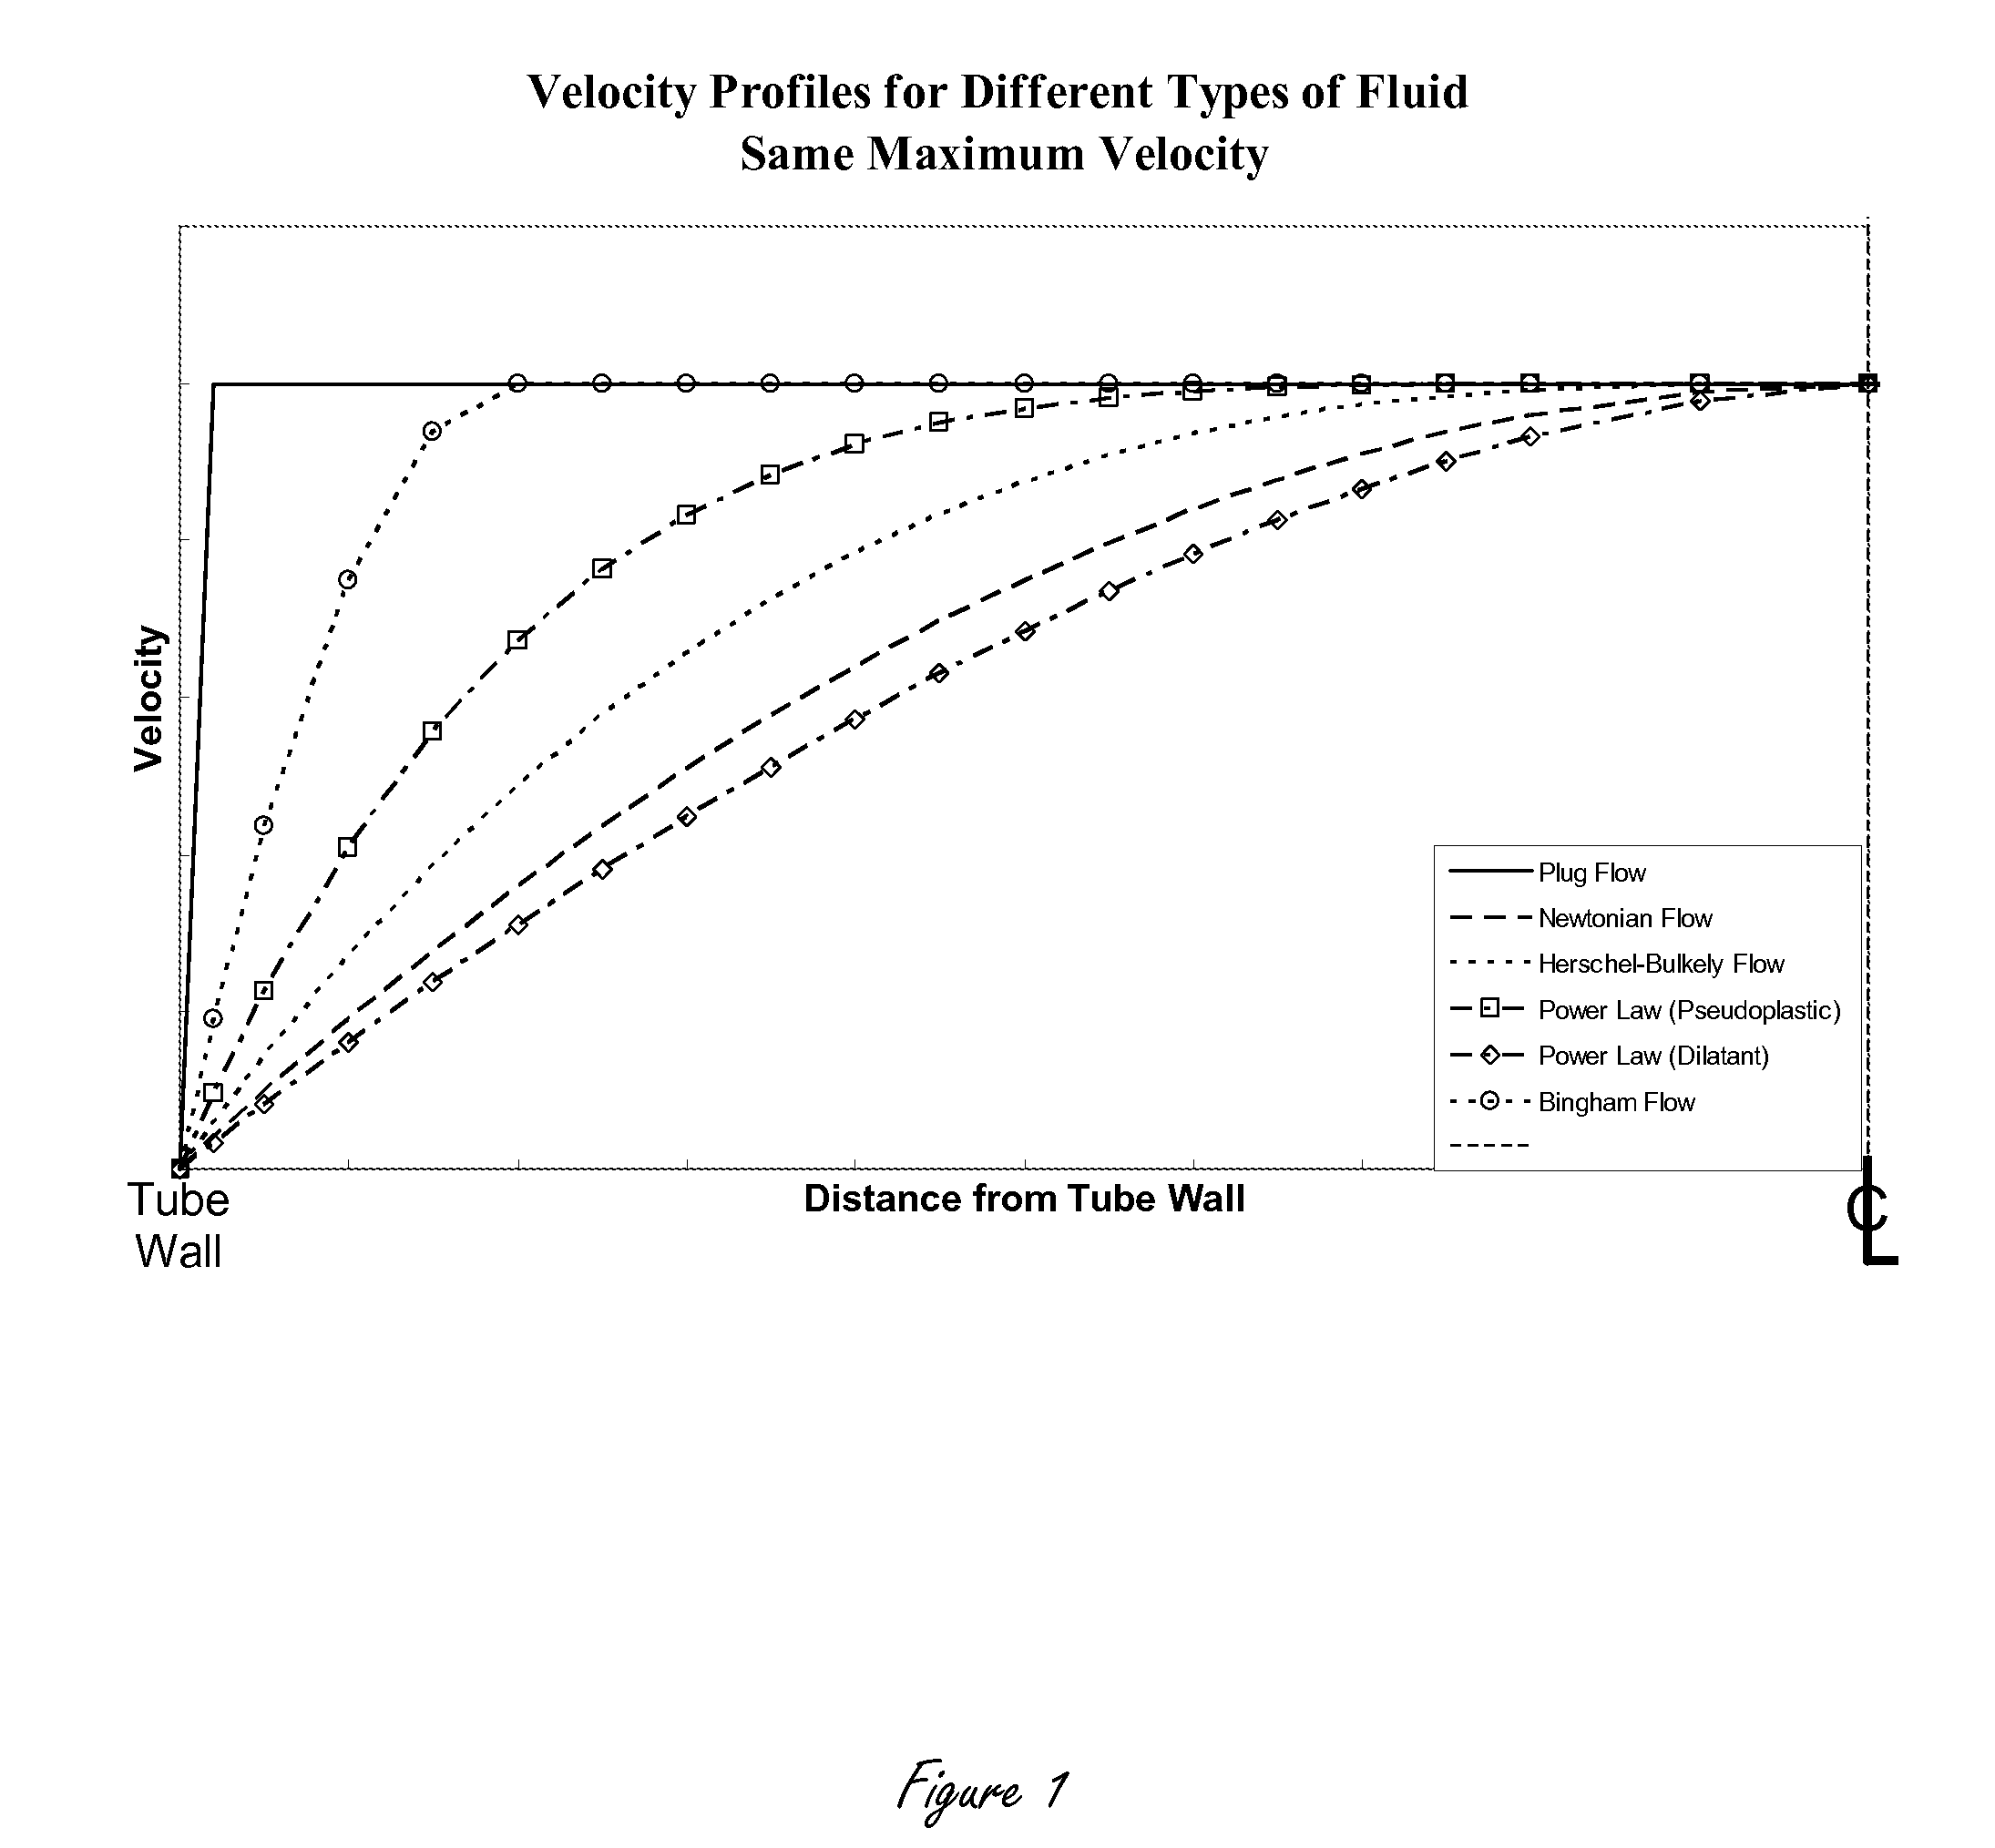
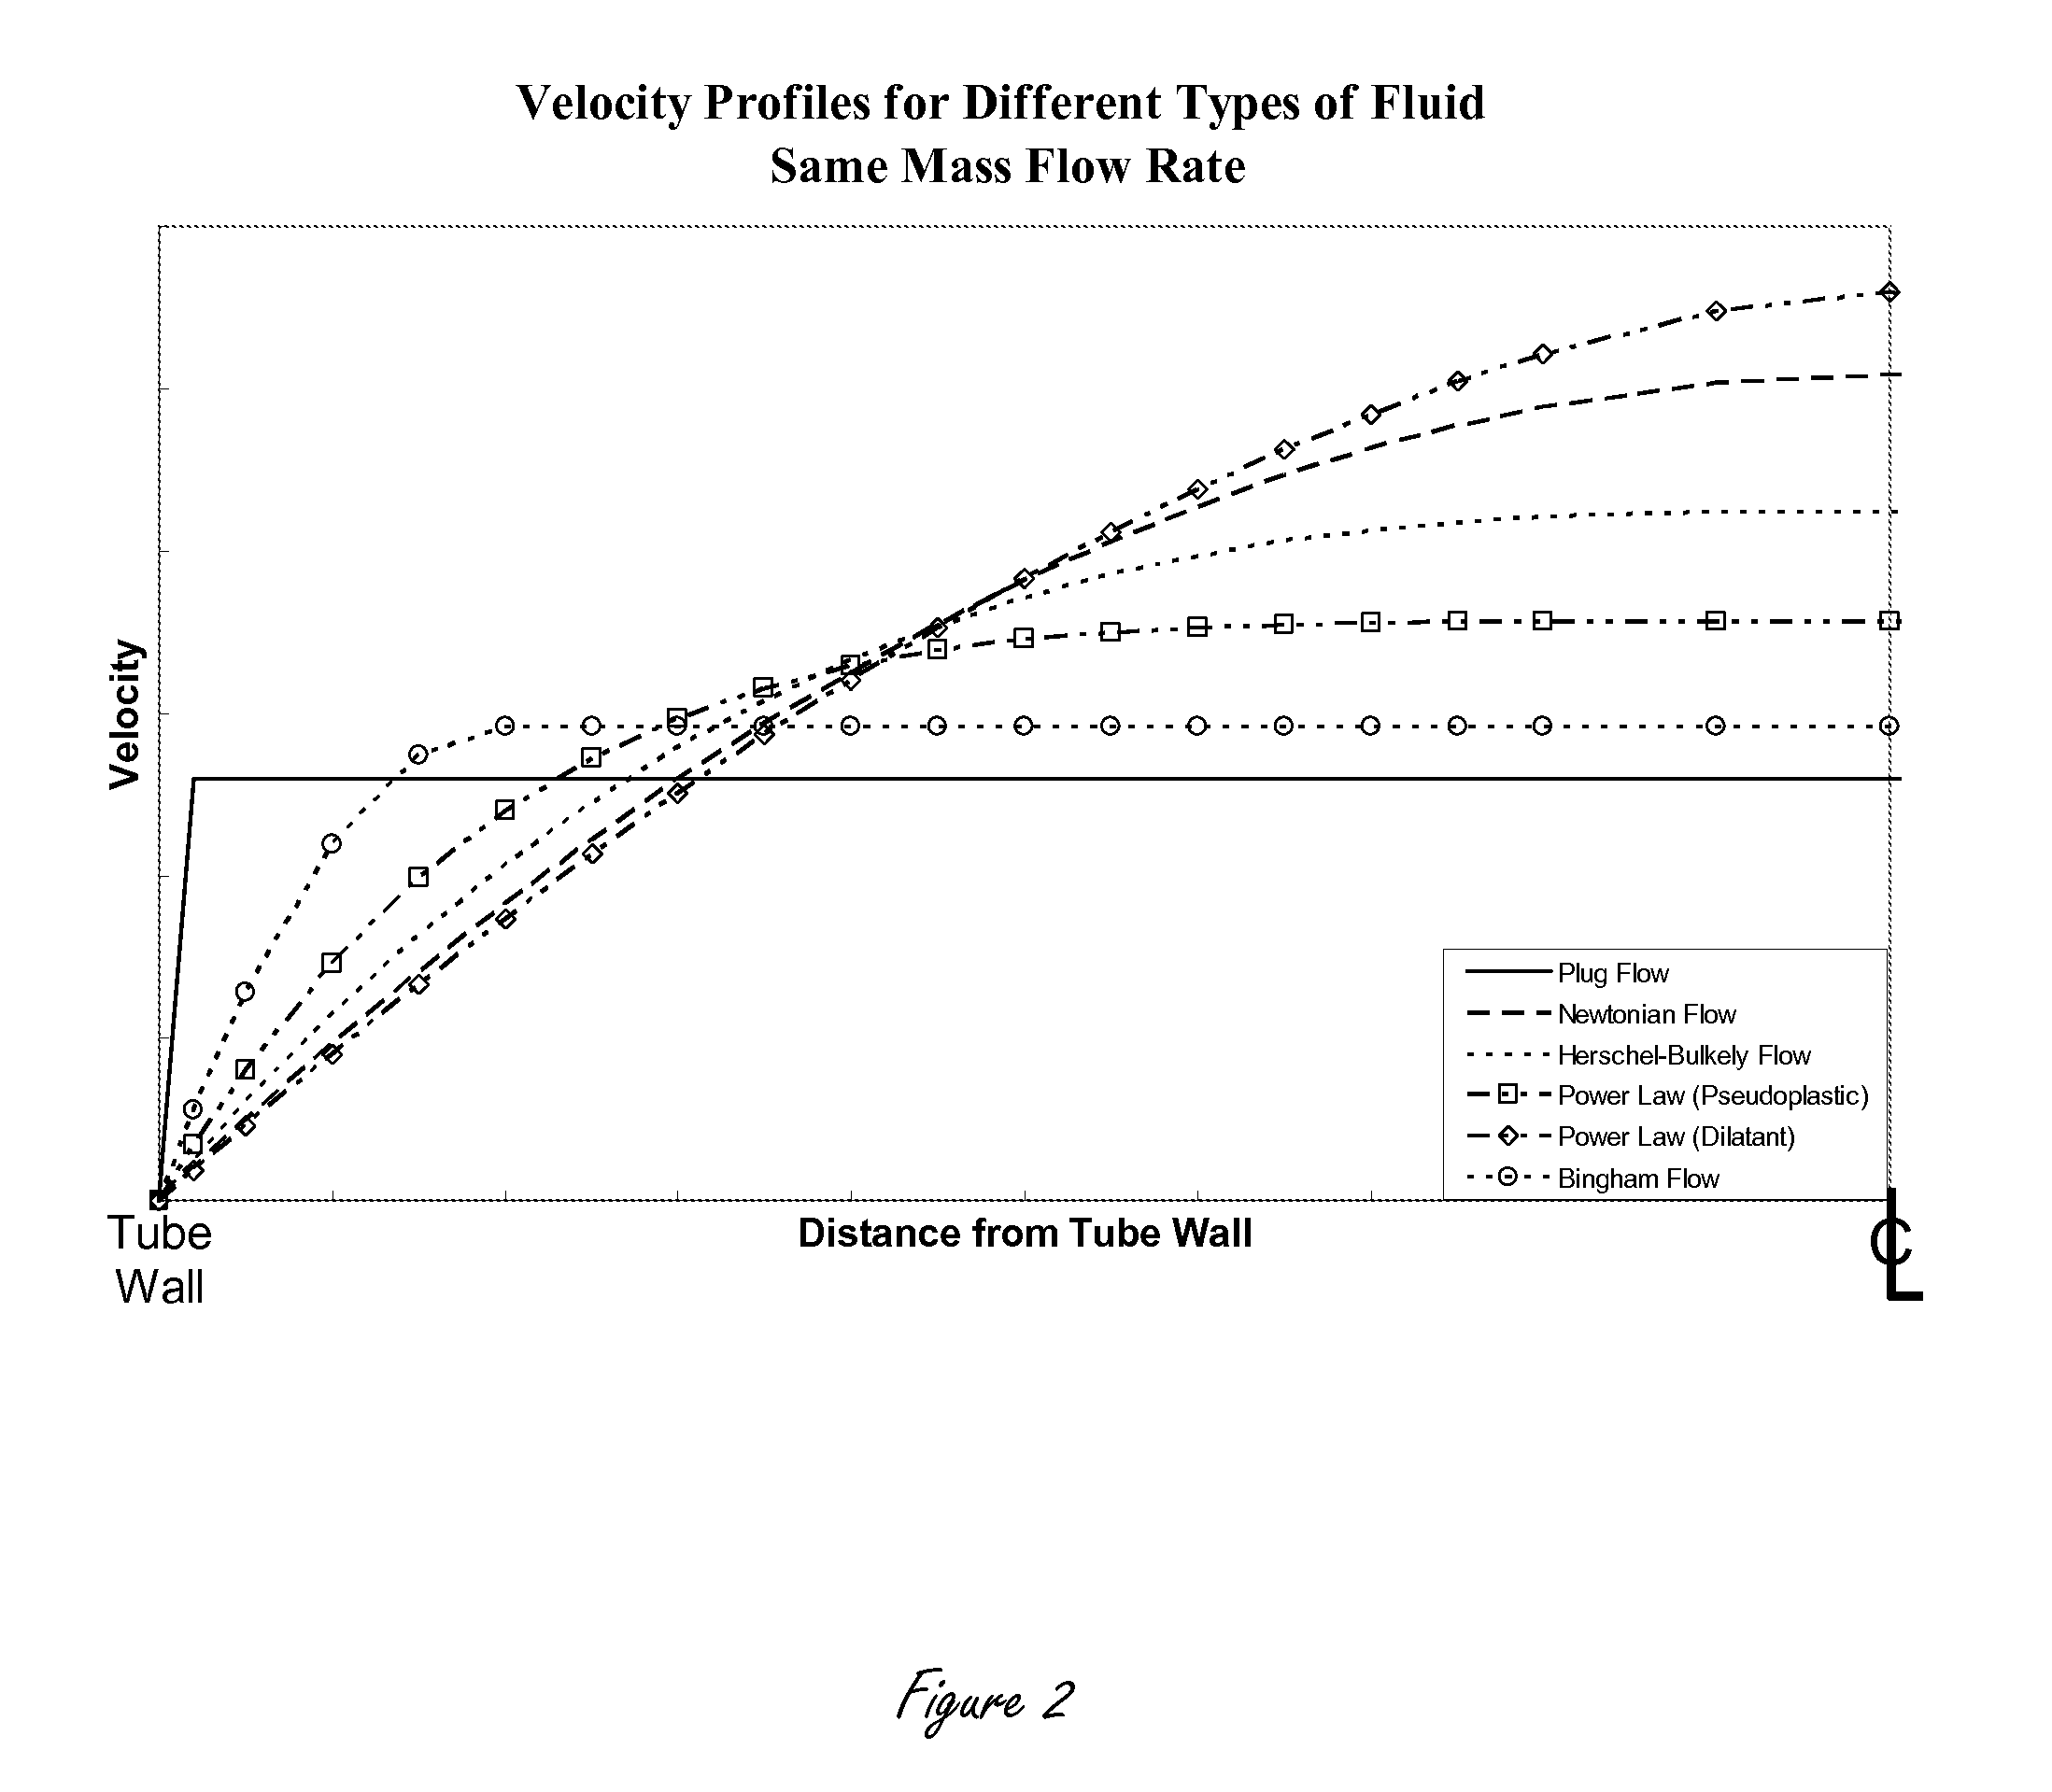
Examples
example 1
Comparison Between Power Law Exponent in a Flowing Fluid and Power Law Exponent Stored in a Database
[0102]FIG. 8A illustrates in a non limiting manner and in an out of scale fashion a 2D slice through a flow front, showing the velocity as a function of position across the tube. The solid line (810) shows the actual velocity, while the dashed line (820) shows the expected velocity for the material, as stored in a database.
[0103]FIG. 8B depicts a graph of the power law exponent n as a function of position across the tube, as derived from the velocity curves and the pressure data, as described hereinabove. The exponent n is a constant, 0.85, for the stored database fluid (822). It averages about 0.85 for the actual fluid (812), but varies from about 0.89 near the center of the tube to about 0.8 at the edges of the tube. FIG. 8C plots the difference, showing clearly that the fluid is more Newtonian than the standard in the database at the center of the tube, but less so at the edges.
example 1i
Comparison Between Viscosity in a Flowing Fluid and Viscosity Stored in a Database
[0104]FIG. 9A illustrates, still in a non limiting manner and in an out of scale fashion, a 2D slice through a flow front, showing the velocity as a function of position across the tube. The solid line (910) shows the actual velocity, while the dashed line (920) shows the expected velocity for the material, as stored in a database.
[0105]FIG. 9B depicts a graph of the viscosity as a function of position across the tube, as derived from the velocity curves and the pressure data, as described hereinabove. The viscosity is a constant, 1000, for the stored database fluid (922). It averages about 1000 for the actual fluid (912), but varies from about 960 near the center of the tube to about 1060 at the edges of the tube. FIG. 9C plots the difference, showing clearly the deviations from the desired constant viscosity of the fluid in the tube.
PUM
| Property | Measurement | Unit |
|---|---|---|
| angles | aaaaa | aaaaa |
| rheological properties | aaaaa | aaaaa |
| volume | aaaaa | aaaaa |
Abstract
Description
Claims
Application Information