Quantitative analysis method for measuring target element in specimen using laser-induced plasma spectrum
a quantitative analysis and laser-induced plasma technology, applied in the direction of material analysis, spectrum investigation, instruments, etc., can solve the problems of deteriorating accuracy of calculated values and inability to select optimal peak, so as to improve accuracy and reproducibility.
- Summary
- Abstract
- Description
- Claims
- Application Information
AI Technical Summary
Benefits of technology
Problems solved by technology
Method used
Image

Examples
example 1
Selection of Optimal Peak by Correlation Plot
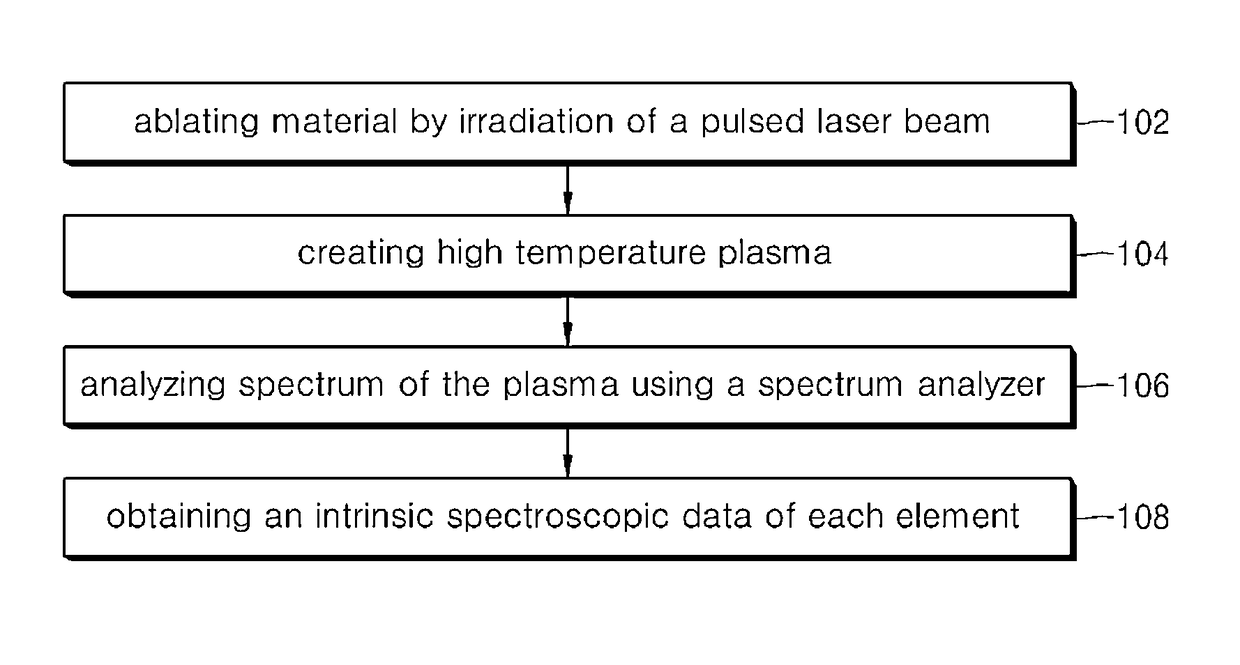
[0060]Plasma was generated by irradiating specimens having ratios of In to Cu (In / Cu), which were respectively 0.726, 0.666, 0.534 and 0.492 through X-ray fluorescence analysis, with a laser energy beam while changing laser energy, and spectra generated from the plasma were obtained.
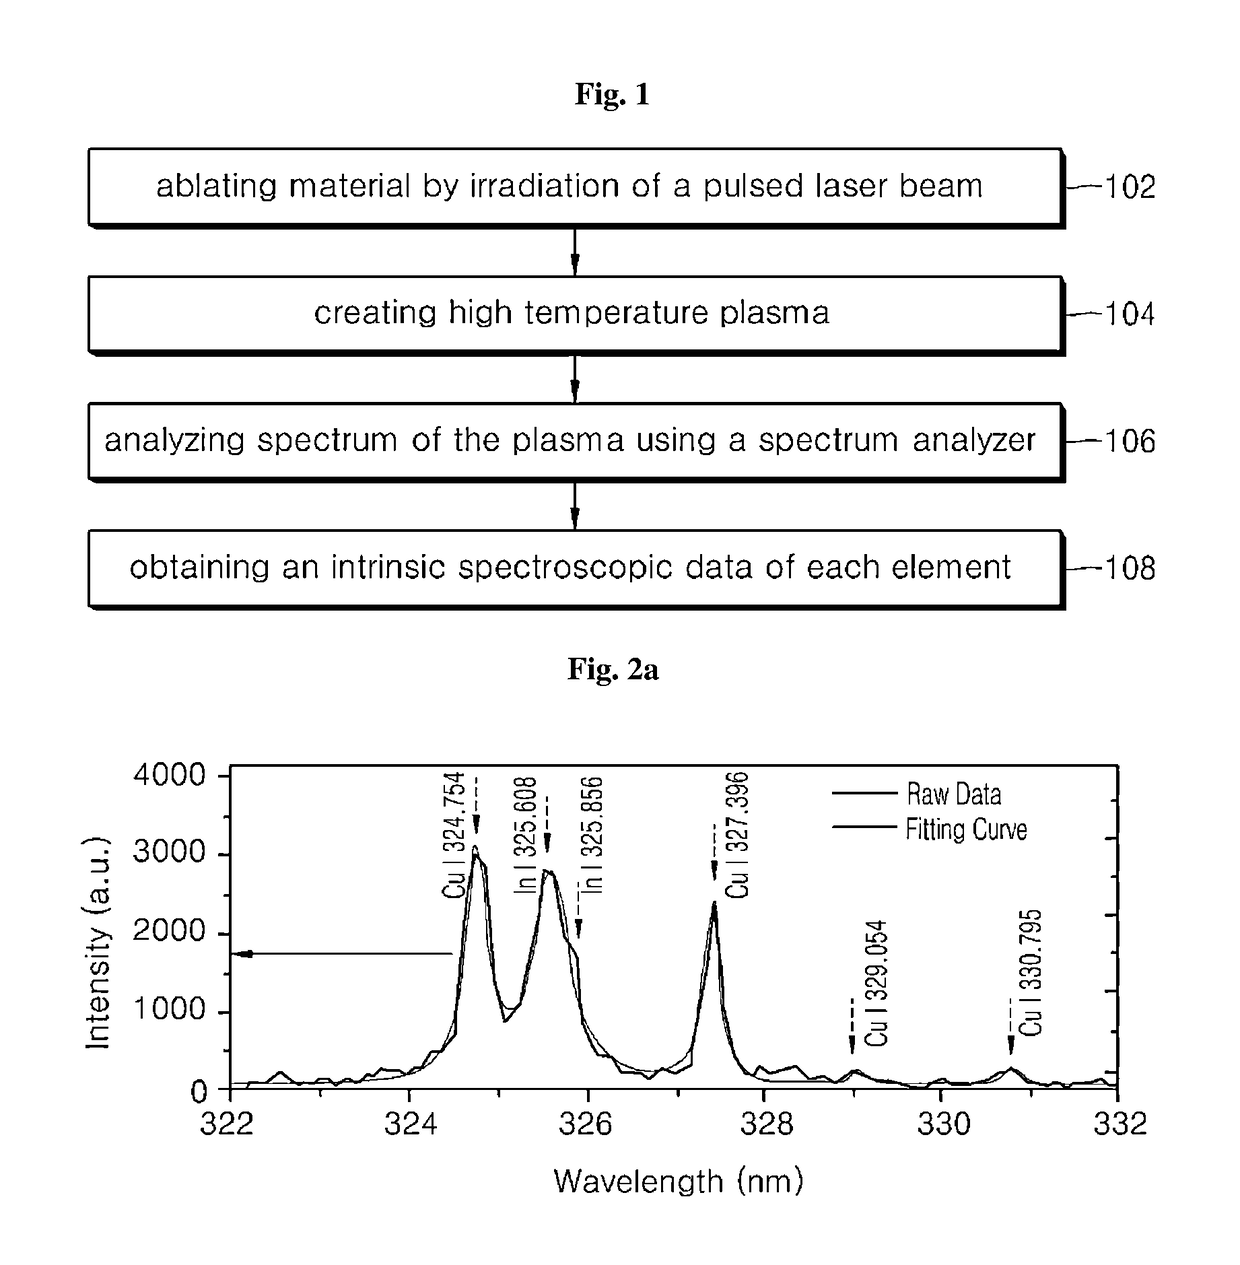
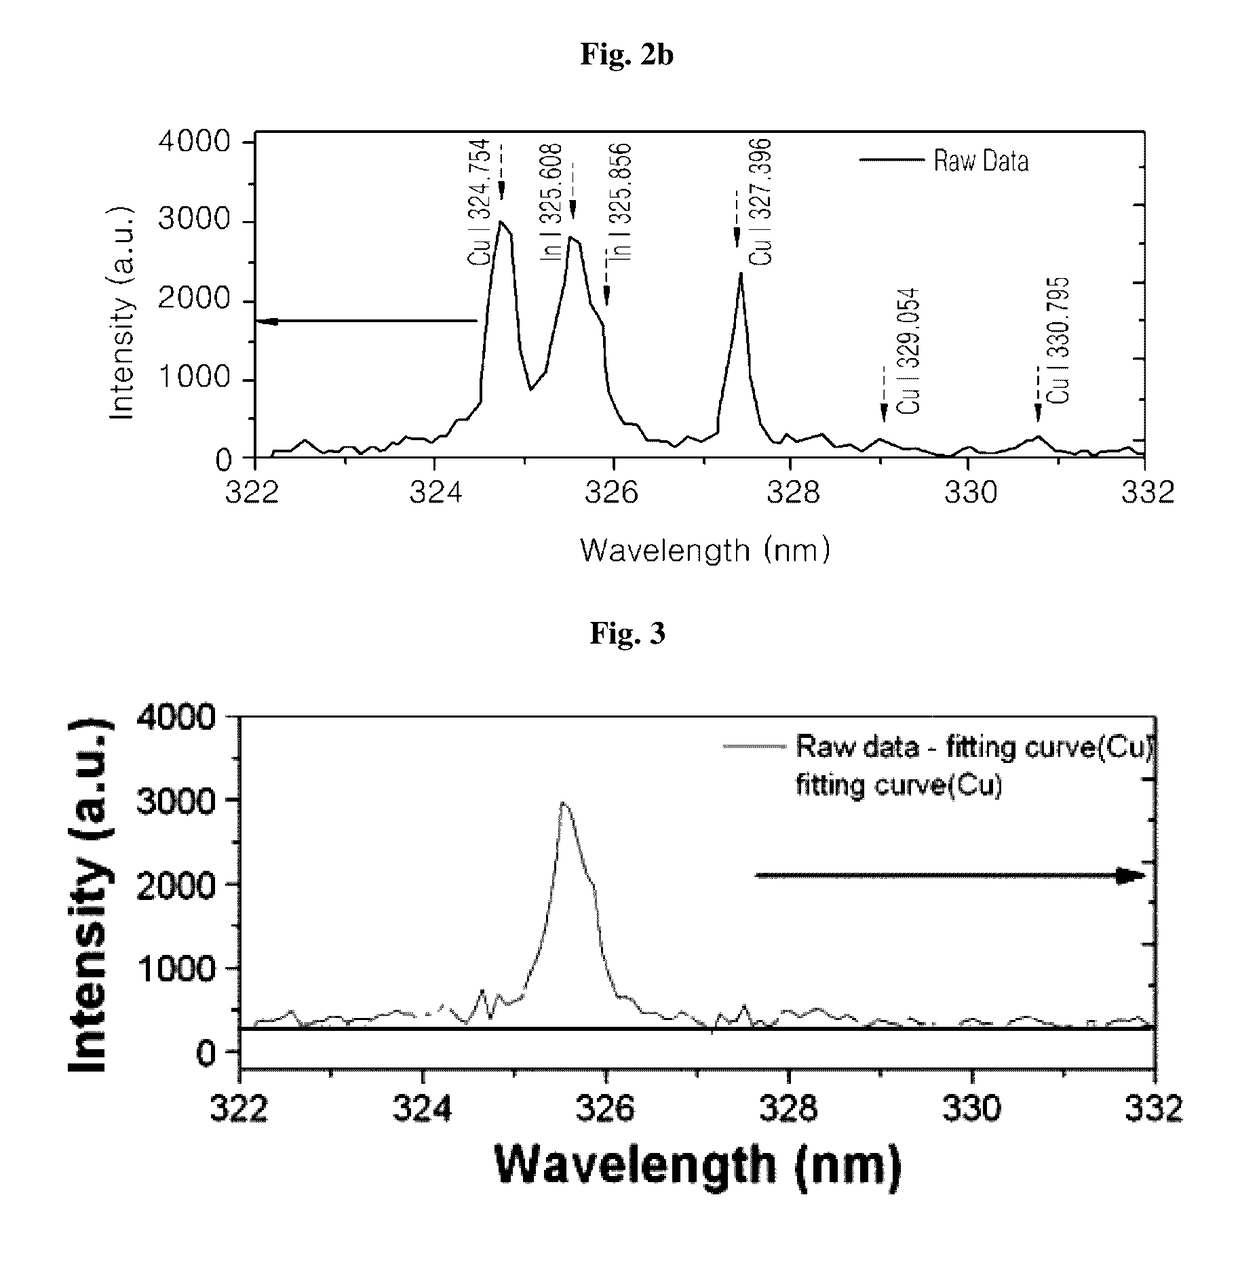
[0061]In addition, as described above, a Cu peak fitting curve and an In peak curve were individually obtained from overlapping peaks, and each of peak intensities was calculated.
[0062]Then, after a correlation plot between Cu and In peak intensities was obtained and adjusted to coincide with a straight line passing through an origin point, a coefficient of determination R2, a slope of the straight line, and a slope change depending on laser energy change (refer to Equation 3) were calculated. Calculated results are shown in Table 1.
[0063]
TABLE 1In / CuratioCu wavelengthIn wavelengthSlopeby XRF(nm)(nm)R2Slopechange (%)In / Cu =219.975303.9350.9262.77114.00.726219....
example 2
Selection of Optimal Peak by Calibration Curve
[0067]Plasma was generated by irradiating specimens having ratios of In to Cu (In / Cu), which were respectively 0.726, 0.666 and 0.534 through X-ray fluorescence analysis, with a laser beam while changing laser energy, and spectra generated from the plasma were obtained.
[0068]In addition, as described above, a Cu peak fitting curve and an In peak curve were individually obtained from overlapping peaks, and each peak intensity was calculated.
[0069]Values of
[0070]σRiS
were calculated from a calibration curve showing relation between the ratio of In to Cu (In / Cu) confirmed through X-ray fluorescence analysis and the peak intensity ratio calculated from the In and Cu curves as shown in Table 2.
[0071]
TABLE 2σRiSCuInσRiσRiσRiLaserwavelengthwavelength(In / Cu = 0.726)(In / Cu = 0.660)(In / Cu = 0.534)energy(nm)(nm)Δ Rc = 0.066Δ Rc = 0.126Δ Rc = 0.0421.56 mJ213.598303.9350.03440.08060.0490(8.80 J / cm2)217.894303.9350.05080.07360.0562224.700303.9350.03880...
example 3
Correlation Plot Depending on Peak Intensity of Optimal Wavelength
[0077]To confirm consistency of the correlation plot, spot sizes or stage positions were adjusted. As the spot sizes or stage positions are adjusted, energy density varies.
[0078]FIGS. 6a and 6b shows correlation plots of peak intensities at selected optimal wavelengths (Cu: 324.754 nm, In: 325.608 nm), and it can be seen that the peak intensity ratio is not affected by experimental variables such as energy densities, and the like.
[0079]FIGS. 7a and 7b shows correlation plots of peak intensities at random wavelengths (Cu: 327.396 nm, In: 451.608 nm), and it can be seen that the peak intensity ratio is greatly affected by the experimental variables such as energy densities, and the like.
[0080]Therefore, at the selected optimal wavelengths, constant results can be derived despite differences of the experimental variables, and reproducibility of composition analysis can be improved.
PUM
| Property | Measurement | Unit |
|---|---|---|
| Time | aaaaa | aaaaa |
| wavelengths | aaaaa | aaaaa |
| wavelengths | aaaaa | aaaaa |
Abstract
Description
Claims
Application Information
 - R&D
- Intellectual Property
- Life Sciences
- Materials
- Tech Scout
- Unparalleled Data Quality
- Higher Quality Content
- 60% Fewer Hallucinations
Browse by: Latest US Patents, China's latest patents, Technical Efficacy Thesaurus, Application Domain, Technology Topic, Popular Technical Reports.
© 2025 PatSnap. All rights reserved.Legal|Privacy policy|Modern Slavery Act Transparency Statement|Sitemap|About US| Contact US: help@patsnap.com