Well testing apparatus and methods for measuring the properties and performance of oil and gas wells

a technology for oil and gas wells and testing equipment, applied in the direction of instruments, surveying, borehole/well accessories, etc., can solve the problems of low production reduction, achieve the effect of reducing production, simplifying valve control, and enhancing accuracy

Active Publication Date: 2017-04-04
SINTEF TTO AS +1
View PDF23 Cites 2 Cited by
  • Summary
  • Abstract
  • Description
  • Claims
  • Application Information

AI Technical Summary

Benefits of technology

[0018]The amplitude of the oscillations should be set to ensure that the frequency analysis provides results that can be distinguished from the baseline amplitude of variations of the production waveform, for example the amplitude may be set to be an order of magnitude higher than the amplitude for the selected frequency range in a normal production waveform. The amplitude of the input oscillations may be in the range of 10-10000 Sm3 / h, preferably 50-1000 Sm3 / h. Production constraints may set a maximum for the amplitude, since an increase in amplitude can give rise to a decrease in production. The method may include determining a baseline amplitude for the selected frequency range by determining a line of best fit for the frequency / amplitude data, for example by a least squares analysis. The amplitude for the input oscillations may then be set to be at least five times larger than the baseline, preferably ten times larger. All the oscillations may be applied at the same amplitude, which could for example be a factor larger than the average baseline amplitude for all frequencies. This simplifies control of the valves (or other mechanism) used to apply the oscillations. However, in one preferred embodiment the amplitudes for each test frequency are scaled to match the baseline amplitudes at the test frequencies. This can enhance accuracy whilst avoiding unnecessary loss in production. It allows the accuracy to be set to a desired minimum based on the baseline amplitudes, without introducing unnecessarily large amplitudes.
[0019]The minimum sampling time sets a minimum time for the well test process. The total time for the test time may be set at this minimum. This provides the quickest test, which could advantageously be used for regular monitoring of wells whilst minimising production losses. It may however also be beneficial to apply the oscillations for a longer period in order to provide a more accurate set of results. If the input waveform was repeated for the entire test time then the accuracy of the frequency analysis would not be affected by increasing the sampling time. However, in practice there will be variations in the production waveform and intermittent events occurring during production that will introduce noise into the waveform. As a result a longer sampling time allows the testing to smooth out such variations and provide a better indication of the properties of the tested wells. Hence, the test time may be larger than the minimum sampling time, for example five or ten times larger. In a typical scenario even with a test time that is ten times the minimum testing period the test time will still be around half that required for a conventional build-up test.
[0020]In a preferred embodiment, the method includes applying oscillations to the well for a total test time in excess of the minimum sampling time, and then selecting a sampling time from the total test time for further analysis, the sampling time being shorter than the total test time. This enables the sampling time to be selected to avoid disturbances in the flow, for example as might be caused by shut-in of a well. Conversely, it also allows the oil field operator to proceed with required operations with minimal restrictions, since even if it is necessary to disturb the flow during a test period then the test can still provide useful results.

Problems solved by technology

Production continues via the production header throughout the course of the test, and although the applied oscillations will likely reduce the average flow rate the reduction in production is low compared to the reduction in production for a conventional test, such as a build-up test.

Method used


Image

  • Well testing apparatus and methods for measuring the properties and performance of oil and gas wells
  • Well testing apparatus and methods for measuring the properties and performance of oil and gas wells
  • Well testing apparatus and methods for measuring the properties and performance of oil and gas wells

Examples


Embodiment Construction

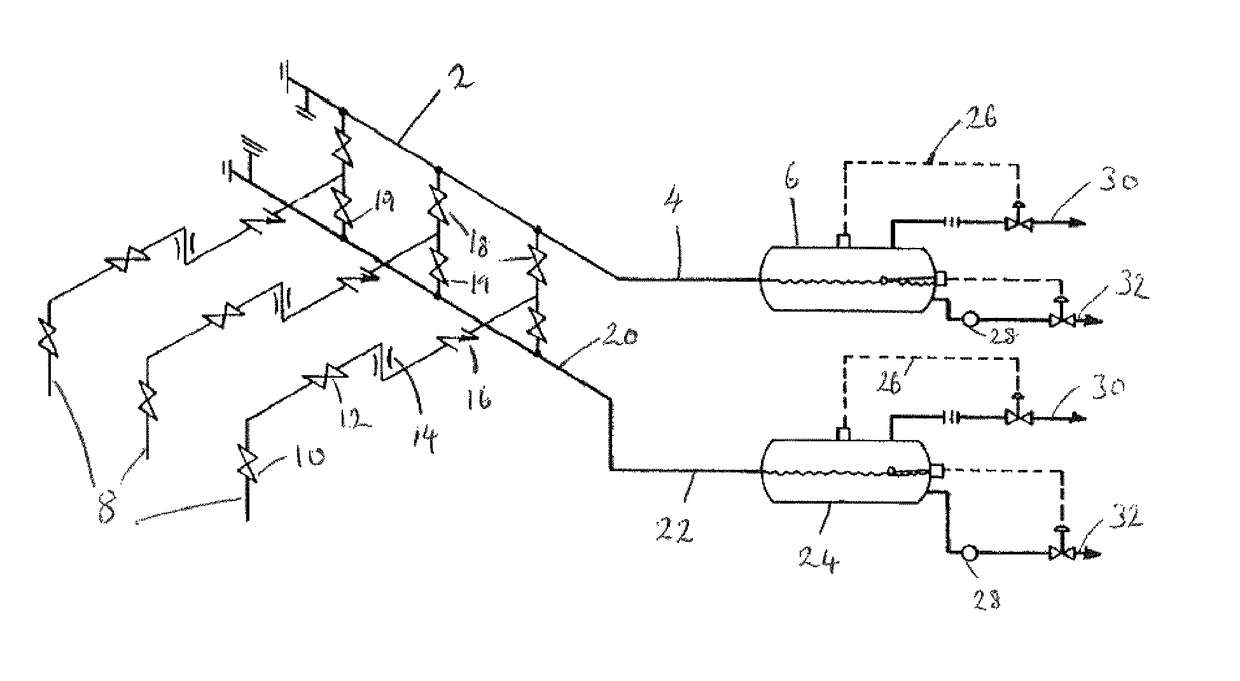
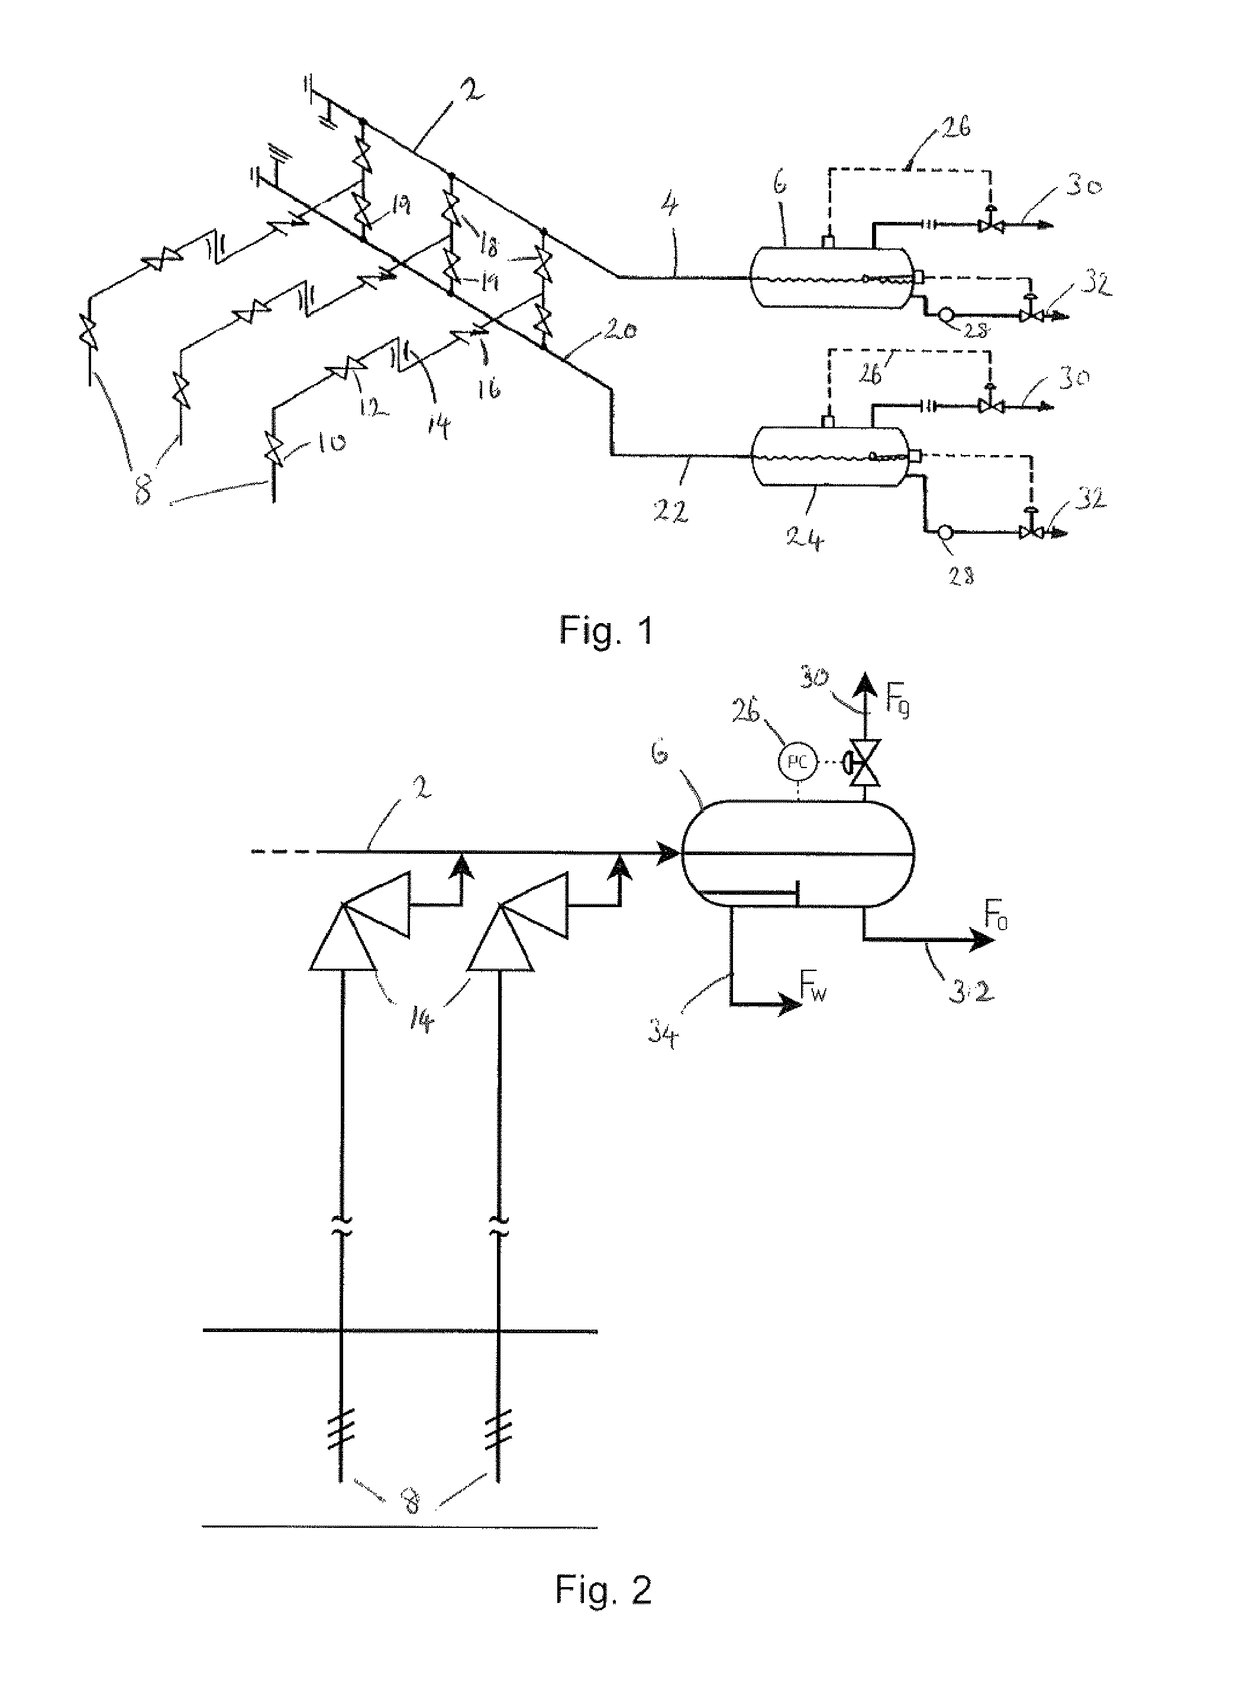
[0052]A typical setup for conventional well testing is shown in FIG. 1. A production header 2 connects via a production flow line 4 to a production separator 6. In this case the production header 2 is connected to three wells 8. The wells 8 in this example all draw oil and gas from the same oil field. Each well 8 is connected to the header by a master valve 10, wing valve 12, choke 14 and check valve 16. Isolation valves 18 connect the production header to the lines from the wells 8. The lines from the wells are also connected via another set of isolation valves 19 to a test header 20. The test header 20 is a dedicated header used only for testing purposes. It connects via a test flow line 22 into a test separator 24. The production separator 6 and test separator 24 are tanks that separate oil and gas. Under the influence of gravity the oil settles at the base of the tank, with the gas occupying the space at the top of the tank. Each separator 6, 24 is equipped with a pressure contr...


PUM


Abstract

To determine properties of multiple oil and gas wells, oscillations at different test frequencies are applied to the flow rate and/or pressure of multiple wells. Measurements of flow rate and/or pressure and temperature in flows downstream of a production header of the multiple wells are then obtained. Such measurements from the flows of the multiple wells are subjected to a frequency analysis of the pressure, flow rate and/or temperature measurements to determine pressure, flow rate and/or temperature variations induced by the applied oscillations. Properties of the different wells of the multiple wells based on the results of the frequency analysis are thus determined.

Description

CROSS-REFERENCE TO RELATED APPLICATIONS[0001]The present application is a U.S. National Phase filing of International Application No. PCT / EP2012 / 072897, filed on Nov. 16, 2012, designating the United States of America and claiming priority to British Patent Application No. 1119847.0, filed Nov. 17, 2011 and to Norwegian Patent Application No. 20111580, filed Nov. 17, 2011, and this application claims priority to and the benefit of the above-identified applications, which are all incorporated by reference herein in their entireties.BACKGROUND OF THE INVENTION[0002]The present invention relates to a well testing apparatus and a method of well testing, both being for determining properties of oil and gas wells.[0003]Well testing methods are used in the oil and gas industry to measure the properties of oil wells and to monitor ongoing performance of the wells. It is desirable to determine properties of a well such as gas-oil ratio (GOR), water cut (WC), skin, permeability thickness, pro...

Claims


Application Information

Patent Timeline
Patent Type & Authority Patents(United States)
IPC IPC(8): G01V11/00E21B47/10E21B49/00E21B47/06
CPCG01V11/00E21B47/06E21B47/065E21B47/10E21B49/008E21B47/07
Inventor ZENITH, FEDERICOTJONNAS, JOHANNESSCHJOLBERG, INGRIDFOSS, BJARNEGUNNERUD, VIDAR
Owner SINTEF TTO AS
Why Eureka
Try Eureka