Morphine quantitative and micro detection method
A detection method, morphine technology, applied in the field of quantitative and trace detection of morphine, to achieve the effect of less sample consumption, convenient detection and short time
- Summary
- Abstract
- Description
- Claims
- Application Information
AI Technical Summary
Problems solved by technology
Method used
Image

Examples
Embodiment 1
[0019] 1. Take 90mg of AgNO 3 Dissolved in 500mL of water to prepare AgNO with a mass percentage of 0.018% 3 Aqueous solution, when the aqueous solution was heated to 90°C, 10mL of trisodium citrate aqueous solution with a mass percentage of 1% was added dropwise, and stirred for 60min at the same time to obtain a green-yellow silver colloid.
[0020] 2. Put an appropriate amount of silver colloid into a centrifuge tube and centrifuge at high speed for 10 minutes, and remove the layer of high-concentration silver colloid for later use.
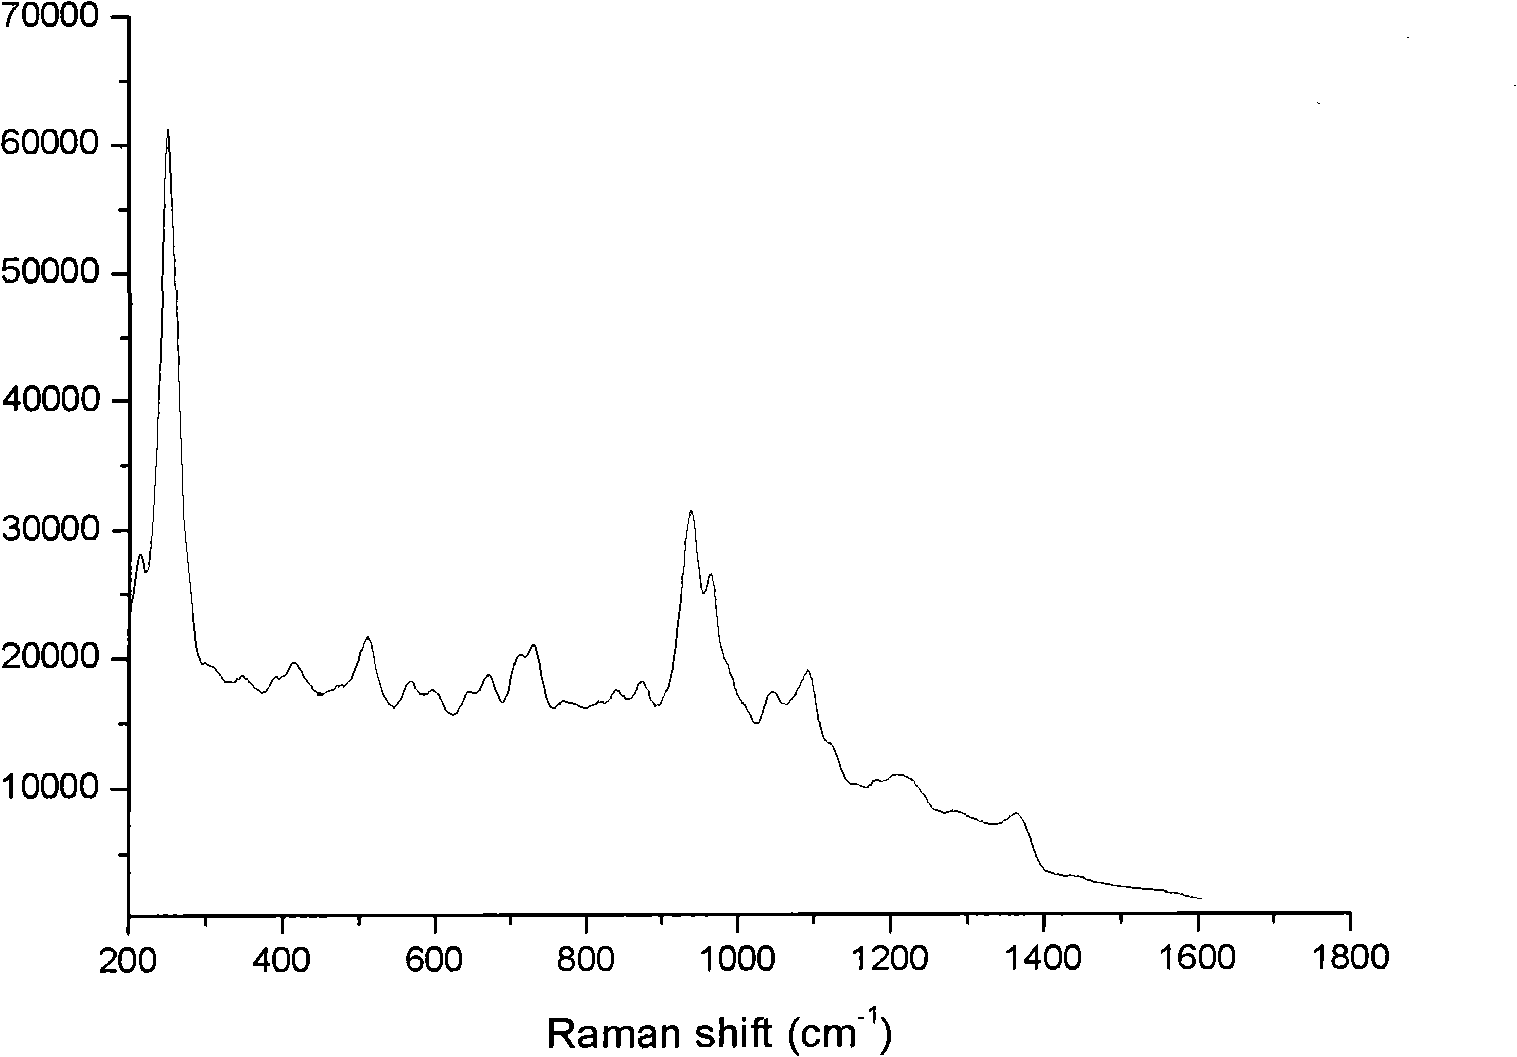
[0021] 3. Weigh 0.9mg of morphine, add it into a 1000mL volumetric flask, dilute to 1000mL with ultrapure water, and prepare a 900ng / mL morphine aqueous solution. Measure 5mL of the above-mentioned morphine solution and mix it with 5mL of high-concentration silver colloid. image 3 The morphine-silver colloidal SERS spectrum shown. After the morphine solution is mixed with the silver colloid, the obvious colloidal aggregation phenomenon in ...
PUM
 Abstract
Description
Claims
Application Information
 - Generate Ideas
- Intellectual Property
- Life Sciences
- Materials
- Tech Scout
- Unparalleled Data Quality
- Higher Quality Content
- 60% Fewer Hallucinations
Browse by: Latest US Patents, China's latest patents, Technical Efficacy Thesaurus, Application Domain, Technology Topic, Popular Technical Reports.
© 2025 PatSnap. All rights reserved.Legal|Privacy policy|Modern Slavery Act Transparency Statement|Sitemap|About US| Contact US: help@patsnap.com