

Method for synthesis and reconstruction of output signal of quadrature coil of MRI (magnetic resonance imaging) system
A technology of output signals and quadrature coils, which is applied in the field of synthesis and reconstruction of quadrature coil output signals in MRI systems, can solve problems such as inflexibility and inability to obtain synthesis effects, and achieve ideal image effects
- Summary
- Abstract
- Description
- Claims
- Application Information
AI Technical Summary
Problems solved by technology
Method used
Image

Examples
Embodiment Construction
[0034] The present invention will be further described in detail below in conjunction with the accompanying drawings and embodiments.
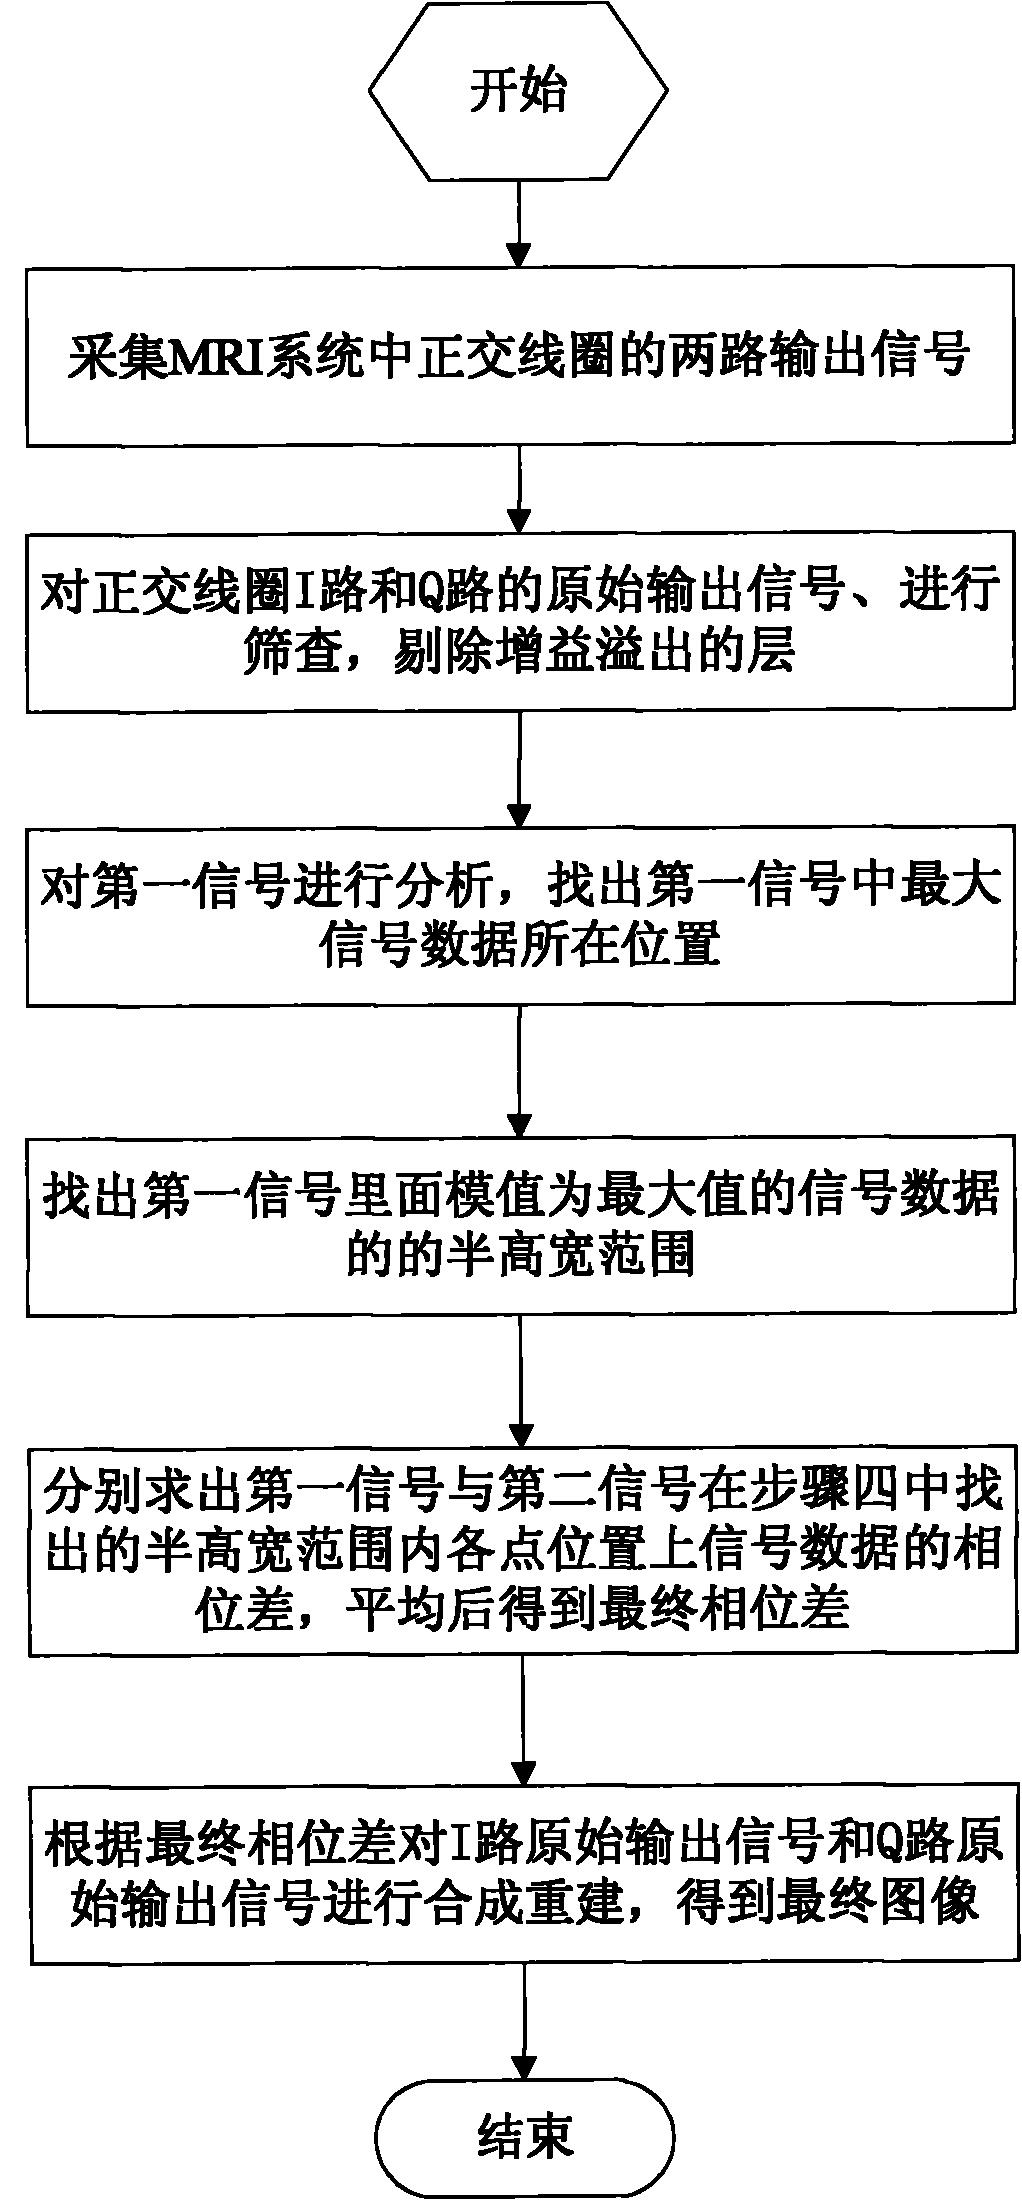
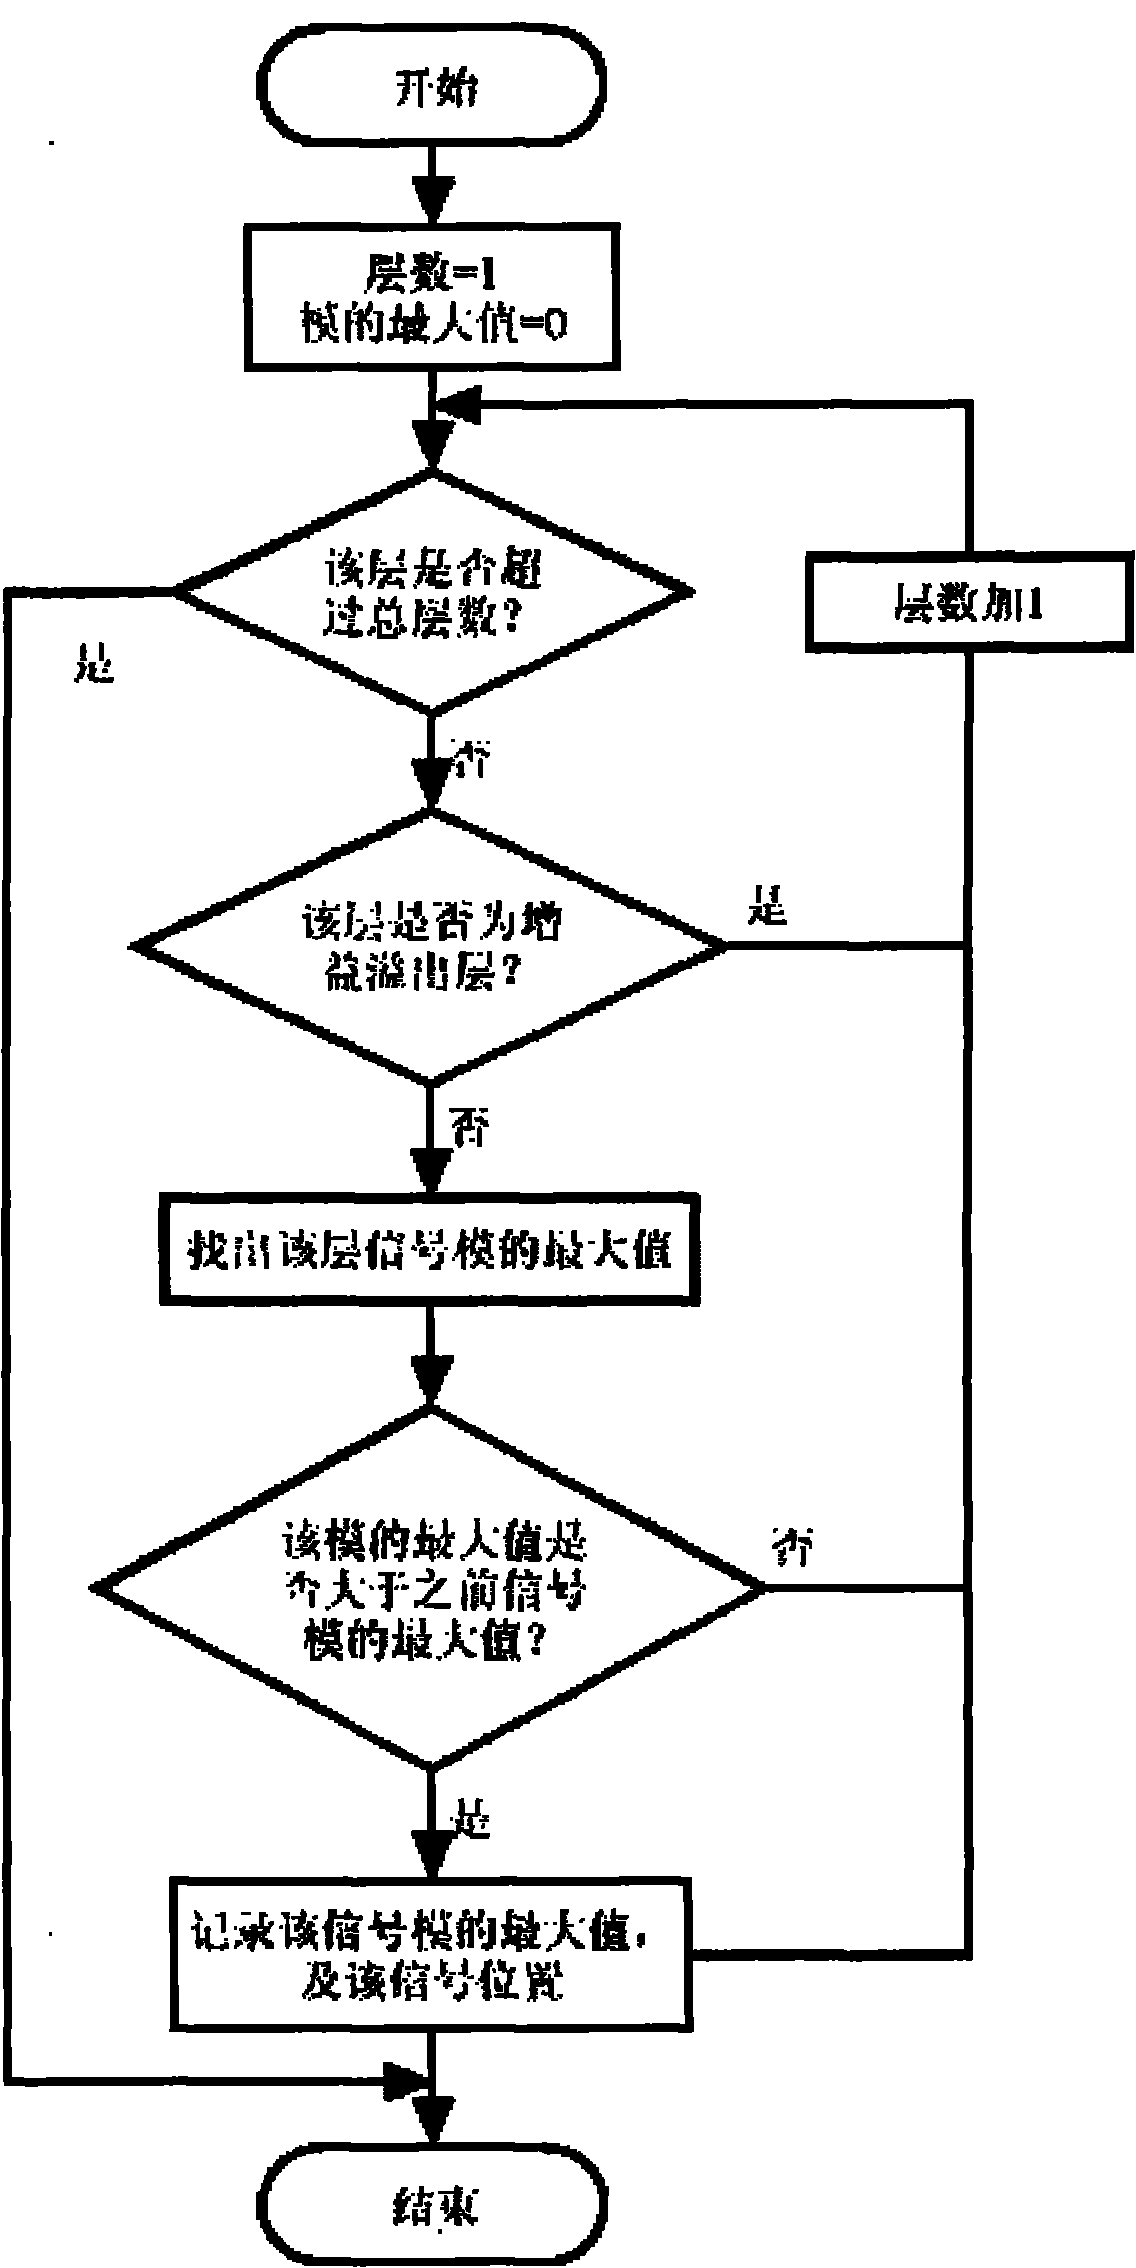
[0035] See figure 1 The synthetic reconstruction method of quadrature coil output signal in the shown MRI system, it comprises the following six steps:
[0036] Step 1. Collect two output signals of the quadrature coil in the MRI system:
[0037] The quadrature coils in the MRI system are denoted as I-path and Q-path respectively, and the magnetic resonance signals induced by the quadrature coil I-path and Q-path are respectively amplified and collected by their respective receivers to obtain the quadrature coil I-path respectively. The raw output signal S of 1 and the original output signal S of the quadrature coil Q circuit 2 ;
[0038] I original output signal S 1 and the Q original output signal S 2 Both are a two-dimensional data set. If the magnetic resonance signals obtained by the respective receivers contain n layers, then the I...
PUM
 Abstract
Description
Claims
Application Information