Method and system for making data charts

A technology of data charts and data, applied in the field of data charts, can solve the problems of writing a large number of codes and low efficiency of data charts, etc., and achieve the effect of improving efficiency

Active Publication Date: 2012-07-18
STATE GRID CORP OF CHINA +3
View PDF1 Cites 21 Cited by
  • Summary
  • Abstract
  • Description
  • Claims
  • Application Information

AI Technical Summary

Problems solved by technology

[0004] The technical problem to be solved in this application is to provide a method and system for making data charts, which is used to solv...

Method used


Image

  • Method and system for making data charts
  • Method and system for making data charts
  • Method and system for making data charts

Examples


Embodiment 1

[0072] Corresponding to the method provided in Example 1 of a method for making a data chart in this application, see Figure 4 This application also provides a system embodiment 1 for making data charts. In this embodiment, the system may include:

[0073] Data module 401, chart module 402, core module 403, business module 404 and view module 405;

[0074] among them:

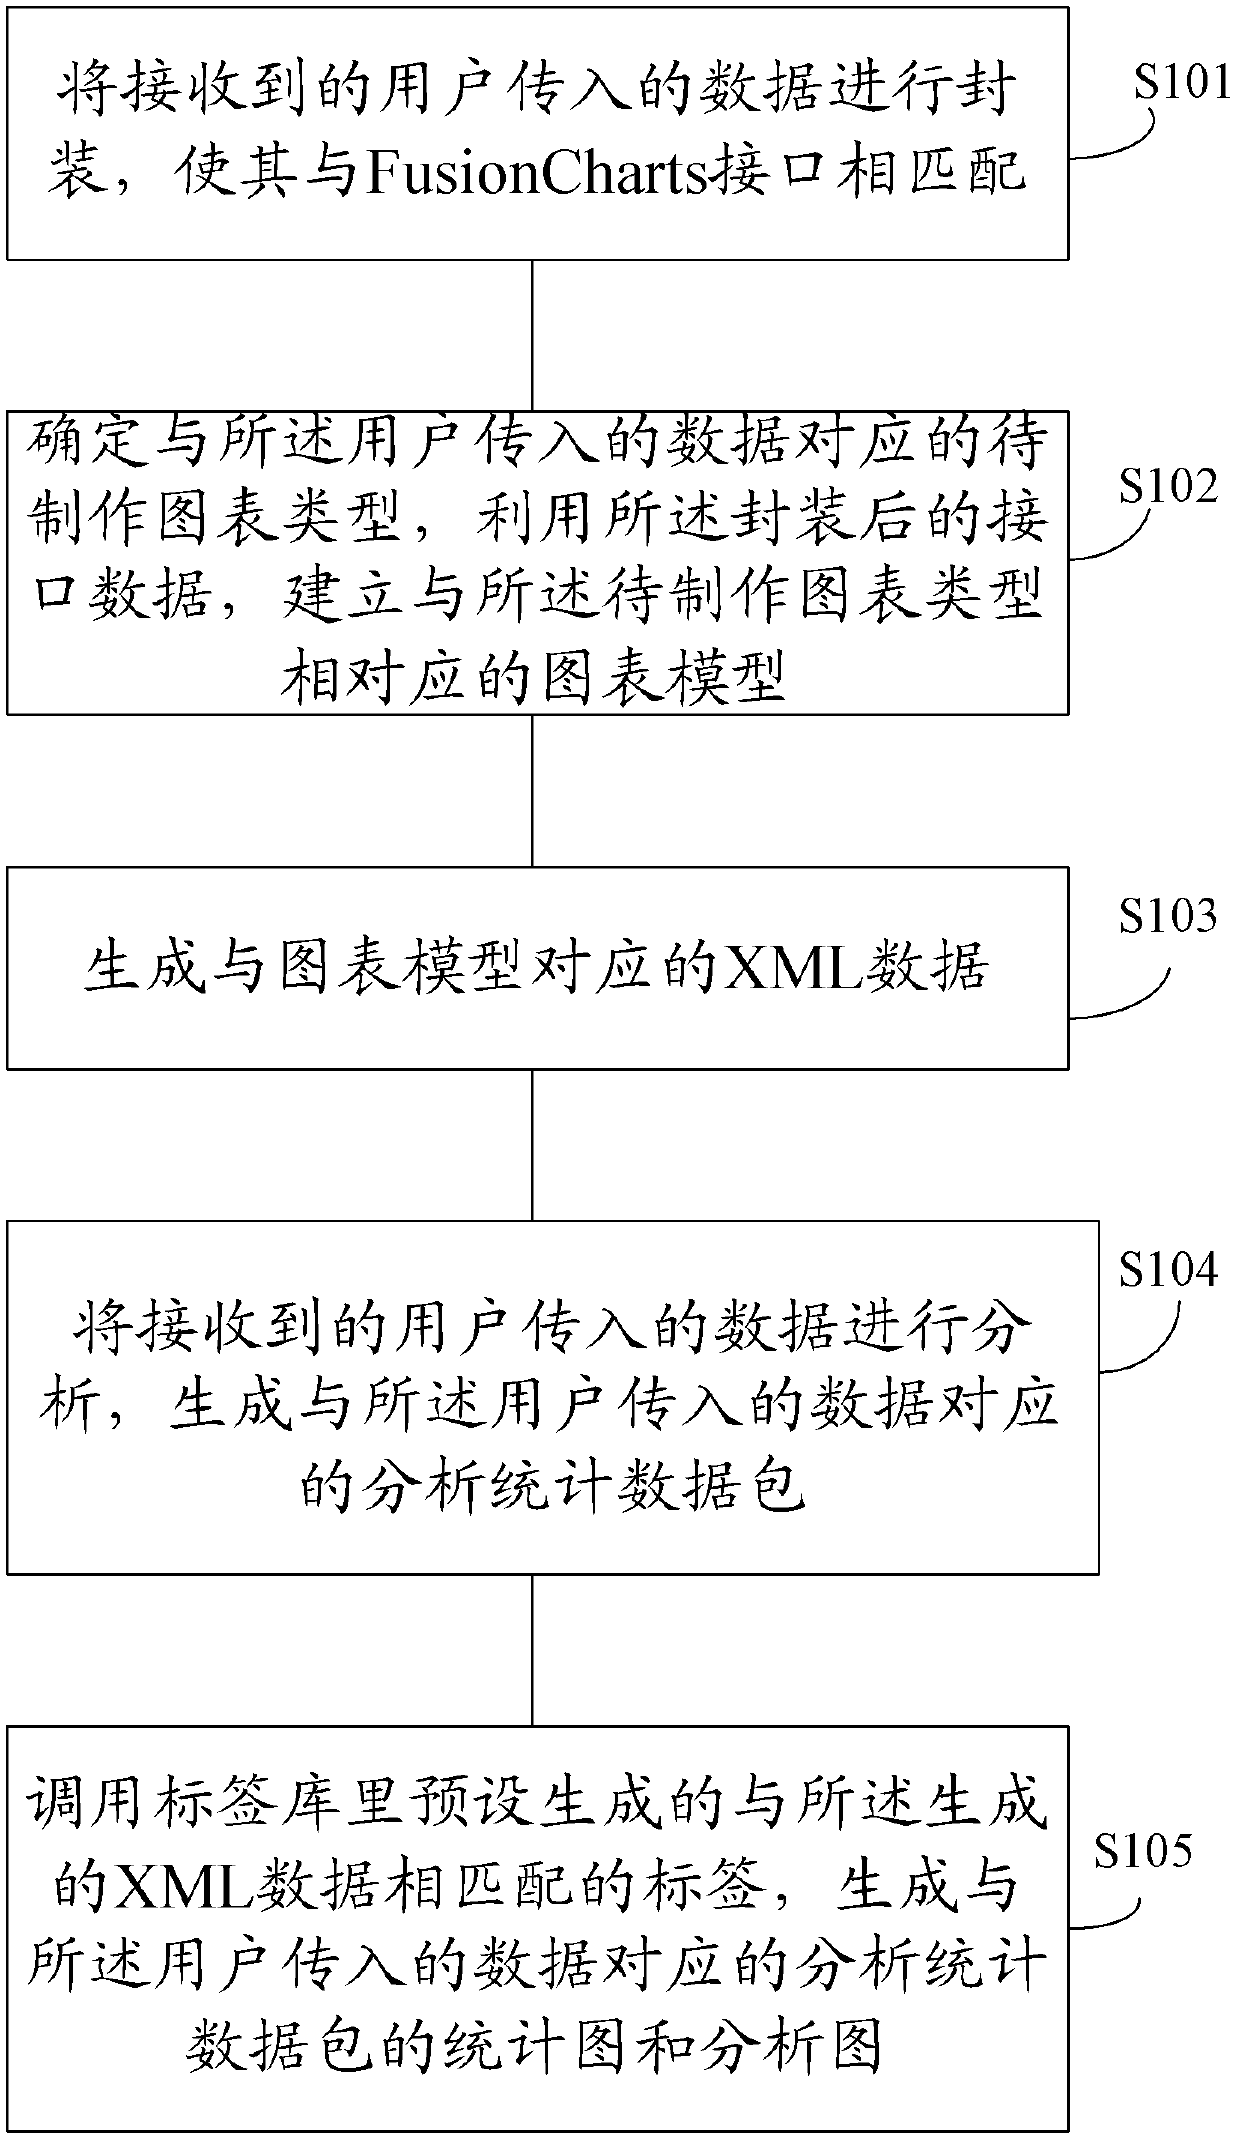
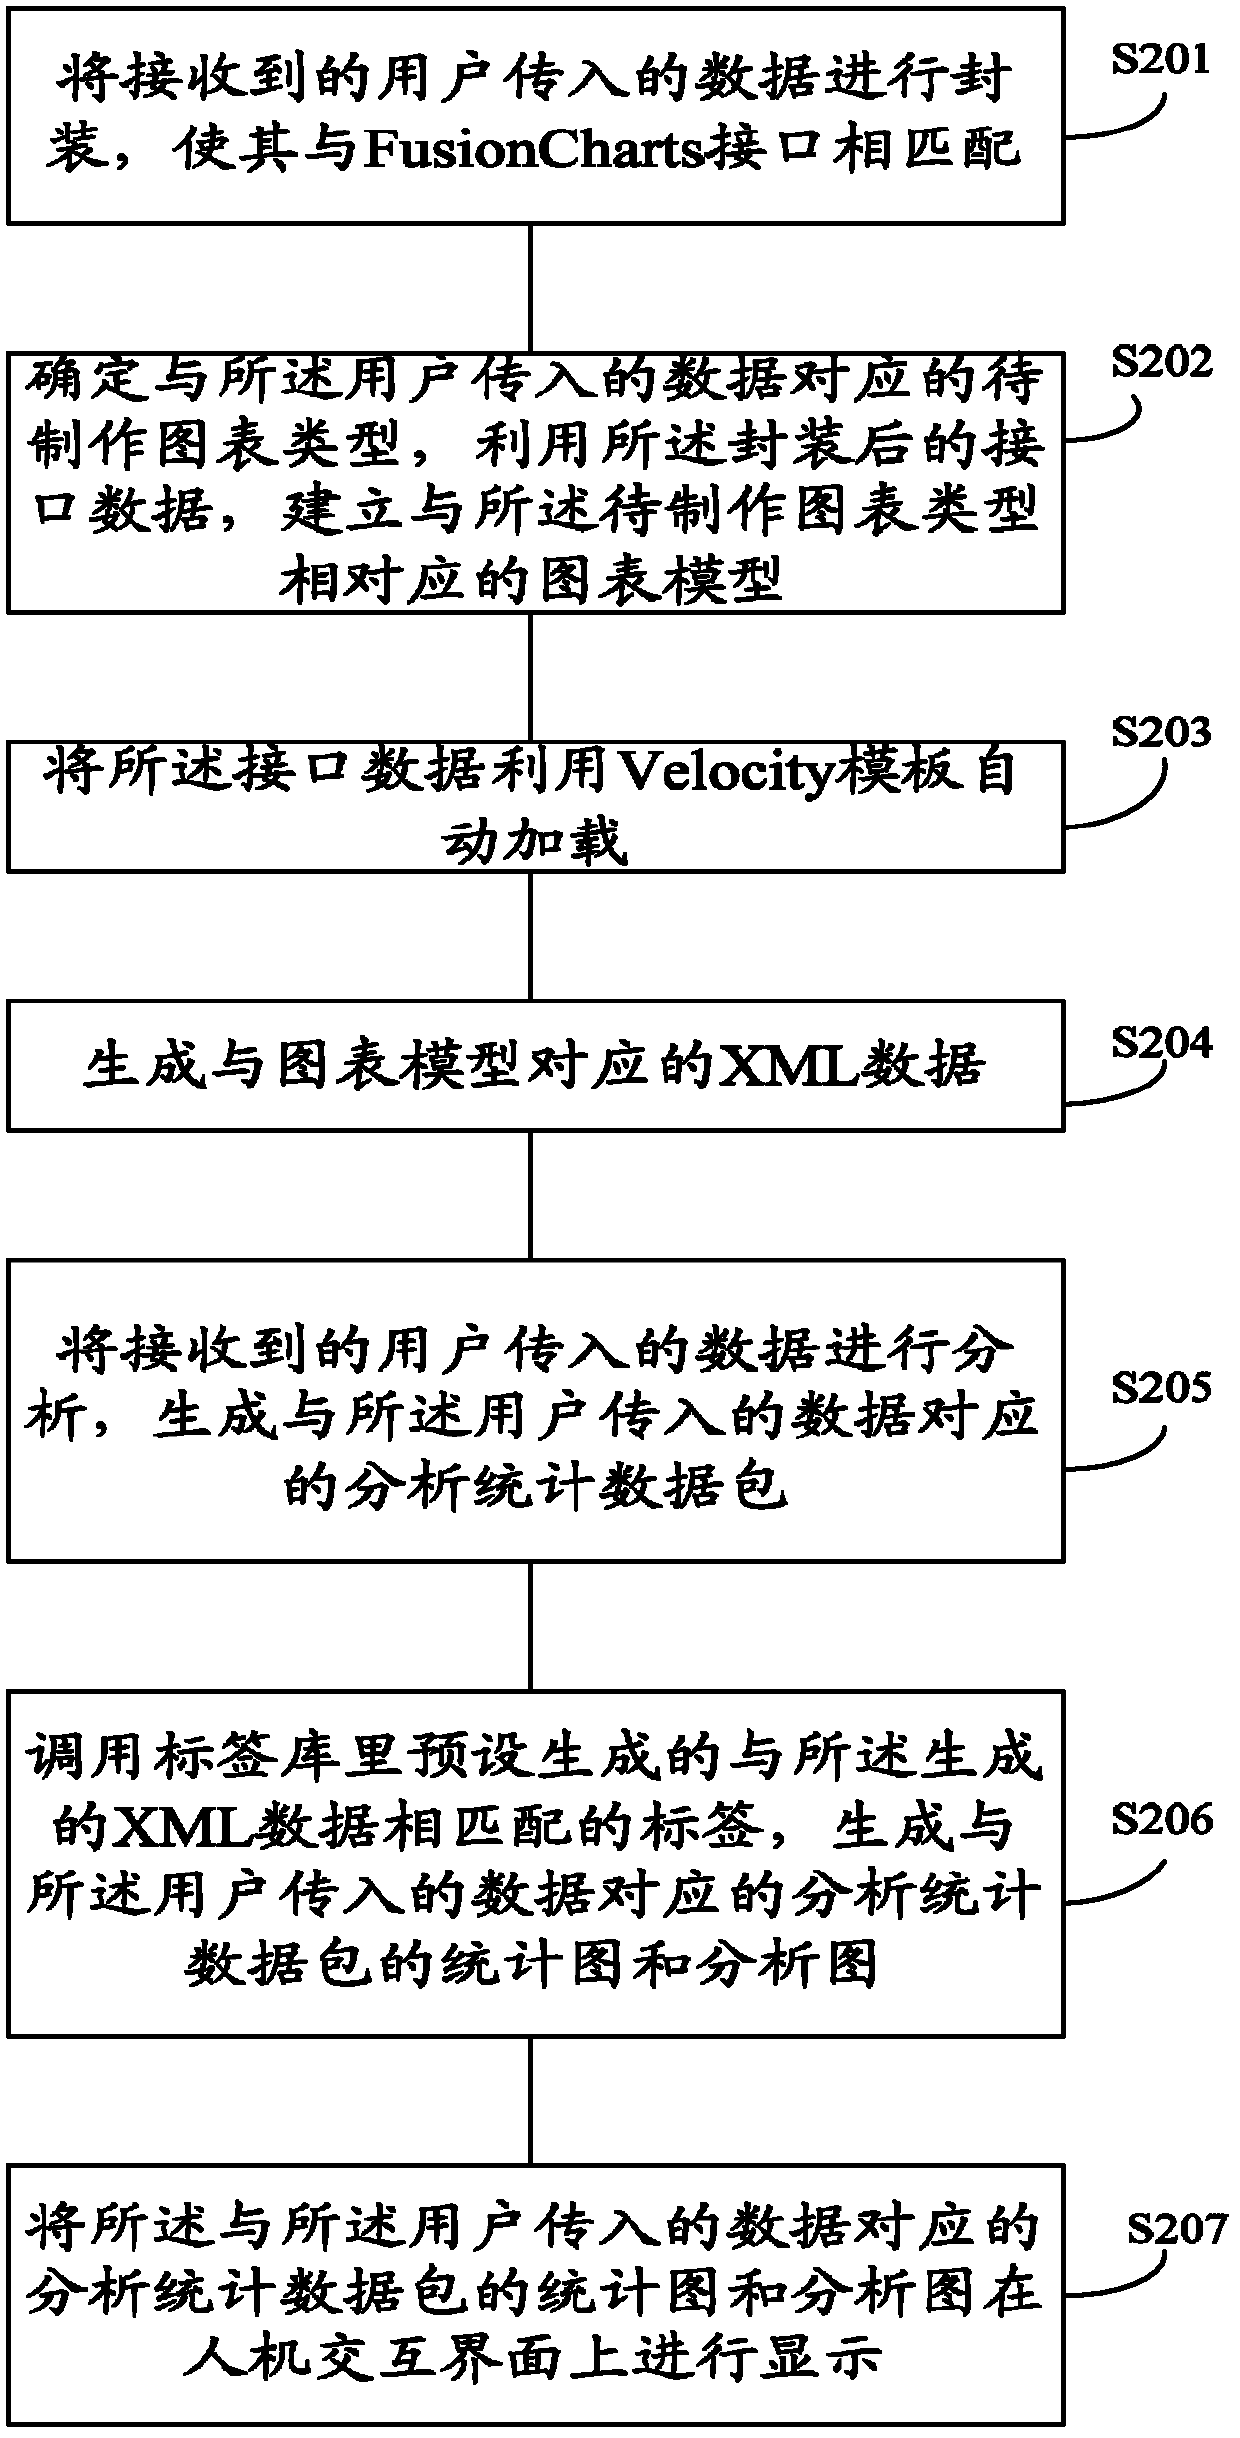
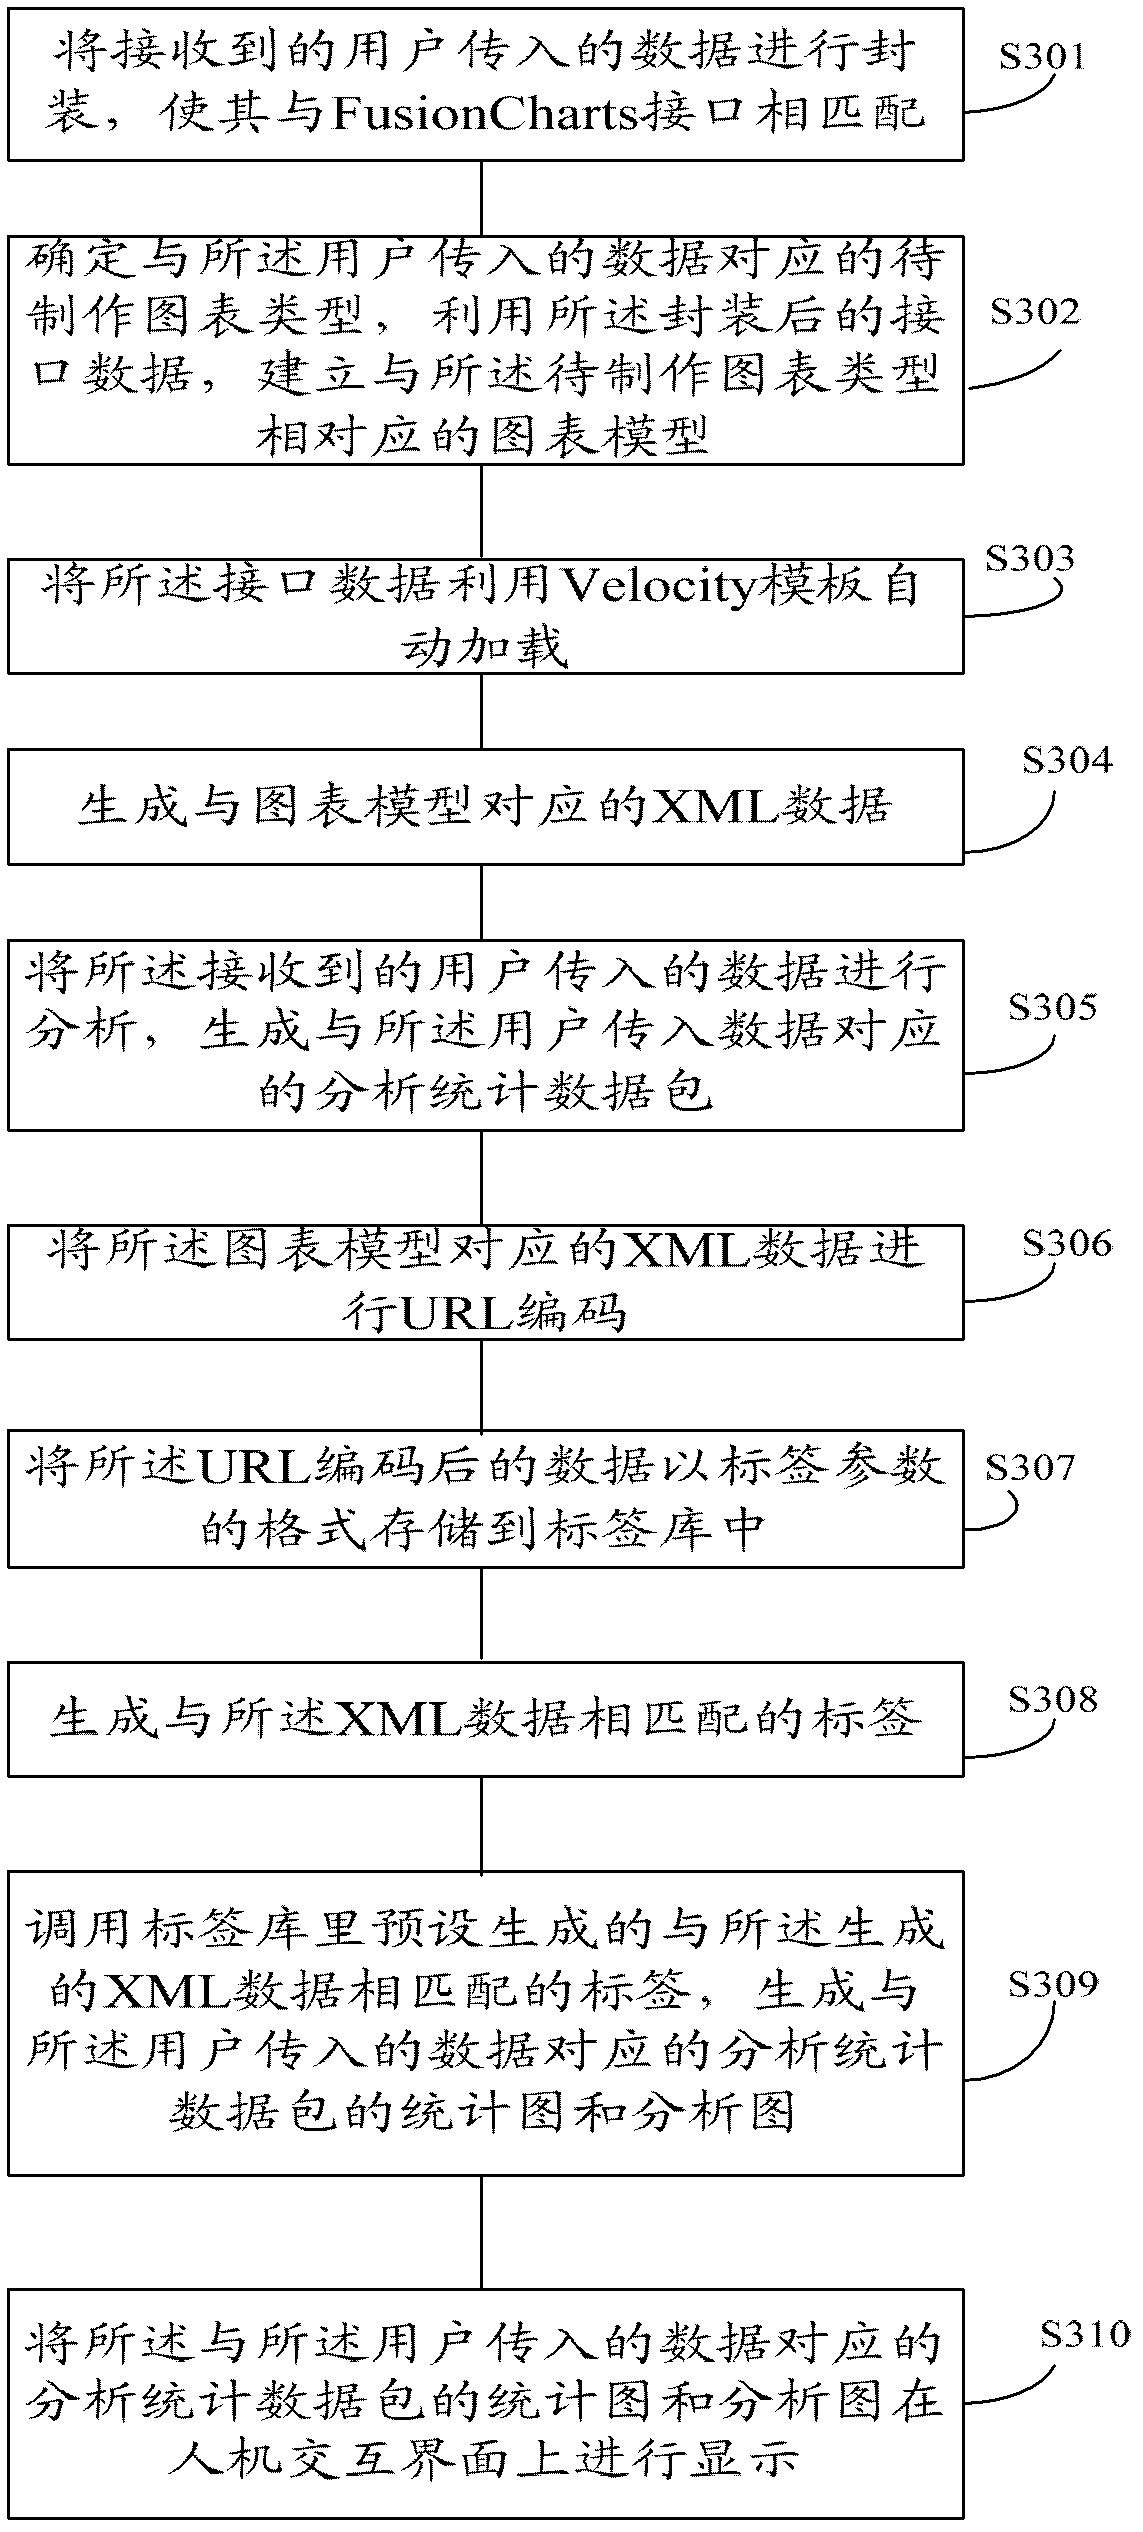
[0075] The data module 401 is used to encapsulate the received data passed in by the user so that the encapsulated data matches the FusionCharts interface;

[0076] The chart module 402 is configured to determine the chart type to be produced corresponding to the data input by the user, and use the encapsulated interface data to establish a chart model corresponding to the chart type to be produced;

[0077] The core module 403 is used to generate XML data corresponding to the chart model of the chart;

[0078] The service module 404 is configured to analyze the received data input by the user, and generate a statistical...


PUM


Abstract

The invention discloses a method and a system for making data charts. The method includes the steps: firstly, packaging received data transmitted by a user, and leading the packaged data to be matched with an interface of FusionCharts; secondly, determining a to-be-made chart type corresponding to the data transmitted by the user, and setting up a chart model corresponding to the to-be-made chart type by means of packaged interface data; thirdly, generating XML (extensible markup language) data corresponding to the chart model; fourthly, analyzing and making statistics on the received data transmitted by the user, and generating an analytic and statistical data packet corresponding to the data transmitted by the user; and fifthly, invoking a tag generated by default in a tag library and matched with the XML data, and generating one statistical chart and one analytic chart of the analytic and statistical data packet corresponding to the data transmitted by the user. By the aid of the method and the system in the embodiment, when the data charts are made, a business analytic and statistical function is added, editing of a great number of codes is reduced, and data chart making efficiency is improved.

Description

Technical field [0001] This application relates to the field of data charts, and in particular to a method and system for making data charts. Background technique [0002] JFreeChart is an open chart drawing library on the JAVA platform. It is completely written in JAVA language, and is designed for applications, applets, servlets, and a web technology based on Java language, JSP. JFreeChart can generate pie charts, bar charts, scatter plots, time series timing charts, Gantt charts, and many other charts, but the charts generated in this way are all static graphics and cannot complete the analysis and statistics function. , It's just a pure graphic display. [0003] FusionCharts is an animated Flash chart component. It can be used to make data animation charts. The animation effect is made by Adobe Flash 8. The scripting language of FusionCharts can be used for any web page is similar to the text markup language (Hypertext Markup Language, referred to as : HTML), Active Server P...

Claims


Application Information

Patent Timeline
IPC IPC(8): G06F17/30
Inventor 秦睿张文文余向前伍亮孙亚明汪红燕黄永卫肖鹏辉
Owner STATE GRID CORP OF CHINA
Why Eureka
Try Eureka