
Method for predicting medium-term and long-term power load on basis of logarithmical load density growth curve

A load density and power load technology, applied in the field of long-term power load forecasting, can solve the problems of large time span, large difference in load density, large error, etc., and achieve high accuracy

Active Publication Date: 2013-01-16
STATE GRID HUBEI ELECTRIC POWER RES INST +1
View PDF3 Cites 8 Cited by
  • Summary
  • Abstract
  • Description
  • Claims
  • Application Information

AI Technical Summary

Problems solved by technology

There have been relatively systematic studies in China, but there are still problems: the short-term load forecasting technology is relatively mature, but for the research on medium and long-term load forecasting, due to its large time span, wide area involved, and many factors such as national economic development, etc. The influence of the influence is greater, and its prediction difficulty is correspondingly greater, and the research on it is relatively insufficient; with the gradual standardization of urban planning in my country, the nature of urban land use in the future has basically been clarified, and the load density index method is widely used in the distribution network. It has been more and more widely used in planning engineering practice
However, the general practice of the traditional load density index method is to use the average load density of the same category in the entire planning area as the load density of each plot in the planning period. , the load density of a considerable part of the community is close to the average load density. It is relatively simple to apply this method. However, due to the different history or development stages of the load, even the load density of the same type of load is very different, so it is based on the unified classification of the average load density. The load of each community will inevitably cause non-negligible errors, and the use of this method for those communities with a large difference from the average load density will inevitably lead to large errors and low prediction accuracy

Method used


Image

  • Method for predicting medium-term and long-term power load on basis of logarithmical load density growth curve
  • Method for predicting medium-term and long-term power load on basis of logarithmical load density growth curve
  • Method for predicting medium-term and long-term power load on basis of logarithmical load density growth curve

Examples


Embodiment Construction

[0033] The technical solutions in the present invention will be clearly and completely described below in conjunction with the accompanying drawings in the present invention.

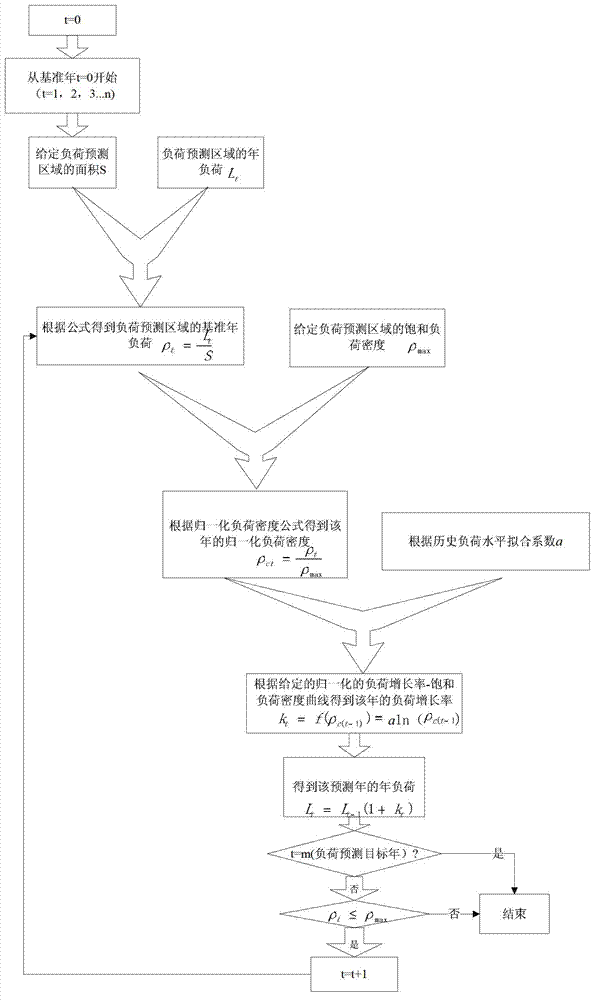
[0034] figure 1 Shown is a schematic flow chart of the medium and long-term power load forecasting method based on the logarithmic load density growth curve of the present invention, and the method includes the following steps:

[0035] (1) Saturated load density ρ in a given load forecast area max ;

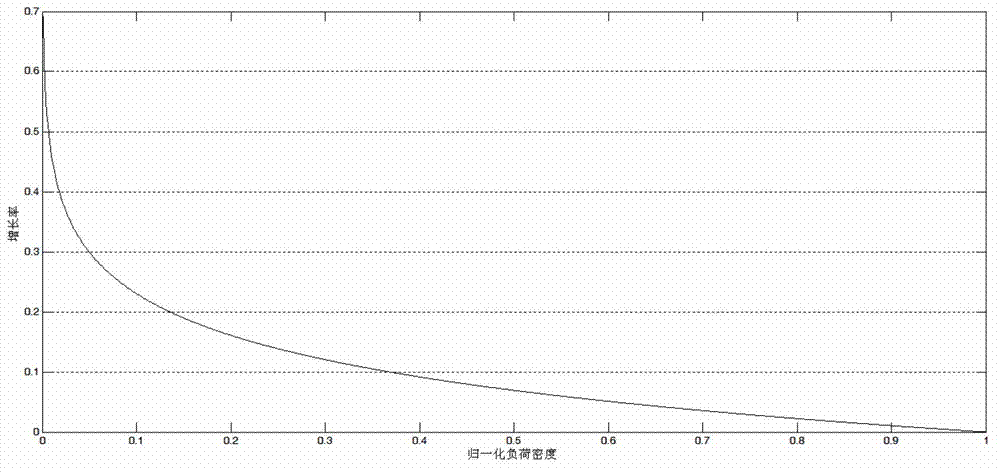
[0036] (2) Given the normalized load growth rate-saturated load density curve formula is as follows:

[0037] k=f(ρ c )=αln(ρ c )

[0038] Where k is the load growth rate, f is the given mapping relationship, α is the undetermined coefficient, ρ c For the normalized loading density:

[0039] ρ c = ρ ρ max

[0040] The load growth rate-saturated load density curve is a logarithmic ...


PUM


Abstract

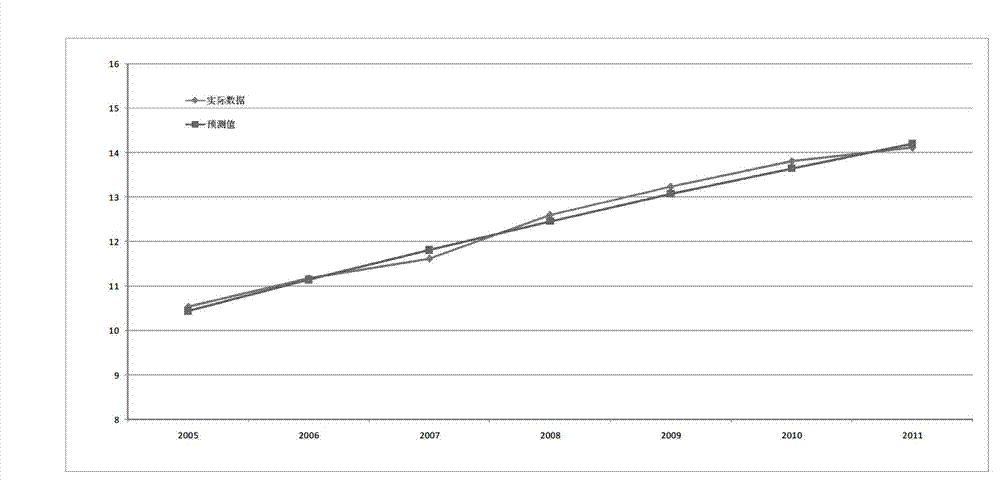
The invention provides a method for predicting medium-term and long-term power load on the basis of a logarithmical load density growth curve. A load density index value is evaluated on the basis of a load growth curve for a certain functional area according to a certain relationship between load growth and load saturation degree and the characteristics, such as non-linearity, time variance and uncertainty, of the medium-term and long-term power load; and the load at different load density stages has different growth rate according to the given load logarithmical growth rate curve at different development stages of the load, so that the more complicated load growth curve prediction is realized and the precision and the speed of load prediction are enhanced. The method can be used for predicting the whole load and can also be used for predicting the load of each block in the aspect of space load prediction.

Description

technical field [0001] The invention relates to a medium- and long-term power load forecasting method in an electric power system, in particular to a medium- and long-term power load forecasting method based on a logarithmic load density growth curve. Background technique [0002] With the development of the national economy and the improvement of people's living standards, electricity, as a very important energy source, has penetrated into every corner of society, and people's requirements for power quality are getting higher and higher. A basic tool that is getting more and more attention. Forecasting technology has a particularly important position in the electric power industry, which is determined by the simultaneous production, transmission, and consumption of the electric power industry and the advanced characteristics of the electric power industry. Power demand and power load forecasting is the basic basis for power system planning and construction, and is an impor...

Claims


Application Information

Patent Timeline
IPC IPC(8): G06Q10/04G06Q50/06
Inventor 万黎
Owner STATE GRID HUBEI ELECTRIC POWER RES INST
Learn More