
Multiple product production mode statistical process control method based on T-K control chart

A technology of statistical process control and production mode, applied in general control system, control/regulation system, adaptive control, etc., can solve problems such as control chart performance degradation, false positive rate increase, abnormal cause insensitivity, etc.

Inactive Publication Date: 2013-02-13
XIDIAN UNIV
View PDF5 Cites 24 Cited by
  • Summary
  • Abstract
  • Description
  • Claims
  • Application Information

AI Technical Summary

Problems solved by technology

However, using these control charts, it is necessary to estimate the standard deviation of the process parameters of different types of products. For this reason, it is necessary to collect enough data for each type of product, otherwise the error in the estimated value of the standard deviation is large, which will lead to poor performance of the control chart. Decrease, manifested as an increase in misjudgment rate or insensitivity to abnormal causes
For the case of multi-variety and small batches, it is usually difficult to meet the requirements of such data collection volume

Method used


Image

  • Multiple product production mode statistical process control method based on T-K control chart
  • Multiple product production mode statistical process control method based on T-K control chart
  • Multiple product production mode statistical process control method based on T-K control chart

Examples


Embodiment 1

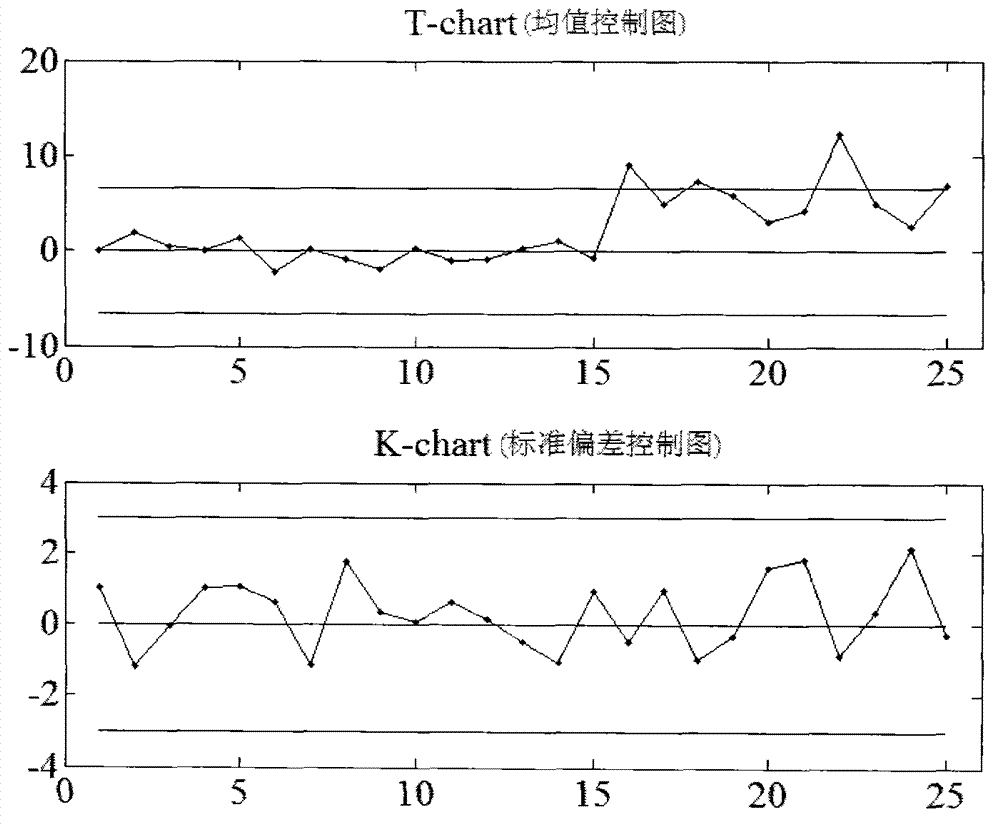
[0066] Embodiment 1. The ability of the T-K control chart to detect process mean out of control is verified by means of simulation. Use a random number generator to generate 25 batches of data, each batch of 5 samples, assuming that these 25 batches of data are composed of two types of products A and B, respectively subject to normal distribution N(10, 0.1) and N(20, 0.5) , when the random number is generated, the product type of each batch of samples is randomly determined with equal probability, assuming that the 1st to 15th batch of data is in a controlled state, starting from the 16th batch of data, the mean value of the two products has a shift of 3 times the standard deviation, The standard deviation has not changed, that is: the parameters of type A products obey N(10.3, 0.1), and the parameters of type B products obey N(21.5, 0.5). These 25 batches of data were analyzed using the T-K control chart, the results are as follows figure 1 .

[0067] Theoretically, the 1s...

Embodiment 2

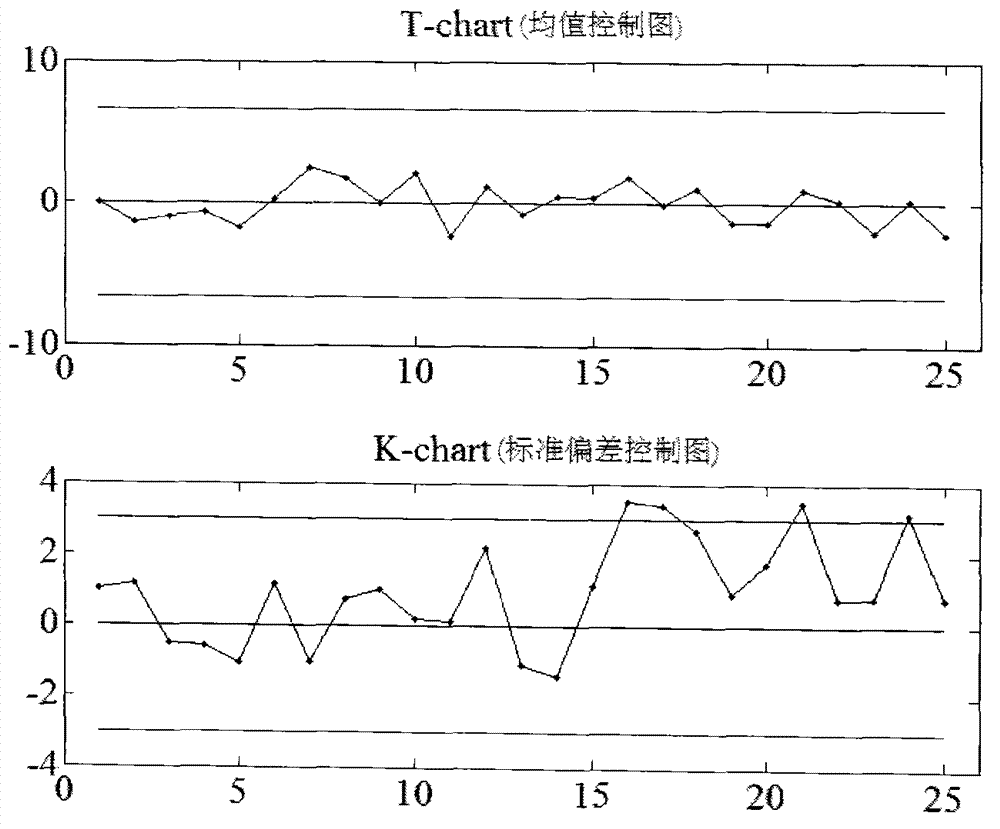
[0068] Example 2. Using simulation to verify the ability of the T-K control chart to detect process standard deviation out of control. The verification process is similar to Example 2. Use a random number generator to generate 25 batches of data, each batch of 5 samples, these 25 batches of data are composed of two types of products A and B, respectively subject to normal distribution N(10, 0.1) and N(20, 0.5), Assuming that the 1st to 15th batches of data are in a controlled state, starting from the 16th batch of data, the standard deviations of the two products are abnormally expanded to three times the original, while the mean value does not change, that is: the parameters of type A products obey N(10 , 0.3), B-type product parameters obey N (20, 1.5). The 25 batches of data were analyzed using the T-K control chart, and the results are shown in Figure 2. Theoretically, the mean value of these 25 batches of data has not shifted, so there should be no out-of-control points...

Embodiment 3

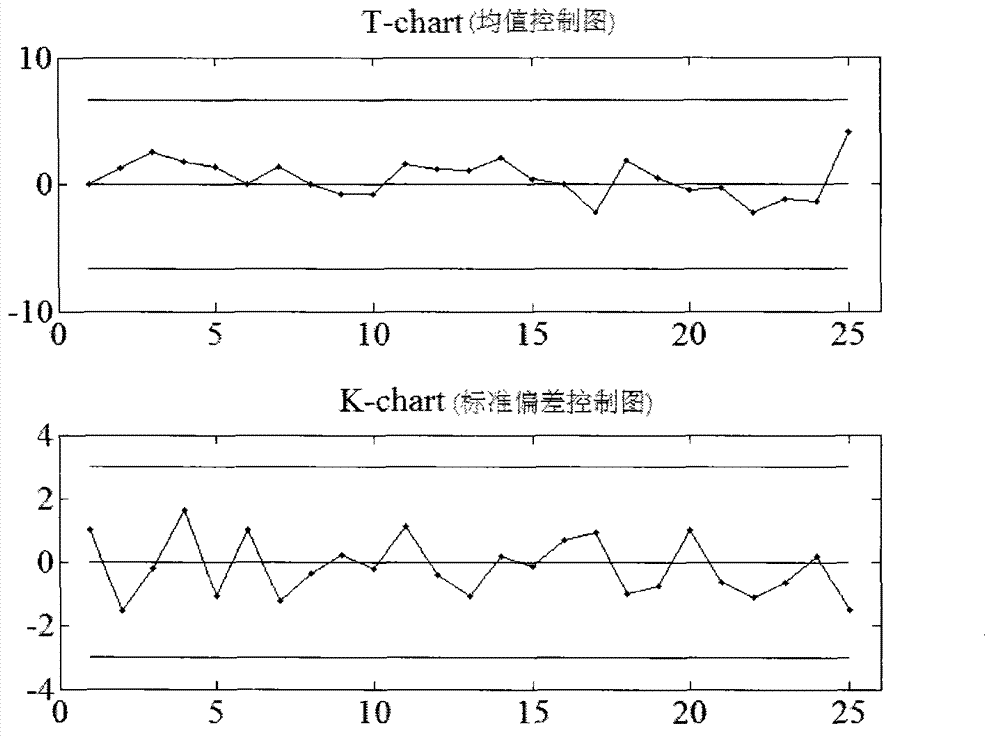
[0069] Example 3. Using T-K control chart to evaluate the operation state of the actual process. In the bonding process of microcircuit production, there are two types of bonding wires used, the models are F30 and F50. In the normal production process, a total of 25 batches of data were monitored, with 5 samples in each batch, and the T-K control chart was used for SPC analysis. The results are shown in Figure 3. The analysis results show that the bonding process is in a state of statistical control.

[0070] in conclusion

[0071] In the quality control of multi-variety production process, the traditional control chart technology cannot be directly used in multi-variety production environment due to insufficient data and different types of product process parameters do not obey the same normal distribution. This paper proposes the T-K control chart technology suitable for multi-variety production mode, including the definition and calculation method of T and K statistics, a...


PUM


Abstract

The invention discloses a multiple product production mode statistical process control method based on a T-K control chart. The multiple product production mode statistical process control method includes the following steps: (1) building a T control chart for monitoring process parameter mean value; (2) building a K control chart for monitoring process parameter standard deviation; and (3) under a multiple product production mode, the T-K control chart is used for monitoring a device operation state, as long as each type of product sample data reaches more than 2 batches, if distribution parameters are known, one batch of data is enough, and sample capacity of each batch of products is guaranteed to be identical and larger than 1. Control limits are determined according to whether the mean value of the process parameter matrix or standard deviation is known, and the T-K control chart is built. Instance analysis and simulation verification prove that the process control method can detect abnormal factors causing an incontrollable phenomenon in a production process under the multiple product production mode timely and effectively, prompts operation staff to make response timely, and enables the production process to remain in a statistical controlled state so as to guarantee product quality.

Description

technical field [0001] The invention belongs to the technical field of industrial production and manufacturing, and relates to a statistical process control method, in particular to a multi-variety production mode statistical process control method based on a T-K control chart. Background technique [0002] Statistical Process Control (SPC) technology is the main means to evaluate the statistically controlled state of the production process and to ensure product quality. Many scholars have proposed many different types of control chart technologies. These traditional control chart technologies have been widely used in mass industrial production, and have produced obvious effects on improving production efficiency and product quality. However, the use of traditional control charts requires the production process to meet certain conditions. First, in order to calculate the control limits, the mean and standard deviation of the process are required to be known or can be calcul...

Claims


Application Information

Patent Timeline
Patent Type & Authority Applications(China)
IPC IPC(8): G05B13/04
Inventor 顾铠贾新章游海龙
Owner XIDIAN UNIV
Learn More