Method for predicting wear resistance of lubricating base oil according to chemical structures
A technology for lubricating base oil and anti-wear performance, which can be used in electrical digital data processing, special data processing applications, instruments, etc., and can solve problems such as lack of theoretical guidance
- Summary
- Abstract
- Description
- Claims
- Application Information
AI Technical Summary
Problems solved by technology
Method used
Image
Examples
Embodiment 1
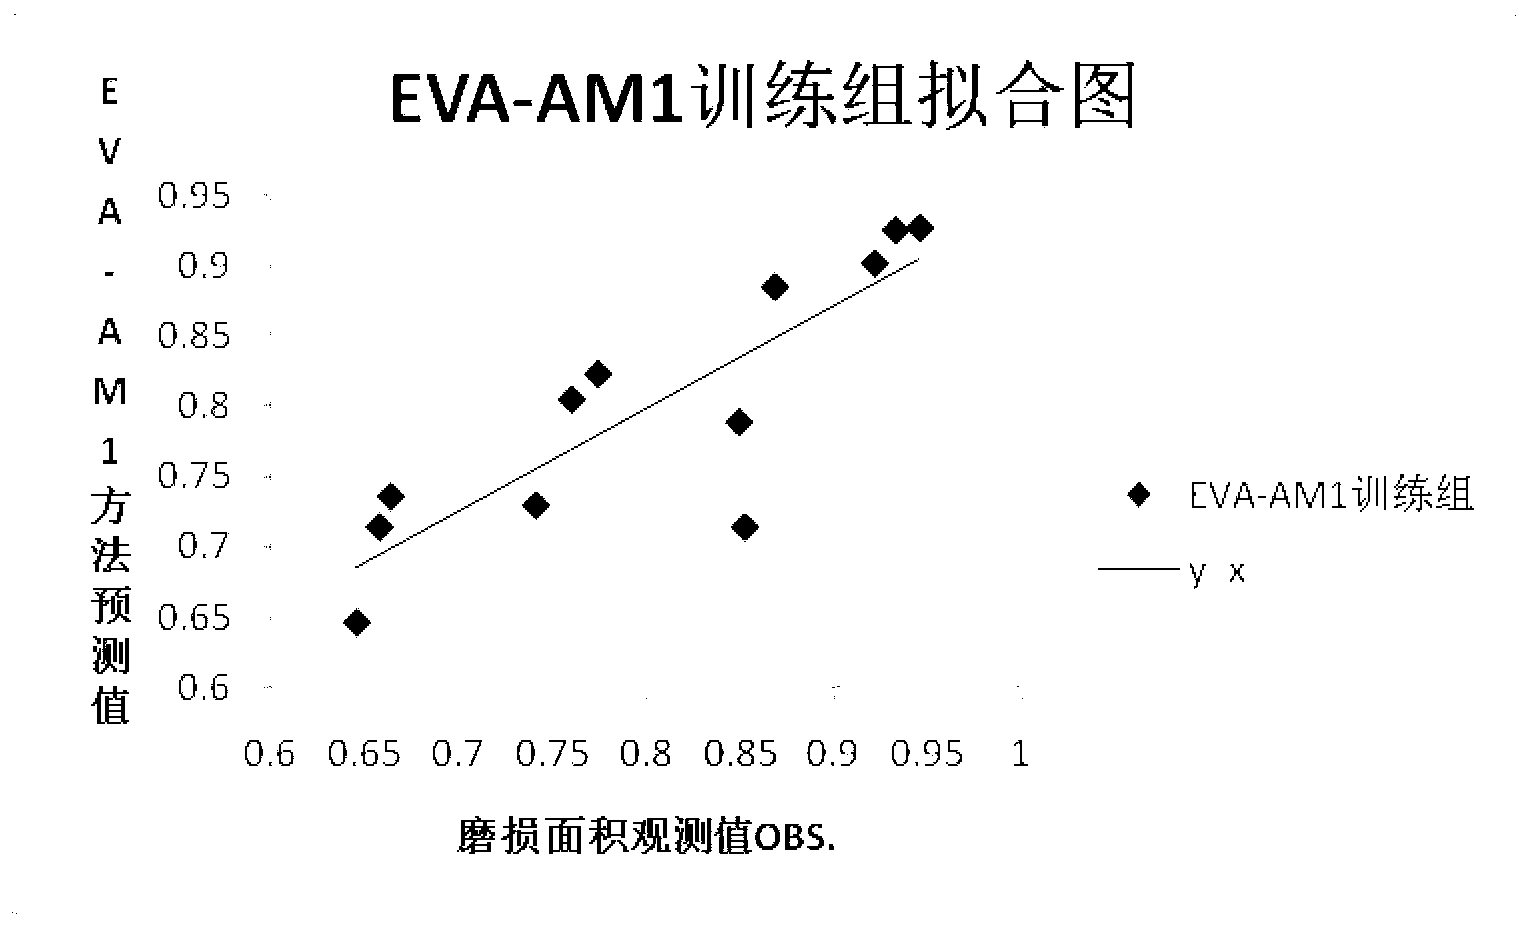
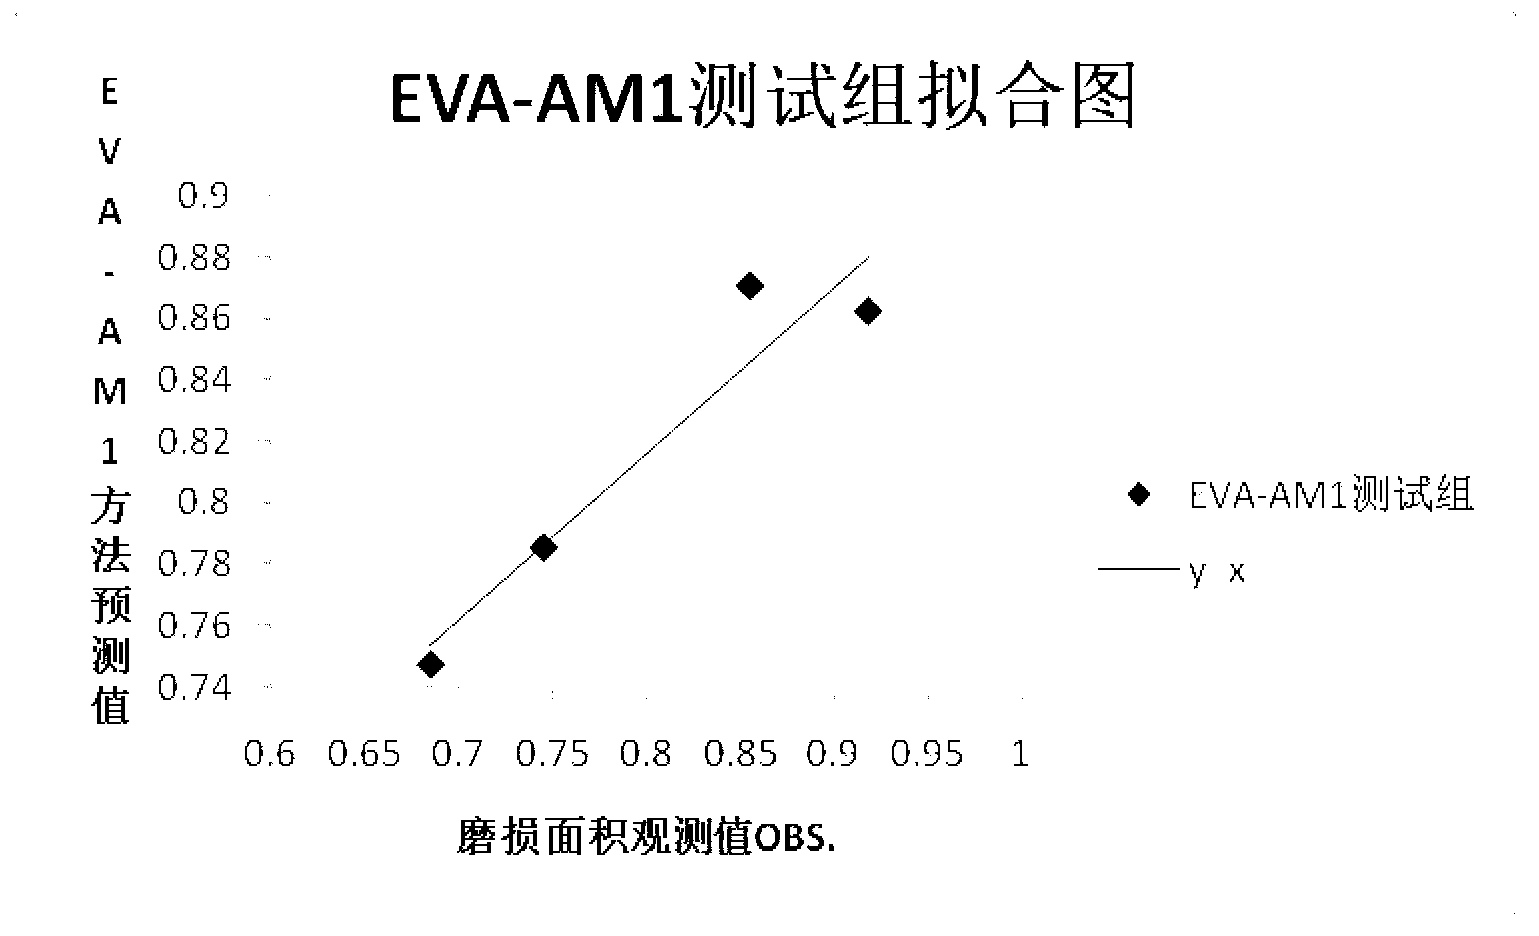
[0034] Three-dimensional chemical structures were generated in SYBYL for all compounds in the training and test groups, and the structure energy minimization was performed using the TRIPOS standard method. Use the AM1 method and default calculation parameters to calculate EVA parameters for the compounds in the training group, and use the LEAVE-ONE-OUT method for PLS model verification. After the model is established, use the AM1 method to calculate the EVA parameters for the compounds in the test group, and then use the PLS model to predict . The statistical results are shown in the first column of Table 1. Therefore, the prediction accuracy of the model and the prediction ability of the samples outside the training group are satisfactory (generally q 2 >0.5 results are acceptable, q 2 >0.7 indicates that the prediction performance of the model is excellent). The prediction-experimental data fitting diagram is attached figure 1 and 2 , it can be seen from the figure that ...
Embodiment 2
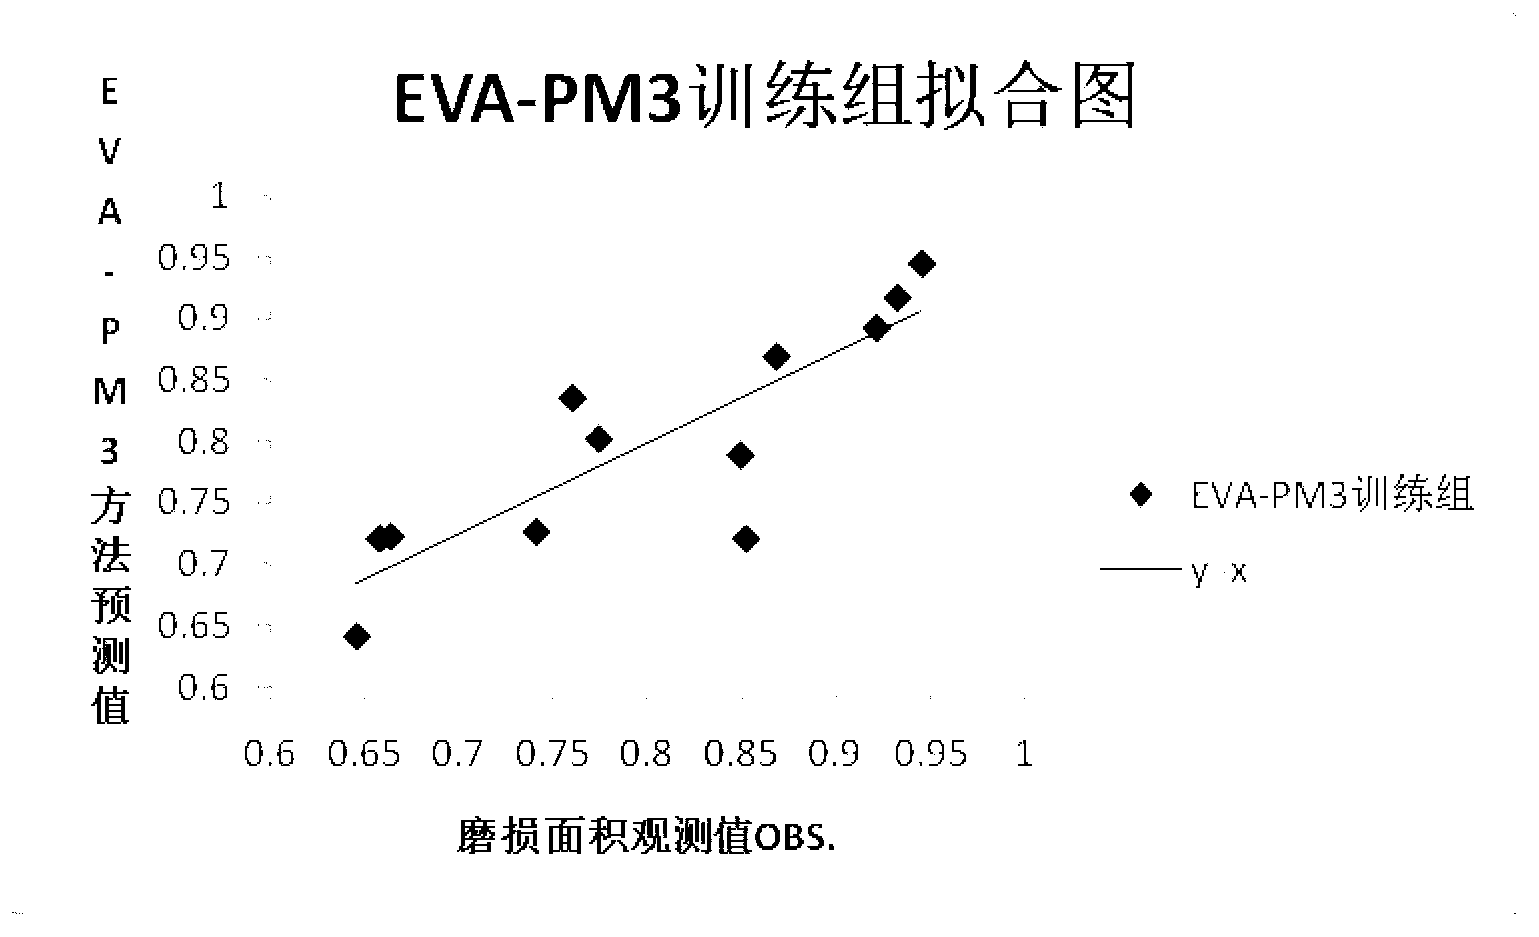
[0038] Three-dimensional chemical structures were generated in SYBYL for all compounds in the training and test groups, and the structure energy minimization was performed using the TRIPOS standard method. Use the PM3 method and the default calculation parameters to calculate the EVA parameters for the compounds in the training group. The PLS model verification uses the LEAVE-ONE-OUT method. After the model is established, the PM3 method is still used to calculate the EVA parameters for the compounds in the test group, and then use the PLS model to predict . The results are shown in the second column of Table 1. Therefore, the prediction accuracy of the model and the prediction ability of the samples outside the training group are worse than those of the AM1 method, but still satisfactory. The prediction-experimental data fitting diagram is attached image 3 and 4 , it can be seen from the figure that the experimental value and the predicted value have a good fit.
[0039]A...
PUM
 Abstract
Description
Claims
Application Information
 - R&D
- Intellectual Property
- Life Sciences
- Materials
- Tech Scout
- Unparalleled Data Quality
- Higher Quality Content
- 60% Fewer Hallucinations
Browse by: Latest US Patents, China's latest patents, Technical Efficacy Thesaurus, Application Domain, Technology Topic, Popular Technical Reports.
© 2025 PatSnap. All rights reserved.Legal|Privacy policy|Modern Slavery Act Transparency Statement|Sitemap|About US| Contact US: help@patsnap.com


