Method for positioning activities of Entomophthora in grain piles of grains stored in grain bin
A technology for grain piles and granaries, which is applied in the field of grain storage safety monitoring, can solve the problems of difficulty in implementation, the setting of diffusion characteristics, and the difficulty in obtaining information on the activities of insect molds in the granary, so as to achieve the effects of saving costs and improving accuracy and reliability.
- Summary
- Abstract
- Description
- Claims
- Application Information
AI Technical Summary
Problems solved by technology
Method used
Image
Examples
Embodiment 1
[0021] Example 1: Insect and mold activity positioning 1 (one positioning key point, two positioning related points)
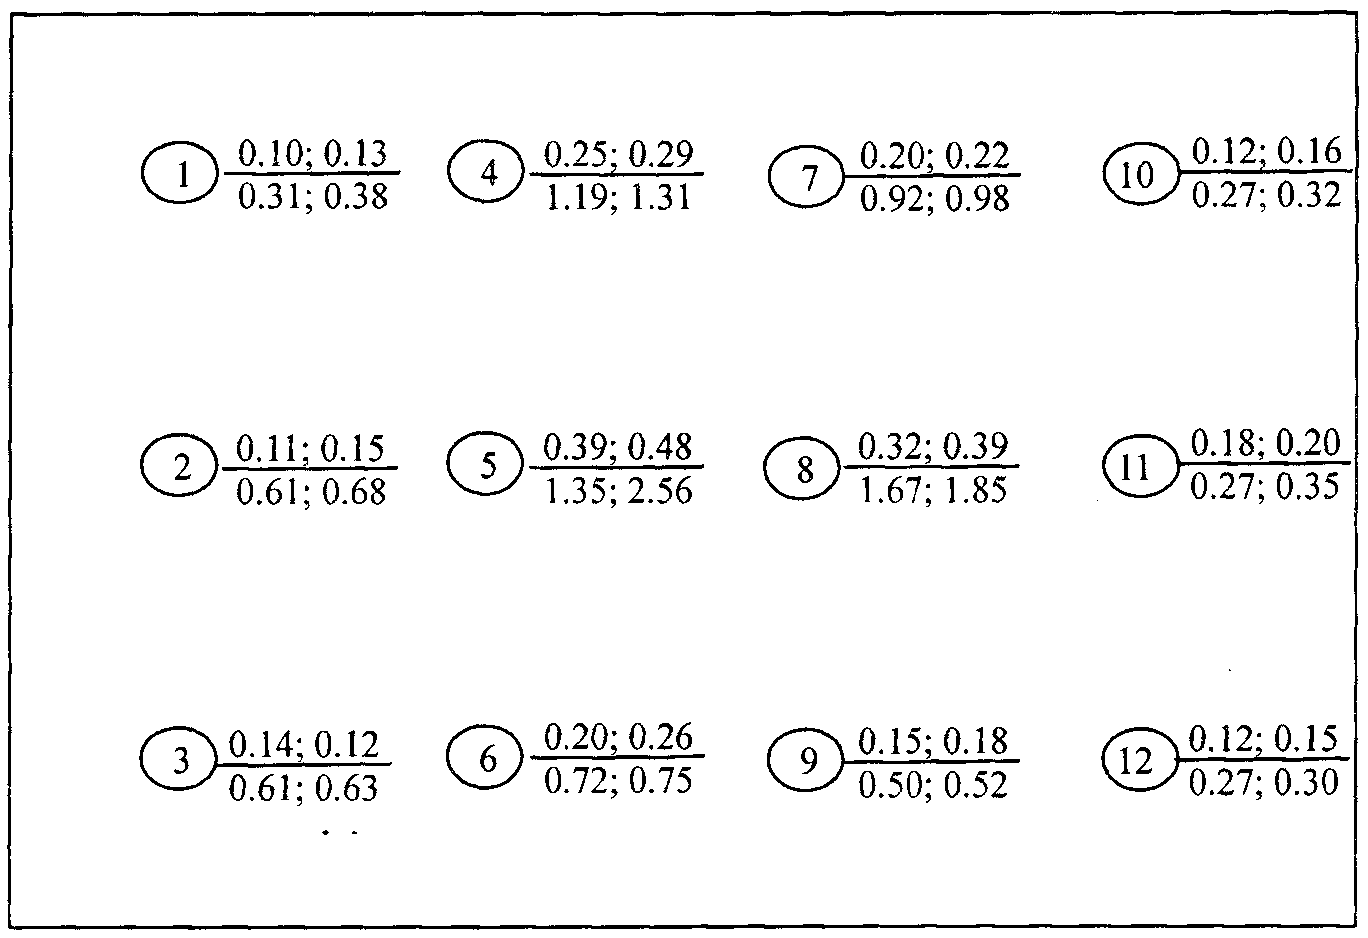
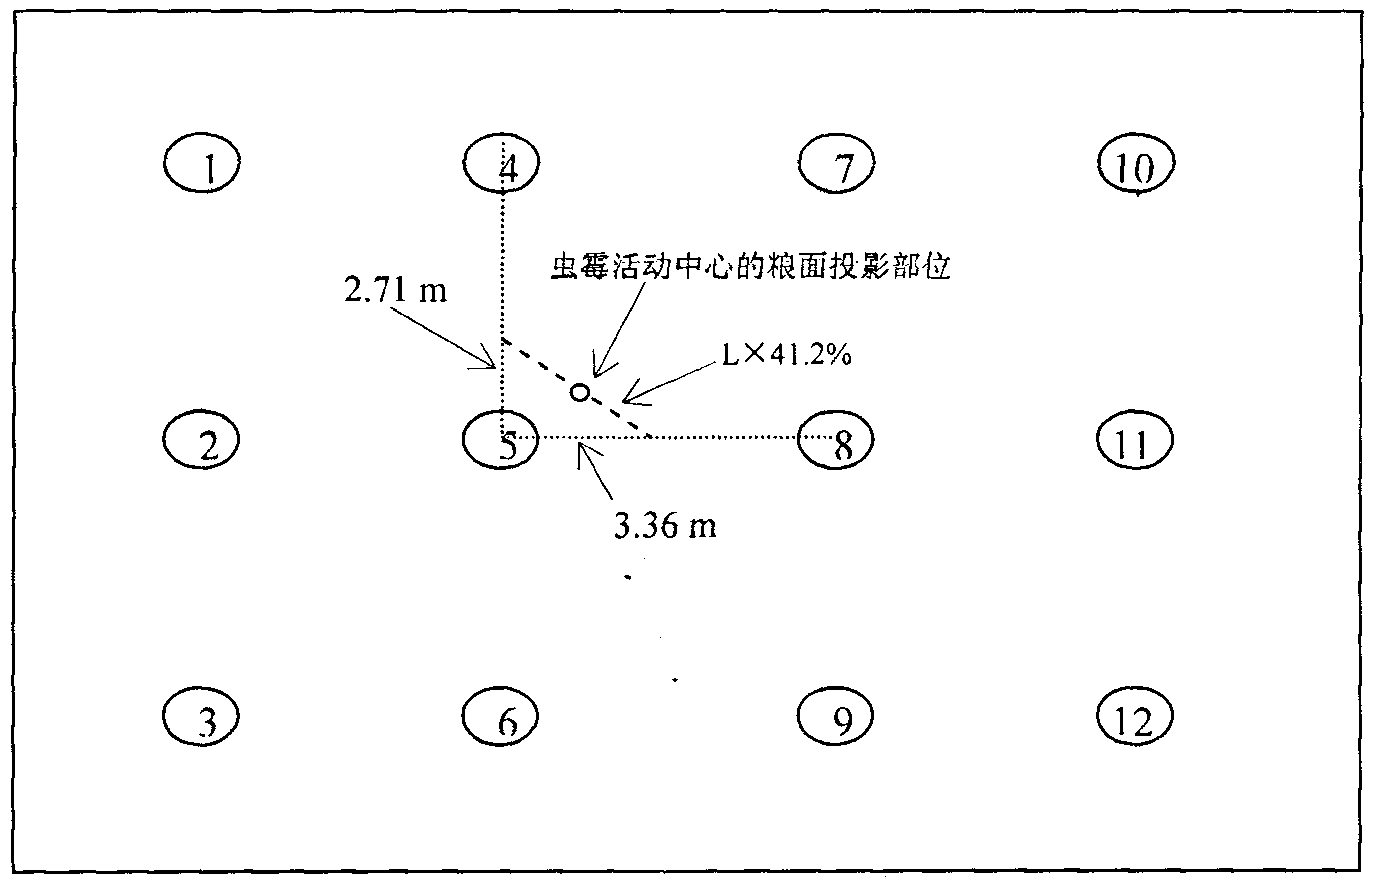
[0022] Such as figure 1As shown, it is the floor plan of insect and mildew activity monitoring in a flat warehouse of 32 m×24 m×6 m (length×width×height). The distribution of monitoring points is as follows: the distance between the monitoring points near the warehouse wall and the wall is 4 m, and the distance between monitoring points is 8 m; the detection time interval is 7 days, and the obtained data are marked on the right side of each monitoring point in the figure. The upper data is the measured value of carbon dioxide concentration at the 3 m monitoring point (unit: %), and the lower data is the measured value of carbon dioxide concentration at the 6 m monitoring point (unit: %). Analyze the detected data, and compare the detection value of each monitoring point with the previous detection data. The monitoring points with a detection value greater tha...
Embodiment 2
[0024] Example 2: Insect and mold activity positioning 2 (one positioning key point, three positioning related points)
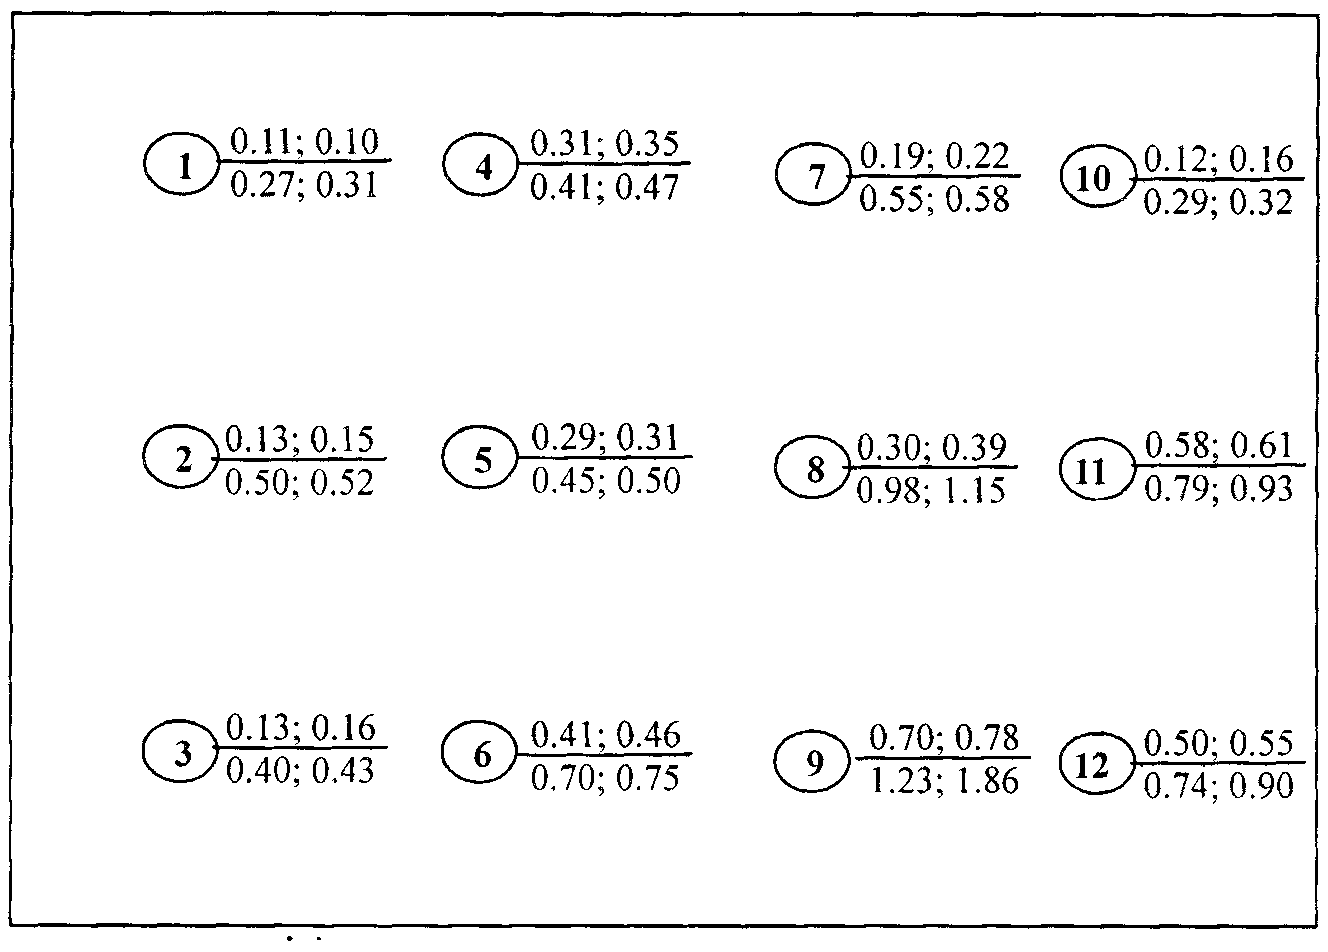
[0025] image 3 It is the floor plan of insect and mildew activity monitoring in a one-storey warehouse of 32 m×24 m×6 m (length×width×height). The distribution is as follows: the distance between the monitoring points near the warehouse wall is 4 m from the wall, and the distance between monitoring points is 8 m; the detection time interval is 7 days, and the obtained data are marked on the right side of each monitoring point in the figure, and the upper data is the measured value of carbon dioxide concentration at the 3 m monitoring point (unit: %), and the data below is the measured value of carbon dioxide concentration at the 6 m monitoring point (unit: %). Analyze the detected data, and compare the detection value of each monitoring point with the previous detection data. The monitoring points with a detection value greater than 1% are the lower layers...
PUM
 Abstract
Description
Claims
Application Information
 - R&D
- Intellectual Property
- Life Sciences
- Materials
- Tech Scout
- Unparalleled Data Quality
- Higher Quality Content
- 60% Fewer Hallucinations
Browse by: Latest US Patents, China's latest patents, Technical Efficacy Thesaurus, Application Domain, Technology Topic, Popular Technical Reports.
© 2025 PatSnap. All rights reserved.Legal|Privacy policy|Modern Slavery Act Transparency Statement|Sitemap|About US| Contact US: help@patsnap.com


