
Word cloud diagram visualizing method based on occupation matrix

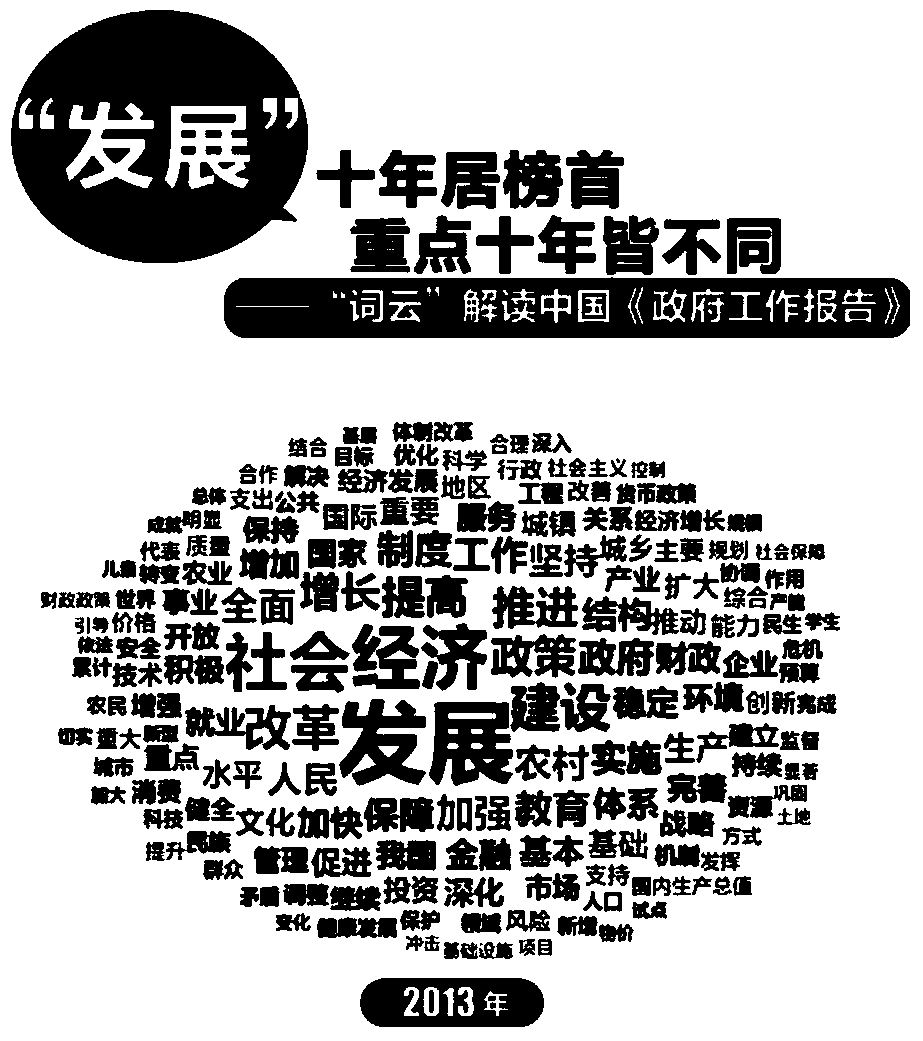
A cloud map and matrix technology, applied in text database browsing/visualization, special data processing applications, unstructured text data retrieval, etc., can solve problems affecting user experience, insufficient semantic utilization of color, font and angle information, complexity, etc. problem, to achieve the effect of saving overlapping detection time, enriching visualization effects, and high filling rate

Inactive Publication Date: 2014-05-07
BEIHANG UNIV
View PDF3 Cites 23 Cited by
  • Summary
  • Abstract
  • Description
  • Claims
  • Application Information

AI Technical Summary

Problems solved by technology

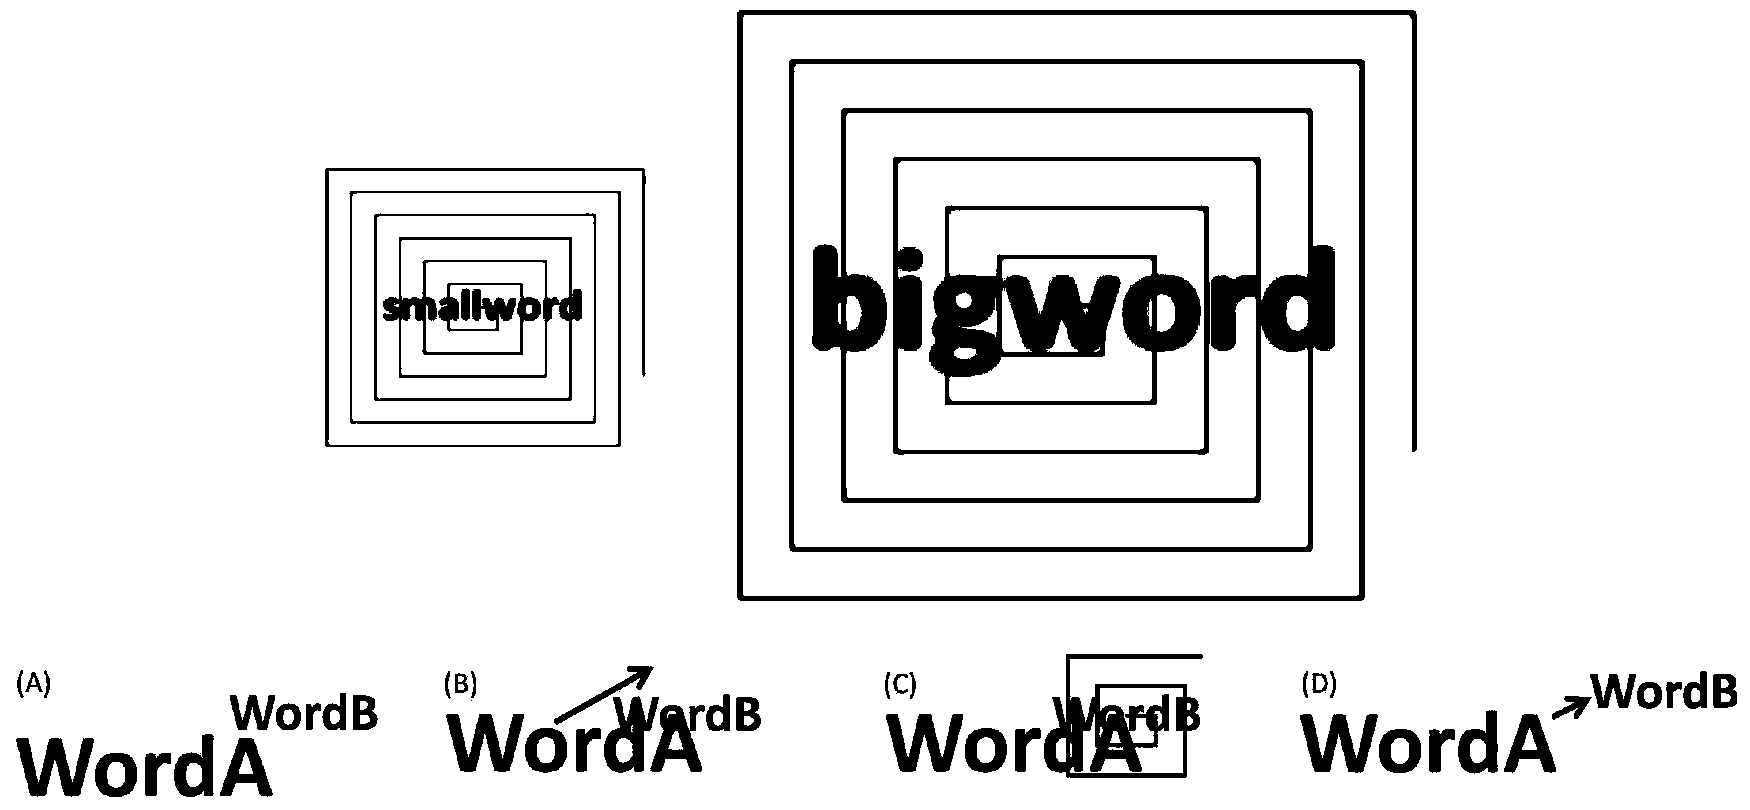
[0016] (1) The difficulty of word cloud visualization is to deal with overlap. The existing overlap detection algorithms represented by Wordle and force-directed layout all compare the phrases to be laid out with all the phrases that have been laid out one by one. (n 2 ) complexity, slow speed, affecting user experience
[0017] (2) Existing tools and methods can only realize one or more of non-overlapping, crisscross, arbitrary angle, centered layout, conformal filling and multiple semantics of word cloud visualization, and cannot realize all combination functions
[0018] (3) The online word cloud map tool, color, font, and font size parameters are configured manually, which is not conducive to automatic analysis of large-scale data and integration with other visualization technologies, and insufficient semantic utilization of color, font, and angle information
[0019] (4) The word cloud online tool cannot be embedded in software, and it is difficult to achieve seamless integration and synchronization with text data. It requires manual processing of several links, and is only suitable for generating a single word cloud

Method used


Image

  • Word cloud diagram visualizing method based on occupation matrix
  • Word cloud diagram visualizing method based on occupation matrix
  • Word cloud diagram visualizing method based on occupation matrix

Examples


Embodiment Construction

[0087] The present invention will be described in detail below in conjunction with the accompanying drawings.

[0088] The purpose of the present invention is to visualize statistical data including phrases and word frequency generated by various texts, use font size to represent word frequency, phrases have different colors, highlight high-frequency phrases, realize near large and far small, no overlap, criss-cross, arbitrary angle, Font extraction and adaptation to word clouds of different shapes. In order to solve the non-overlapping problem of the word cloud map, the occupancy matrix and edge detection technology are proposed. In order to realize the vertical and horizontal criss-crossing, the rotating canvas and non-overlapping detection are used. In order to realize the near-large and far-small and ensure the running speed, a two-stage center-based moving technology is proposed, and the image is used to initialize the occupancy. The matrix realizes adaptive graphics fill...


PUM


Abstract

A word cloud diagram of a word frequency visual text summary is represented by a word size, and the use efficiency of mass non-structured data is increased remarkably by means of initial screening and induction. Intersection detecting is a difficult point of word cloud visualization, and the conventional algorithm has the defects of high time complexity and low speed since overlapping is performed through pairwise comparison of word groups. The invention discloses a word cloud diagram visualizing method based on an occupation matrix. In the method, intersecting work clouds, word clouds of any angles and word clouds based on occupation matrixes are related. One-by-one comparison is converted into one-time calculation by adopting an occupation matrix, side boundary detection, random positions, rotation canvas and a coordinate conversion technology, so that the complexity is lowered, and overlapping of any angle is eliminated. Inputs are text statistics data of certain formats, outputs are randomly-combined layout word clouds which have the characteristics of profile adaptability, transverse and longitudinal intersection, any angle, dot-matrix abstraction, near big and far small and classification tags, key points of texts are presented on a macro level, and data differences are compared intuitively. The word cloud diagram visualizing method can be widely applied to the fields of text mining and visualization.

Description

technical field [0001] The invention belongs to the field of data mining and data visualization, and relates to a method for visualizing a word cloud graph. A set of word cloud graph visualization algorithms based on an occupancy matrix of arbitrary shape, arbitrary angle, non-overlapping, font extraction, and semantic classification is specifically designed. Background technique [0002] Word Cloud (Word Cloud) is an information-rich text visualization technology. Through the layout algorithm, the word frequency is represented by the size of the text, supplemented by a variety of color displays, which intuitively reflects the difference in the importance of phrases, and displays the key summary information of the text. In recent years, word cloud maps, as a highly expressive visualization carrier, have been widely used in website navigation, social label presentation, Web text analysis, and various text mining and visualization scenarios. [0003] The word cloud map origina...

Claims


Application Information

Patent Timeline
IPC IPC(8): G06F17/30
CPCG06F16/34
Inventor 刘连忠李春芳徐同阁陈梦东唐文忠
Owner BEIHANG UNIV
Learn More