
An architectural design method based on wind pressure map visualization

A technology of architectural design and wind pressure, applied in the direction of calculation, special data processing applications, instruments, etc., can solve the problems of lack of quantitative analysis results in energy saving, and achieve the benefits of building energy saving and students' outdoor activities, and is conducive to air circulation, The effect of smooth ventilation

Active Publication Date: 2016-11-09
TONGJI UNIV
View PDF2 Cites 0 Cited by
  • Summary
  • Abstract
  • Description
  • Claims
  • Application Information

AI Technical Summary

Problems solved by technology

[0002] The current research on natural ventilation focuses on the design of natural ventilation using traditional experience, most of which are qualitative designs, lacking quantitative analysis results in terms of energy saving

Method used


Image

  • An architectural design method based on wind pressure map visualization
  • An architectural design method based on wind pressure map visualization
  • An architectural design method based on wind pressure map visualization

Examples


Embodiment Construction

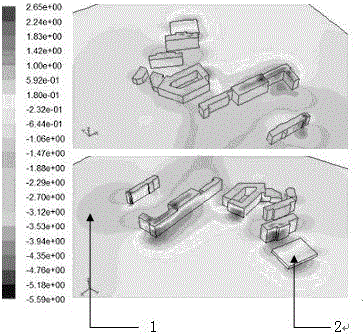
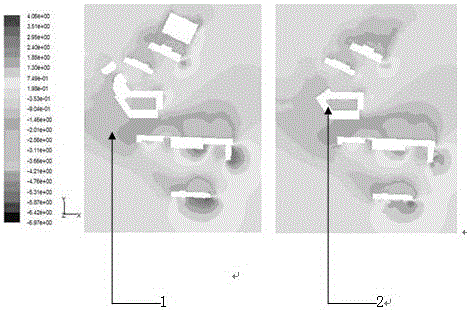
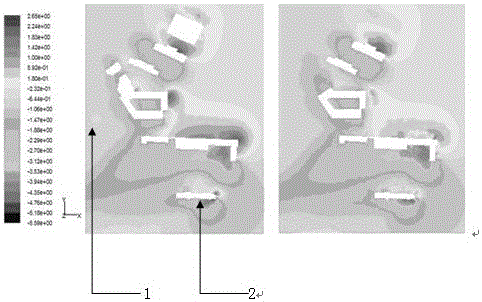
[0027] The architectural design method of wind pressure map visualization is indeed conducive to the improvement of the campus wind environment and the improvement of comfort. The ecological and energy-saving renovation of buildings makes full use of the architectural design method of wind pressure map visualization. The architectural design method of wind pressure map visualization has a significant guiding role in optimizing architectural design and building an energy-saving and environmentally friendly campus.

[0028] Wind pressure is the pressure of the wind on a plane perpendicular to the airflow direction. According to the Bernoulli equation, the wind-pressure relationship is obtained, and the dynamic pressure of the wind is

[0029] wp=0.5*p*v2 (1)

[0030] Where wp is wind pressure [kN / m2], p is air density [kg / m3], v is wind speed [m / s].

[0031] A series of conversions can be used to derive a general rough calculation method.

[0032] The wind pressure formula i...


PUM


Abstract

The invention relates to a building design method based on wind pressure diagram visualization. The building design method has an obvious guide effect for optimizing the building design and constructing an energy-saving environment-friendly campus. The wind speed and the wind direction are unpredictable, visual observation and research on the wind speed and the wind direction can be realized by virtue of certain updated scientific means and technologies; by virtue of certain intelligent operations of a computer, pressure nephograms of the wind pressure at different height can be obtained, and thus the building design method based on the wind pressure diagram visualization is obtained. By virtue of the obtained pressure nephograms, the distribution condition can be visually observed. The building design method based on the wind pressure diagram visualization is very good; a middle school in the southern district of China is taken as an example, the wind environment condition of the reconstructed campus are researched, and evaluation on the reconstruction scheme is performed, so that the wind pressure is surveyed and researched to the greatest extent, so that the important effect of the wind pressure in building design is better learnt, the building design is facilitated and harmonious coexistence of human beings and the nature is promoted.

Description

technical field [0001] The invention relates to the application field of computer technology, in particular to a building design method for visualization of wind pressure diagrams, which can easily and accurately observe the distribution of wind pressure diagrams inside buildings, so as to find out a control method for making them stable. The influence of wind on buildings is considered in two aspects: For turbulent flow with building walls, the flow can be divided into core area and near-wall area. The flow in the core region is a completely turbulent region, while the turbulent flow in the near-wall region changes drastically, and the fluid flow is obviously affected by the flow conditions of the wall surface, which can be further divided into viscous bottom layer, transition layer and logarithmic law layer. k - ε Both the model and the RSM model are high Reynolds number models, suitable for wind speed simulation in the core area; wall function method and low Reynolds numbe...

Claims


Application Information

Patent Timeline
Patent Type & Authority Patents(China)
IPC IPC(8): G06F17/50
Inventor 杨丽
Owner TONGJI UNIV
Learn More