Method for identifying samples by utilizing chromatographic feature extraction
A chromatographic feature and sample technology, applied in the field of chromatographic analysis, can solve problems such as difficulties in chromatographic signal analysis, and achieve the effects of eliminating chromatographic peak drift, high accuracy, and stable features
- Summary
- Abstract
- Description
- Claims
- Application Information
AI Technical Summary
Problems solved by technology
Method used
Image
Examples
example 1
[0036] Example 1, analysis of sample chromatographic peak drift
[0037] Step 1: Chromatographic signal acquisition
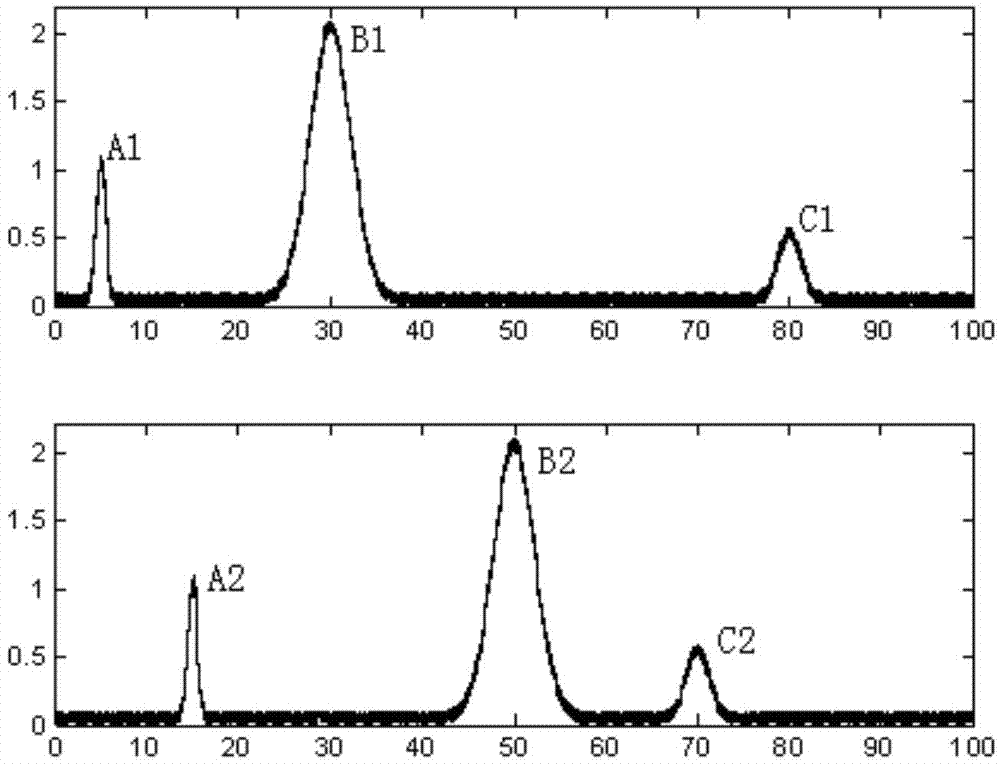
[0038] Using a chromatograph to collect the chromatographic signal peak of the sample to be tested; then, changing the external conditions of the chromatographic signal collection (such as temperature, humidity or replacing the chromatographic column, etc.), and collecting the chromatographic signal peak of the sample to be tested for the second time. see figure 1 , showing the chromatographic signal diagrams of the sample to be tested before and after changing the external conditions. As shown in the figure, there are three signal peaks in the chromatographic signal collected for the first time, which are named A1, B1, and C1 respectively. There are also three signal peaks in the chromatographic signal collected for the second time, which are named A2, B2, and C2 respectively. It can be seen from the figure that due to changes in the external conditions dur...
example 2
[0049] Example 2, Analysis of Wine Samples
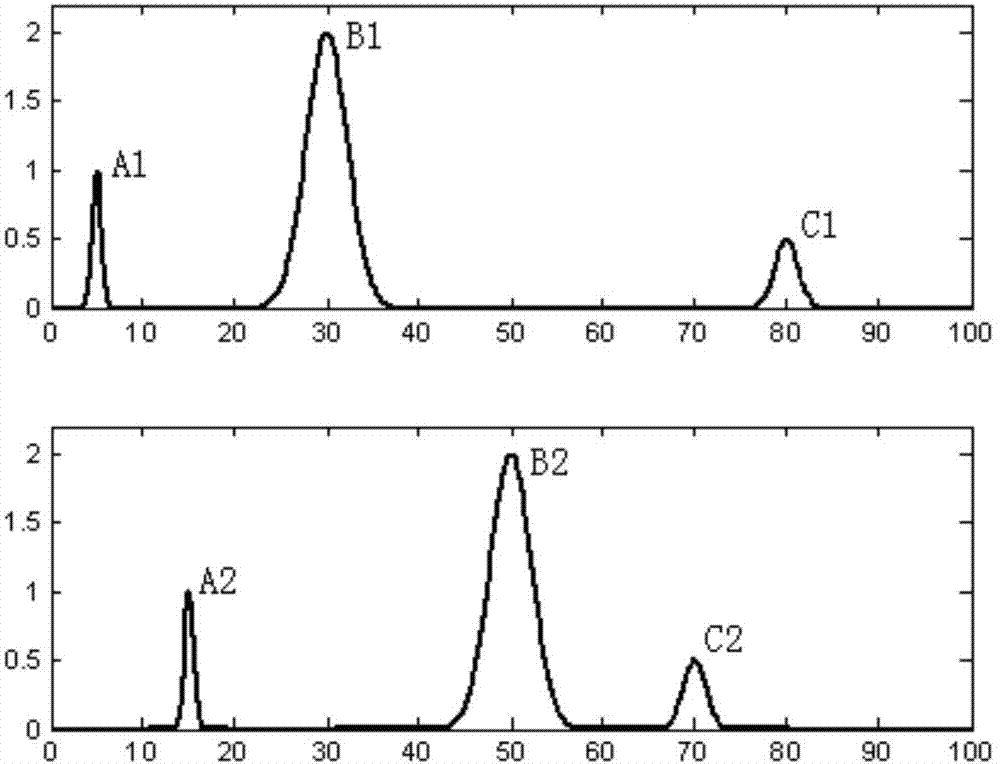
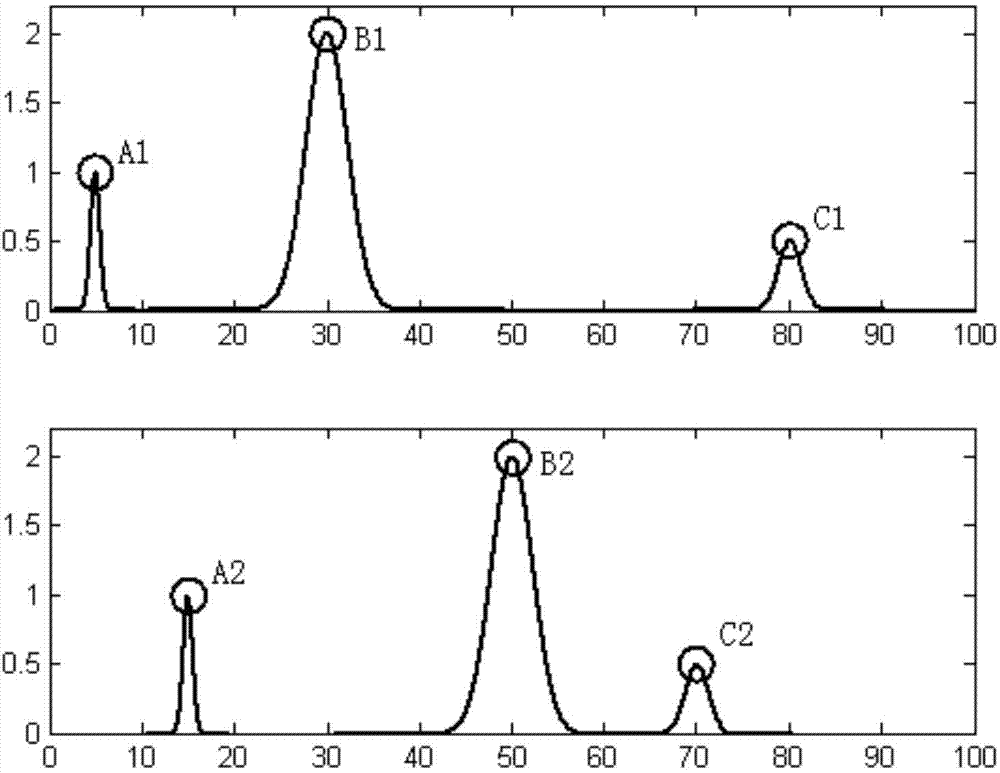
[0050] The chromatographic signals of the same liquor were collected under different chromatographic column conditions, 10 for each. When collecting the chromatographic signal of the wine sample, due to changes in the external conditions during the collection process, the collected chromatographic peaks drift. see Figure 4 , showing the chromatographic signal diagrams of wine samples under different external conditions. The denoising function wden provided by Matlab software was used to denoise the collected chromatographic signals. see Figure 5 , showing the chromatographic signal map of the wine sample after denoising. The peak of the chromatographic signal was detected by using the function findpeaks provided by Matlab software. see Image 6, showing a schematic representation of the chromatographic signal peaks of a wine sample.
[0051] Obtain the characteristics of the chromatographic signal of the wine sample, includ...
example 3
[0054] Example 3, wine identification
[0055] see Figure 7 , showing the chromatographic signals of the same wine under different conditions. As shown in the figure, (a) and (b) are chromatographic signals obtained under different conditions for the same wine, and there is chromatographic peak drift; (c) and (d) are chromatographic signals obtained for the same wine under different conditions, There is also chromatographic peak drift (c, d and a, b here are two different kinds of wine). 20 signals were collected for each wine sample, and a total of 80 chromatographic signal data were collected. Other steps are the same as examples 1 and 2, and will not be repeated here.
[0056] Get 20 chromatographic signals corresponding to (a) and (c), respectively seek the average value of chromatographic signals, and calculate respectively the distance between 20 chromatographic signals corresponding to (b) and (d) to these two average values; if the distance If it is less than 5, i...
PUM
 Abstract
Description
Claims
Application Information
 - R&D
- Intellectual Property
- Life Sciences
- Materials
- Tech Scout
- Unparalleled Data Quality
- Higher Quality Content
- 60% Fewer Hallucinations
Browse by: Latest US Patents, China's latest patents, Technical Efficacy Thesaurus, Application Domain, Technology Topic, Popular Technical Reports.
© 2025 PatSnap. All rights reserved.Legal|Privacy policy|Modern Slavery Act Transparency Statement|Sitemap|About US| Contact US: help@patsnap.com


