

Urban road obstacle recognition system
A technology for obstacle identification and obstacle, applied in anti-collision systems, character and pattern recognition, instruments, etc., can solve the problems of imperfect detection links and low reliability, so as to improve the level of research and application, solve traffic congestion, Strong anti-interference effect
- Summary
- Abstract
- Description
- Claims
- Application Information
AI Technical Summary
Problems solved by technology
Method used
Image

Examples
Embodiment Construction
[0026] The technical solutions of the present invention will be clearly and completely described below in conjunction with the accompanying drawings of the present invention. Apparently, the described embodiments are only some of the embodiments of the present invention, not all of them. Based on the embodiments of the present invention, all other embodiments obtained by persons of ordinary skill in the art without creative efforts fall within the protection scope of the present invention.
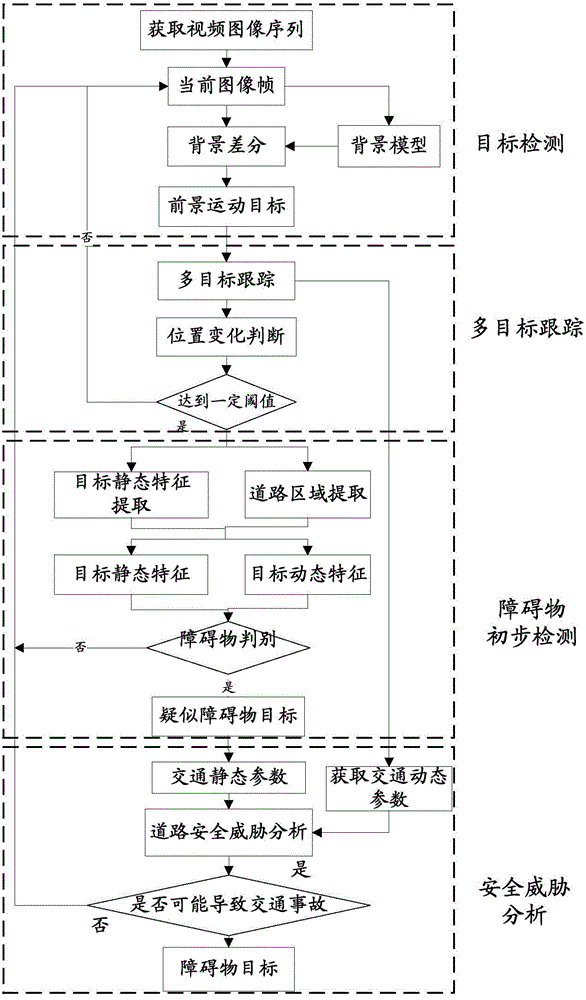
[0027] figure 1 A structural block diagram of an urban road traffic obstacle detection system of the present invention, as figure 1 Shown, a kind of urban road traffic obstacle detection shown in the present invention is based on the fixed CCD image detector of urban road traffic. Including the following steps:
[0028] Step S1, acquiring a video image sequence of urban road traffic through a fixed CCD image sensor;
[0029] Step S2, using the improved mixed Gaussian background modeling...
PUM
 Abstract
Description
Claims
Application Information