[0019] The present invention will be described in detail below in conjunction with specific embodiments. The following examples will help those skilled in the art to further understand the present invention, but do not limit the present invention in any form. It should be pointed out that for those of ordinary skill in the art, a number of modifications and improvements can be made without departing from the concept of the present invention. These all belong to the protection scope of the present invention.
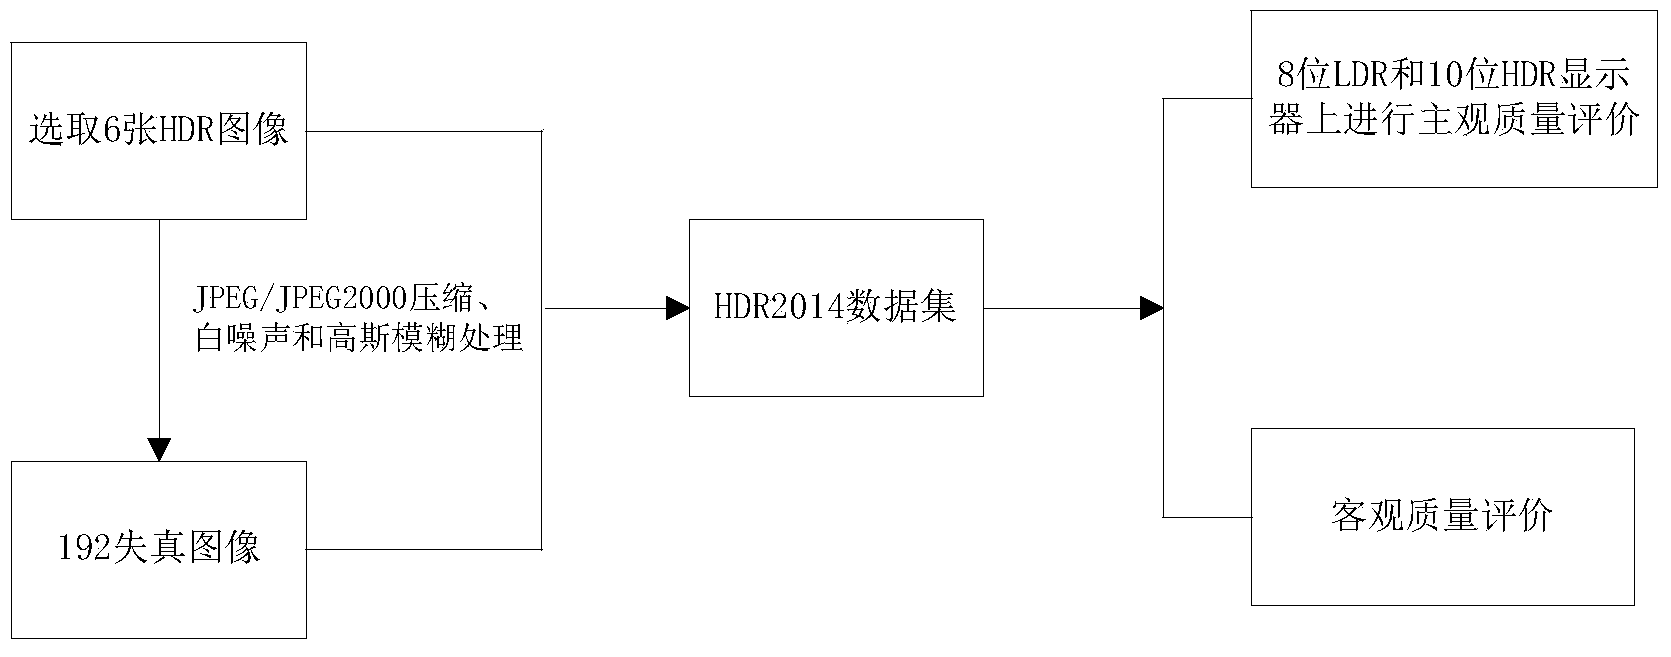
[0020] This embodiment provides a high dynamic range image quality data set, and the implementation process is as follows figure 1 As shown, including the following steps:
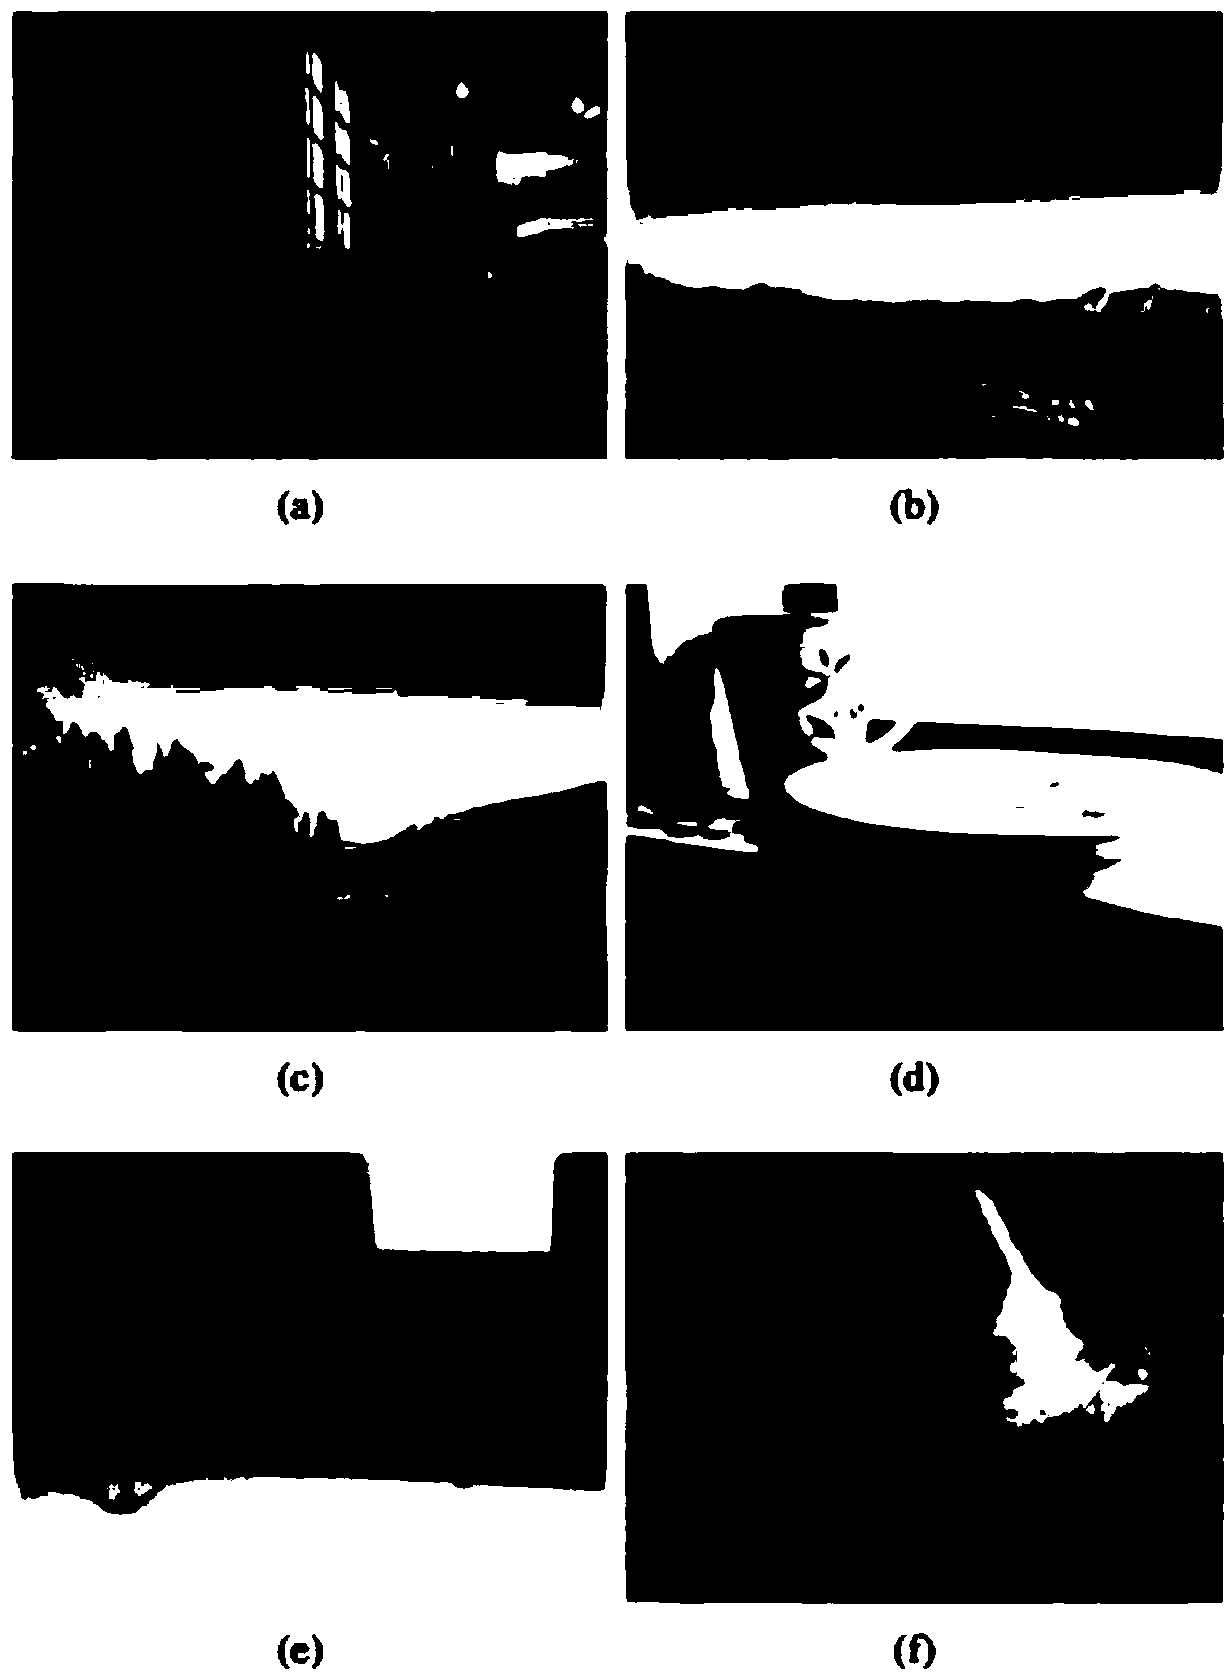
[0021] The first step, the generation of HDR2014 data set
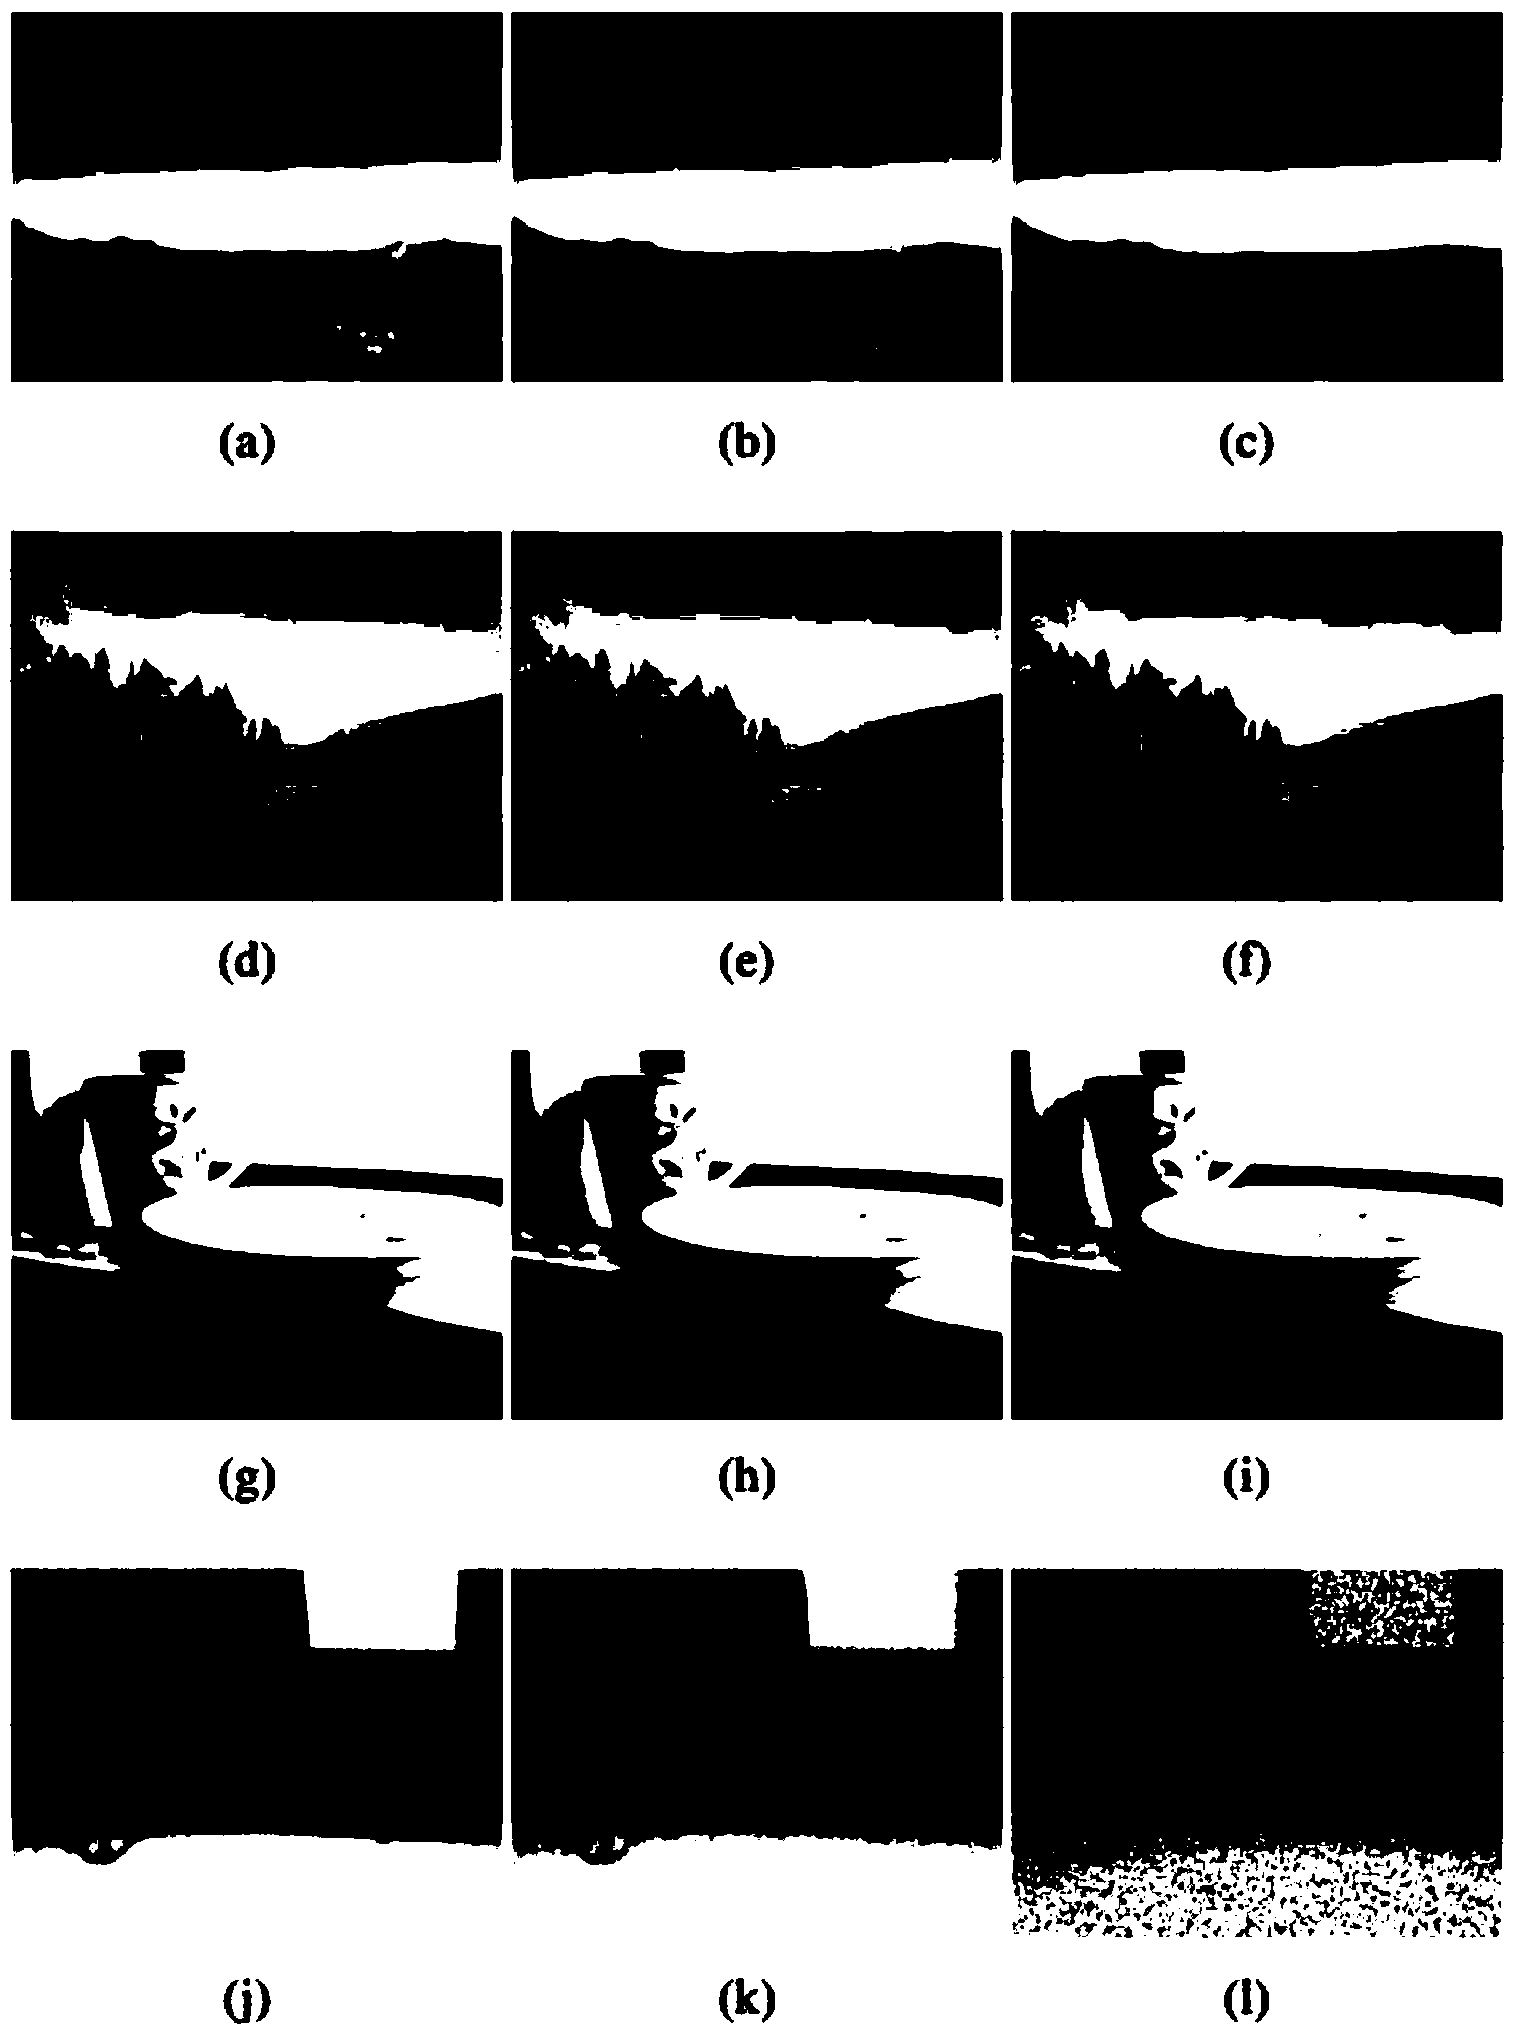
[0022] JPEG: Call the imwrite function of Matlab to compress the HDR image into a JPEG image, use the Q parameter as (70, 60, 50, 40, 30, 20, 10, 5), and then use the hdrwrite function to generate the HDR image from the JPEG;
[0023] JP2K: Call the imwrite function of Matlab to compress HDR images into JP2K images according to different compression ratio parameters. The compression ratios used are 20, 40, 60, 80, 100, 200, 300 and 400, and then use the hdrwrite function to generate from JP2K HDR image;
[0024] White noise: call the imnoise function in Matlab, add 8 kinds of normal noise to the R, G, and B channels respectively, μ=0,σ 2 =(0.002,0.004,0.008,0.01,0.04,0.08,0.1,0.3);
[0025] Gaussian blur: call the fspecial and imfilter functions in Matlab, and use the window as l for the R, G, and B channels respectively G ×l G (l G =20), the standard deviation is σ G =(1,2,3,4,5,6,7,8) Gaussian kernel function for blur processing.
[0026] The HDR2014 data set is obtained after the above processing.
[0027] The second step, subjective testing of the HDR2014 data set
[0028] The images in the HDR2014 data set are displayed on LCD (8-bit) monitors and HDR (10-bit) monitors (both displayed by Adobe Photoshop software); the resolutions of LCD and HDR monitors are 1920x1080 and 1920x1200, and the refresh rate is 60Hz and 59Hz; According to the Single Stimulation (SS) method of ITU-R BT.500-12, twenty-five observers (14 males, 11 females, ages 20-30) participated, and most of them were college students from Different majors (computer science, electronic engineering, chemistry, etc.), and everyone has normal or corrected to normal vision; each participant is shown all HDR images on two monitors, and there is no interference from other members in the experiment ; In order to eliminate the influence of sequence, the order of image presentation is random; after observing the images for a few seconds, participants are asked to rate the images with a continuous quality scale ranging from 0 to 1 with an accuracy of 0.01%; the subjective test method is based on international The standard BT500 is strictly implemented. In addition, there are many test results, and the deviation caused by the randomness of an individual can be completely excluded.
[0029] The HDR images displayed in Adobe Photoshop use gamma correction; therefore, these images need to be preprocessed for gamma correction before using the IQA index; the commonly used gamma coefficient is γ=2.2, and the gamma correction function is:
[0030] L d = L w 1 / γ
[0031] Where: L w Is the actual illuminance, L d Is the display illuminance;
[0032] List the average opinion score (MOS) of the original image on the 8-bit display and the 10-bit display, and remove some abnormal scores (which are quite different from other scores), and calculate the different opinion scores of the original image and its distorted image ( DMOS) value.
[0033] The third step, for the full-parameter IQA indicators, following the original indicators MSE and PSNR, the classic method of structural similarity index (SSIM) proposed in 2004 is also used, which is the brightness comparison function 1, the contrast comparison function c, and the structural similarity. Combination of function s; then, multi-scale SSIM (MS-SSIM) according to NSS model, image gradient, human brain science, etc., weighted SSIM (IW-SSIM) of information content, most advanced feature similarity (FSIM), gradient Similarity (GSM), and Internally Generated Model (IGM); In addition, there is also the visual information fidelity (VIF) of the statistical model based on natural scenery and information theory proposed by HRSheikh; these 9 kinds of full parameters are calculated under HDR2014 Calculate the evaluation values of PLCC, SROCC, KROCC and RMSE under the method and the SROCC value under the respective clear images (scene 1-6);
[0034] For the non-parameter IQA index, considering its wide use in most applications, it is more valuable than the full-parameter IQA method when the original image signal cannot be obtained; using three early popular image authenticity based on distortion recognition And completeness evaluation (DIIVINE), based on DCT statistics without reference image integrity mark (BLIINDS-II) and blind/non-parameter image spatial quality evaluation (BRISQUE), using support vector machine (SVM) on DCT, DWT and spatial domain respectively ) Has very good performance; in addition, it has been published in "Making a completely blind image quality analyzer" (A.Mittal published in IEEE Signal Processing Letters2013) and "Learning without human scores for blind image quality assessment" (W.Xue published in CVPR2013 ) Two new parameter-free methods are proposed in the article, images without manual scoring, prior knowledge of image content and distortion categories.
[0035] As a compromise between full-parameter and non-parameter IQA, many methods with high IQA performance and semi-parametric are proposed. For example, based on the distortion measurement free energy method (FEDM), the internal generation model of the human brain can be estimated when the input visual signal is sensed, and the structural degradation model (SDM) has successfully improved SSIM into an effective semiparametric IQA method.
[0036] Under the HDR2014 data set, use the above-mentioned quality evaluation methods to evaluate, and calculate these 4 semi-parametric methods and 5 non-parametric methods to calculate the images (scene 1-6) and distortion maps (blur, JP2K, JPEG) with clear content in each , White noise) the evaluation values of PLCC, SROCC, KROCC, and RMSE, as well as the SROCC values of the respective clear images (scene 1-6) and distortion maps (blur, JP2K, JPEG, white noise).
[0037] Implementation Effect
[0038] According to the above steps, experiments are performed on the HDR2014 image data set. All experiments are implemented on a PC computer, the main parameters of the PC computer are: central processing unit Core TM 2Duo CPU E66002.40GHz, memory 3GB; software platform: MATLAB.
[0039] Table 1 lists some important parameters in the subjective test of the HDR2014 data set;
[0040] Table 2 lists the average opinion score (MOS) of the original image on the 8-bit display and the 10-bit display;
[0041] The four commonly used methods of performance measurement recommended by VQEG are: Pearson linear correlation (PLCC), Sperman rank correlation coefficient (SRCC), Kendall rank correlation coefficient (KROCC) and root mean square error (RMSE), which are used to evaluate and compare these Competitive full-parameter, semi-parametric and no-parameter IQA methods.
[0042] Table 3 shows the evaluation values of PLCC, SROCC, KROCC and RMSE under the HDR2014 data set of 9 full-parameter methods.
[0043] Table 4 shows the evaluation values of PLCC, SROCC, KROCC and RMSE under the HDR2014 data set of 4 semi-parametric methods and 5 non-parametric methods.
[0044] Table 5 shows the SROCC values of the 9 full-parameter methods in the respective images (scene 1-6) with clear content.
[0045] Table 6 shows the SROCC values of the 4 semi-parametric methods and the 5 non-parametric methods in the images (scene 1-6) and distortion images (blur, JP2K, JPEG, white noise) with their respective clear content.
[0046] Table 1 Conditions and parameters of subjective testing
[0047]
[0048] Table 2 The MOS value of the original image on the 8-bit and 10-bit display, bolded to higher MOS value
[0049]
[0050] Table 3 The evaluation values of PLCC, SROCC, KROCC and RMSE under the HDR2014 data set (198 images) of the full-parameter methods PSNR, IW-PSNR, SSIM, MS-SSIM, IW-SSIM, VIF, FSIM, GSM, IGM ( After linear regression), bold as special value
[0051]
[0052] Table 4 Semi-parametric methods FEDM, RRED, QFTB, SDM and non-parameter methods DIIVINE, BLIINDS-II, BRISQUE, NIQE, QAC in the HDR2014 data set (198 images) PLCC, SROCC, KROCC and RMSE evaluation values (linear After regression), bold as special value
[0053]
[0054] Table 5 SROCC (after linear regression) of each scene in the HDR2014 data set (198 images) of the full-parameter method PSNR, IW-PSNR, SSIM, MS-SSIM, IW-SSIM, VIF, FSIM, GSM, IGM, plus The best value
[0055]
[0056] It can be found from Table 2 that the quality score of the reference image on the 10-bit display is higher than that on the 8-bit display. To illustrate this point, for scene 2, scene 3, and scene 5, the brightness and color when displayed on a 10-bit display are continuous, but you can see obvious color jumps on an 8-bit display. In the sky (such as figure 2 (B), (c)) and the earth (as figure 2 It can be clearly seen from the test on (e). For scene 4, the effect on the 10-bit display has more details (more decorative patterns on the plate) than the 8-bit display in the bright area. for figure 2 In (a) and (f), there is not much difference in presentation performance. All these phenomena confirm that HDR images have a larger range of colors, contrast and intensity than LDR images. However, from image 3 It can be seen that the higher the degree of distortion, the more difficult it is to distinguish distorted HDR images on 10-bit and 8-bit displays. Then, some abnormal scores (which are quite different from other scores) are removed, and the difference opinion score (DMOS) value of the original image and its distorted image is calculated.
[0057] The specific embodiments of the present invention have been described above. It should be understood that the present invention is not limited to the above specific embodiments, and those skilled in the art can make various deformations or modifications within the scope of the claims, which does not affect the essence of the present invention.