Method for judging oil well indicator diagram similarity

A dynamometer and similarity technology, which is applied in the analysis and processing of oil well dynamometers, and the field of identifying the similarity of oil well dynamometers, can solve the problems affecting dynamometer analysis and database storage query efficiency, etc., to save analysis time, Reduce computation and storage, optimize the effect of data analysis

Active Publication Date: 2015-04-08
PETROCHINA CO LTD
View PDF5 Cites 6 Cited by
  • Summary
  • Abstract
  • Description
  • Claims
  • Application Information

AI Technical Summary

Problems solved by technology

[0004] The purpose of the present invention is to overcome the repeated analysis of similar oil well dynamometer diagrams, which affects the efficiency of dynamometer diagram analysis and database storage and query

Method used


Image

  • Method for judging oil well indicator diagram similarity
  • Method for judging oil well indicator diagram similarity
  • Method for judging oil well indicator diagram similarity

Examples


Embodiment 1

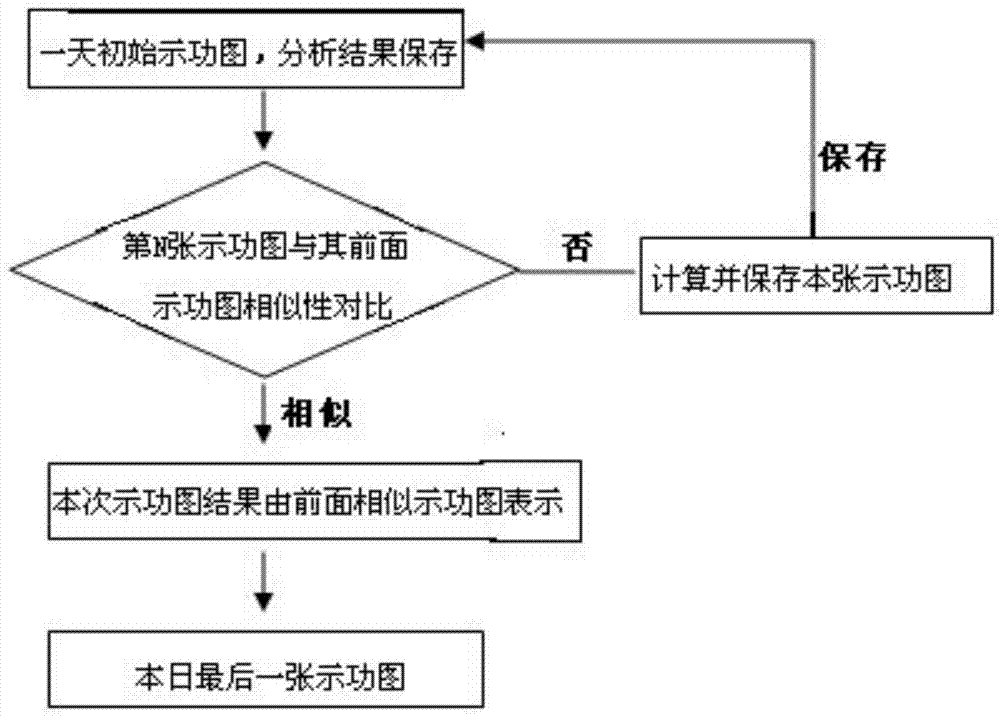
[0022] In order to solve the problem of repeated analysis of dynamometer diagrams of similar oil wells, which affects the efficiency of dynamometer diagram analysis and database storage and query. The present invention provides a figure 1 The shown method for judging the similarity of the oil well indicator diagram includes the following steps:

[0023] Step 1), take the first oil well dynamometer map collected every day as the initial comparison dynamometer map, if the similarity C≥99% between the second oil well dynamometer map collected and the first one, then the second oil well dynamometer map If the diagram is not analyzed, the result shall be directly expressed by the analysis result of the first oil well indicator diagram, otherwise, the oil well indicator diagram shall be treated as dissimilarity analysis;

[0024] Step 2), compare the similarity between the third oil well indicator diagram and the first and second oil well indicator diagrams, if there is an oil well...

Embodiment 2

[0036] This embodiment is based on Embodiment 1 to further illustrate the present invention.

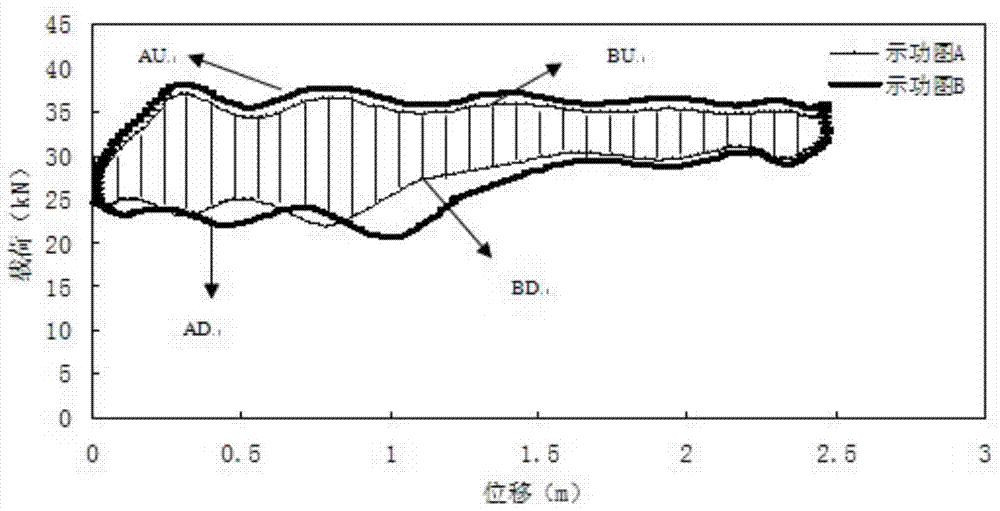
[0037] Area A of the overlapping part of the dynamometer diagram intersect The calculation of:

[0038] Such as figure 2 As shown, there are two indicator diagrams A and B, and the curves representing the up and down strokes are respectively marked as AU (up stroke curve of A indicator diagram), AD (down stroke curve of A indicator diagram), BU (B The upper stroke curve of the dynamometer), BD (the lower stroke curve of the B dynamometer), the shaded part is the area A of the overlapping part of the two dynamometers intersect .

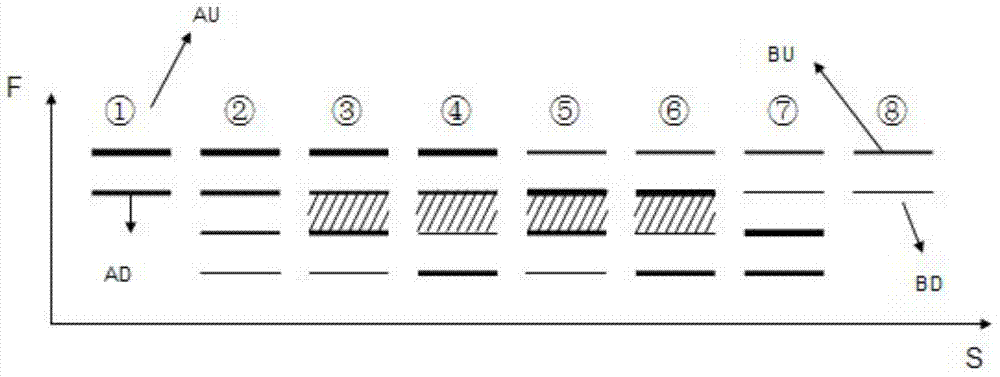
[0039] Such as image 3As shown, in any infinitely small displacement change interval, the four lines AU, AD, BU, and BD have the following relationships according to the positional relationship of the load from low to high, where ① means that only A shows in the selected area dynamometer data; ② means that there is no overlap between the A and B dynam...


PUM


Abstract

The invention belongs to the technical field of oil well digitization, in particular relates to a method for judging oil well indicator diagram similarity. The method comprises the following steps: (1) a first oil well indicator diagram on every day is analyzed; if the similarity C of a second oil well indicator diagram and the first oil well indicator diagram is not lower than 99%, the analysis is not performed, and the analysis result of the first oil well indicator diagram is adopted to express; otherwise, the analysis is performed; (2) the similarity comparison is performed for a third oil well indicator diagram and the first and second oil well indicator diagrams; if the similarity C of the third oil well indicator diagram and one of the first and second oil well indicator diagrams is not lower than 99%, the analysis is not performed, and the analysis result of the similar oil well indicator diagram is adopted to express; otherwise, the analysis is performed; and (3) the analogy is performed in sequence by the process to finish the analysis of the Nth oil well indicator diagram. The method optimizes the data analysis through judging and acquiring the indicator diagram similarity, so that the unnecessary calculation and storage are reduced, the analysis time is saved, the computer operation load is reduced, the improvement of the data analysis processing speed and the enhancement of the database storage and query efficiency are facilitated.

Description

technical field [0001] The invention belongs to the technical field of oil field digitization, and in particular relates to a method for judging the similarity of oil well indicator diagrams, which is used for analyzing and processing oil well indicator diagrams. Background technique [0002] It is an important technical means to manage oil wells in today's oilfield production site by using oil well indicator diagrams to monitor oil well production and operation dynamics. For low-permeability oilfields, due to the low formation permeability and irregular fluid production, the phenomenon of low fluid production and intermittent fluid production in oil wells is common. In order to improve the accuracy of diagnosing oil well conditions and measuring oil well fluid production using dynamometer diagrams, it is necessary to obtain a large amount of collected data every day. Accumulated over time, the massive collection of data and analysis results will cause the analysis server to...

Claims


Application Information

Patent Timeline
Patent Type & Authority Applications(China)
IPC IPC(8): E21B47/00
CPCE21B47/00G06F30/367
Inventor 李明江杨仓海李永清于世春樊晨黄天虎李珍邱亮赵晓龙张彬于洋邱奇田殿龙
Owner PETROCHINA CO LTD
Why Eureka
Try Eureka