Method for modeling relationship between chemical wood pulp cellulose characteristics and paper sheet tensile strength
A technology of tensile strength and modeling method, applied in the field of pulp and paper making, to achieve the effect of clear physical meaning and simple model
- Summary
- Abstract
- Description
- Claims
- Application Information
AI Technical Summary
Problems solved by technology
Method used
Image
Examples
Embodiment 1
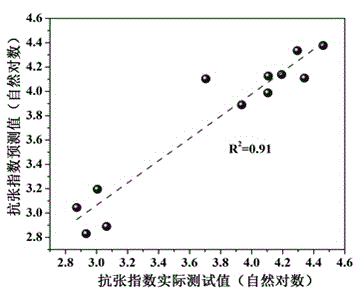
[0040] The wood pulp boards were deflaked and PFI refined, and the refining revolutions were 2500R and 4500R. Each fiber slurry that is obtained is made into quantitatively 60g / m 2 The paper sheets were dried naturally in a constant temperature and humidity laboratory (temperature: 23±1°C, humidity: 50±2%RH) for 24 hours, and the tensile strength and elongation of the paper sheets were tested. The fiber shape test is carried out with a fiber quality analyzer, and the fiber crimp index C calculated based on the weight-average fiber length is obtained w . Bring the tensile strength, elongation and curl index of the fiber into the paper tensile strength model T=m·C w a ·s b Among them, the Minitab statistical analysis software is used for fitting, and the correlation coefficient of the model prediction value and the tensile strength (natural logarithm) of the test is 0.91, and the mathematical expression of the model is: T=46.53 C w -0.48 ·s 1.21 , see Figure 1(a).
Embodiment 2
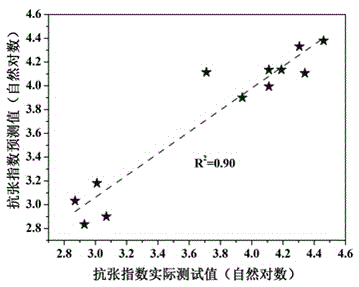
[0042] The wood pulp boards were deflaked and PFI refined, and the refining revolutions were 2500R and 4500R. Each fiber slurry that is obtained is made into quantitatively 60g / m 2 The paper sheets were dried naturally in a constant temperature and humidity laboratory (temperature: 23±1°C, humidity: 50±2%RH) for 24 hours, and the tensile strength and elongation of the paper sheets were tested. The fiber shape test is carried out with a fiber quality analyzer, and the fiber crimp index C calculated based on the weight-average fiber length is obtained w , the weight-average fiber length l w . Incorporate sheet tensile strength, elongation, fiber crimp index, and weight-average length into the sheet tensile strength model Adopt Minitab statistical analysis software to carry out fitting, the correlation coefficient of the model prediction value obtained and test value is 0.90, and the mathematical expression of model is: T=44.26 C w -0.46 ·s 1.22 l w -0.22 , see Figure 1(...
Embodiment 3
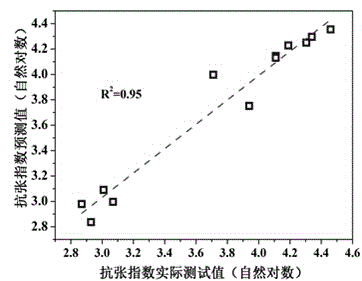
[0044] The wood pulp boards were deflaked and PFI refined, and the refining revolutions were 2500R and 4500R. The water retention value (WRV) of pulp before and after refining was determined. Then each fiber slurry that obtains is made quantitatively and is 60g / m 2 After the paper sheets were dried naturally for 24 hours in a laboratory with constant temperature and humidity (temperature: 23±1°C, humidity: 50±2%RH), the tensile strength and elongation of the paper sheets were tested. Fiber quality analyzer is used to carry out fiber shape test, and the weight-average length l of the fiber is measured w , bringing the paper tensile strength, elongation, water retention value of the pulp and fiber weight-average length into the paper tensile strength model Using Minitab statistical analysis software to fit, the correlation coefficient of the obtained model prediction value and test value is 0.95, and the mathematical expression of the model is: T=7.91×10 -3 ·WRV 1.62 ·s 0....
PUM
 Abstract
Description
Claims
Application Information
 - R&D
- Intellectual Property
- Life Sciences
- Materials
- Tech Scout
- Unparalleled Data Quality
- Higher Quality Content
- 60% Fewer Hallucinations
Browse by: Latest US Patents, China's latest patents, Technical Efficacy Thesaurus, Application Domain, Technology Topic, Popular Technical Reports.
© 2025 PatSnap. All rights reserved.Legal|Privacy policy|Modern Slavery Act Transparency Statement|Sitemap|About US| Contact US: help@patsnap.com


