Power supply data visualized monitoring system based on visualization technology

A monitoring system and data technology, applied in the field of visualization, can solve the problems of low real-time performance, single data display form, poor interactivity, etc., and achieve the effect of high real-time performance, strong interactivity, and diversified data display forms.

Inactive Publication Date: 2015-08-05
CHONGQING UNIV
View PDF5 Cites 18 Cited by
  • Summary
  • Abstract
  • Description
  • Claims
  • Application Information

AI Technical Summary

Problems solved by technology

[0011] In order to overcome the disadvantages of the existing power supply data visualization, such as single data display form, low real-time performance and poor interactivity, the present invention provides a power supply data visualization monitoring system based on visualization technology with rich display forms, high real-time performance and good interactivity.

Method used


Image

  • Power supply data visualized monitoring system based on visualization technology

Examples


Embodiment Construction

[0032] Hereinafter, preferred embodiments of the present invention will be described in detail with reference to the accompanying drawings. It should be understood that the preferred embodiments are only for illustrating the present invention, but not for limiting the protection scope of the present invention.

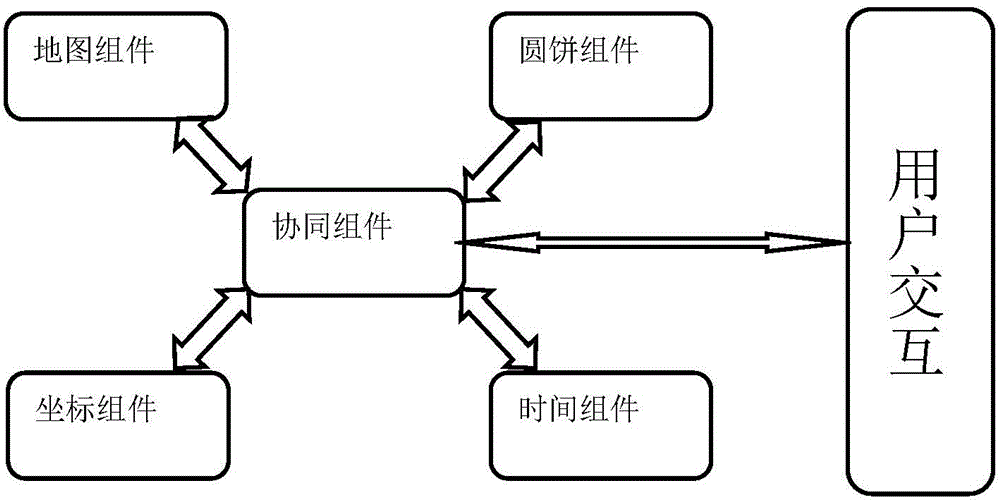
[0033] refer to figure 1 , a power supply data visualization monitoring system based on visualization technology, the power supply data visualization monitoring system includes:

[0034] The power supply map visualization component is used to mark the actual geographic location of each building on the map according to the map and the geographic location data of the building. Users browse and query the location information of all buildings on the map, and specify certain buildings to highlight or hide Display; in the map operation, the user can arbitrarily zoom and move the map to view the detailed building location; when the user selects a certain building, the map co...


PUM


Abstract

The invention discloses a power supply data visualized monitoring system based on visualization technology. The system comprises a map visualization assembly which is used for marking actual geographic positions of buildings on a map according to map and building geographic position data; a pie graph visualization assembly which is used for expressing some numeric data (or statistic data) of a power supply system with circular area size and color; a coordinate visualization assembly which is used for visualizing multidimensional power supply attention data; a time point visualization assembly which is used for expressing discrete time series data; and a collaborative analysis assembly which is used for closely connecting each visualization assembly, so that when a user carries out different selection operation on different visualization assemblies, different visualization effects of the selected data can be displayed in real time in other assemblies correspondingly. The beneficial effects of the system are that data expression form is diversified, real-time performance is high and interactivity is high.

Description

technical field [0001] The invention relates to a visualization technology crossing multiple fields such as computer graphics and human-computer interaction, and in particular to a power supply data visualization monitoring system of the visualization technology. Background technique [0002] Information visualization is a cross-field. It extends visualization technology to the field of large databases. By converting the data items in the database into the form of graphics and images, it realizes the visual presentation of large-scale non-numerical information resources, so as to discover the inherent connection and Development Law. With the continuous increase of data volume and complexity, traditional data analysis and data mining tools are inefficient in processing and analyzing such data. Therefore, more effective methods are needed to visually analyze power supply data. Information visualization is the use of computer graphics and image processing technology to display...

Claims


Application Information

Patent Timeline
Patent Type & Authority Applications(China)
IPC IPC(8): G01R31/00
Inventor 郭茂耘周国庆柴毅屈剑锋付雪青
Owner CHONGQING UNIV
Why Eureka
Try Eureka