Data scientific visualization-oriented inverse distance weighting mixed interpolation method

An inverse distance weighted, data-oriented technology, applied in complex mathematical operations and other directions, can solve problems such as low computational efficiency and insufficient computational efficiency and accuracy.

Inactive Publication Date: 2016-09-21
SHANGHAI UNIV
View PDF2 Cites 17 Cited by
  • Summary
  • Abstract
  • Description
  • Claims
  • Application Information

AI Technical Summary

Problems solved by technology

This algorithm overcomes the problem of high computational efficiency in the traditional

Method used


Image

  • Data scientific visualization-oriented inverse distance weighting mixed interpolation method
  • Data scientific visualization-oriented inverse distance weighting mixed interpolation method
  • Data scientific visualization-oriented inverse distance weighting mixed interpolation method

Examples


Embodiment 1

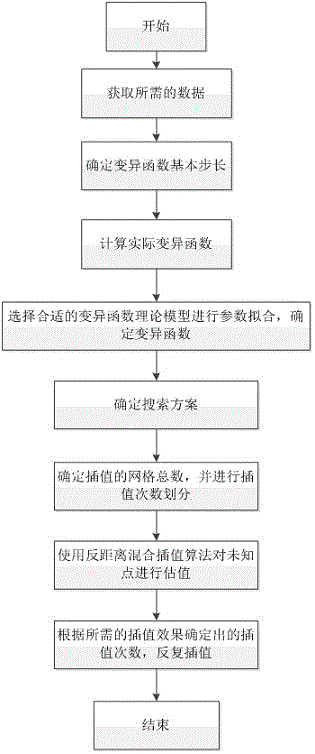
[0100] Embodiment one: see figure 1 — Figure 8 , an inverse distance hybrid interpolation method for data science visualization.

Embodiment 2

[0101] Embodiment 2: This inverse distance hybrid interpolation method for data scientific visualization, the specific operation steps are as follows:

[0102] (1) Obtain the required data information

[0103]The data used in this algorithm mainly comes from scientific monitoring data that has been processed. The location of the data is determined by the longitude and latitude, and the intensity value is obtained from the monitoring data values ​​of different types and different time periods provided by the remote sensing data. In the same plane, latitude and longitude can uniquely identify a point, so the longitude and latitude are directly regarded as the coordinates of the point during research. Thus, the data of a certain point can be transformed into three domains for description: the x coordinate represents the latitude, the y coordinate represents the longitude, and the z represents the attribute value.

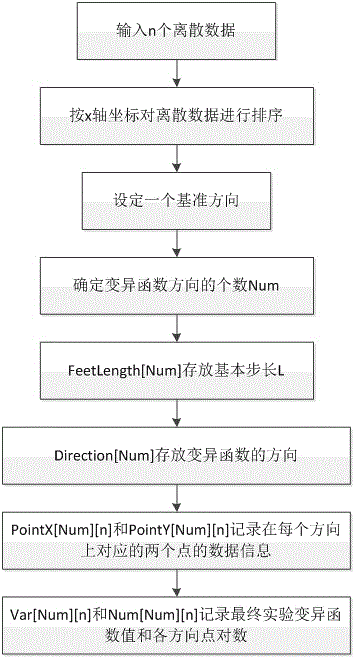
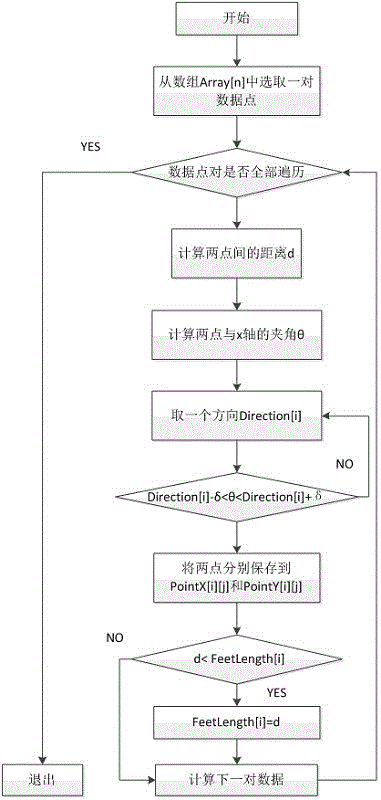
[0104] (2) Calculate the variation function of the experiment ...


PUM


Abstract

The invention discloses a data scientific visualization-oriented inverse distance weighting mixed interpolation method. For advantages and disadvantages of a conventional interpolation method, a new mixed interpolation method is proposed in combination with a parameter estimation point azimuth search method and an improved interpolation point cyclic interpolation mode by mixing an inverse distance weighting interpolation method with a Kriging interpolation method. The data interpolation method comprises the steps of (1), obtaining required data information; (2), calculating an experimental variance function; (3), selecting a proper variance function theoretical model for performing parameter fitting, and determining variance function parameters; (4), determining a participation point search scheme; (5), determining the total number of required interpolation grids and performing interpolation frequency division; and (6), performing cyclic interpolation until an interpolation effect is achieved.

Description

technical field [0001] The invention relates to the field of computer science visualization, in particular to an inverse distance weighted hybrid interpolation method oriented to data science visualization. Background technique [0002] With the development of computer technology, in order to gain a deeper understanding of the data in research, scientific visualization technology came into being. Scientific visualization technology can make data more intuitive, more vivid, and more effective in front of people, which is convenient for people to discover and mine the laws and information among data, and is conducive to more in-depth scientific research. However, the data we often collect is discrete, and the estimation of unknown data is involved in the process of visualization. Therefore, people have conducted research on this aspect, and one of the methods is to use adjacent known spatial data to estimate and guess unknown spatial data values, that is, spatial interpolatio...

Claims


Application Information

Patent Timeline
IPC IPC(8): G06F17/15
CPCG06F17/15
Inventor 胡小梅王瑜斌
Owner SHANGHAI UNIV
Why Eureka
Try Eureka