Electric power system carbon emissions real-time measuring method and carbon meter system

A power system, real-time measurement technology, applied in system integration technology, information technology support system, computing, etc., can solve the problems of inability to realize real-time measurement of carbon emissions, inability to intuitively display carbon emissions, and unfavorable real-time carbon emissions for power users.

Active Publication Date: 2016-12-21
TSINGHUA UNIV
4 Cites 12 Cited by

AI-Extracted Technical Summary

Problems solved by technology

The existing macro-statistical method attributes all carbon emissions to the power plant level, which cannot reflect the network characteristics of the power system and ignores the flow and distribution of carbon emissions from "source" to "exit".
Moreover, it is impossible to realize real-time measurement...

Abstract

The invention relates to an electric power system carbon emission real-time measuring method and a carbon meter system and belongs to the electric power system low-carbon technical field. The method includes the following steps that: the basic index of the carbon emission flow of an electric power system is determined; corresponding initial data are generated according to power flow distribution in an electric power network, the injection power of power plants and the topological structure data of the network; the carbon emission flow of the electric power network is calculated according to the obtained initial data; and the carbon potential of each node, branch carbon flow rates and corresponding load carbon flow rates can be obtained. The carbon meter system is composed of carbon meters which are dispersed at various positions of China, a central server and communication lines connected with the carbon meters and the central server, wherein the carbon meters are divided into power generation-side carbon meters, network-side carbon meters and user-side carbon meters, wherein the network-side carbon meters is composed of power transmission network carbon meters and power distribution network carbon meters. With the electric power system carbon emission real-time measuring method and the carbon meter system of the invention adopted, real-time continuous measurement of the carbon emissions of different main bodies of the electric power system can be realized.

Application Domain

Technology managementResources +3

Technology Topic

Continuous measurementPower grid +11

Image

  • Electric power system carbon emissions real-time measuring method and carbon meter system
  • Electric power system carbon emissions real-time measuring method and carbon meter system
  • Electric power system carbon emissions real-time measuring method and carbon meter system

Examples

  • Experimental program(1)

Example Embodiment

[0052] A method for real-time measurement of carbon emissions in a power system and a carbon meter system proposed by the present invention are further described in detail below with reference to the accompanying drawings and specific embodiments.
[0053] A method for real-time measurement of carbon emissions in a power system proposed by the present invention specifically includes the following steps:
[0054] 1) Determine the basic indicators of carbon emission flow in the power system;
[0055] The basic indicators of carbon emission flow in the power system include node carbon potential, carbon flow rate, carbon flow and branch carbon flow density. The specific definitions of each indicator are:
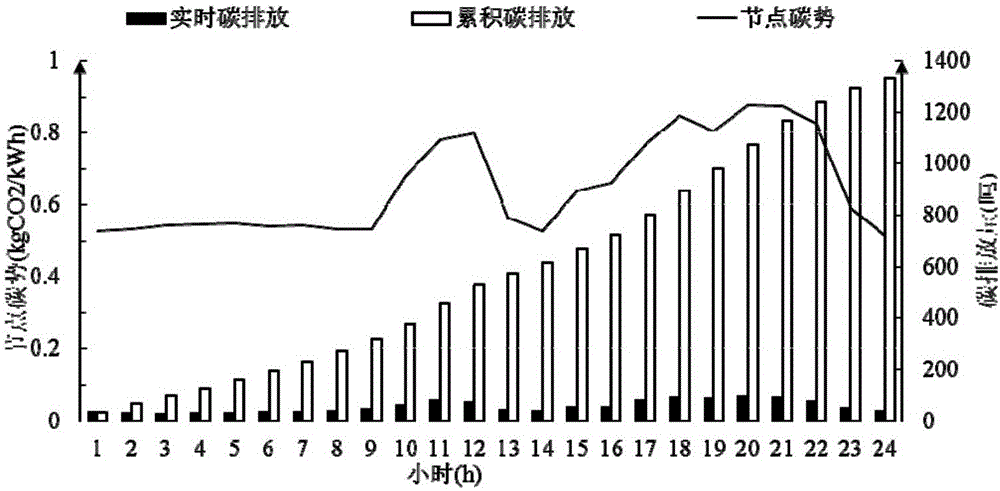
[0056] 1-1) Node carbon potential: the carbon emission on the power generation side caused by the unit of electricity generated or transmitted at the node, the unit is kgCO 2 /kWh; the node carbon potential needs to be obtained through the power system carbon emission flow calculation method;
[0057] 1-2) Carbon flow rate: The carbon flow rate is defined as the carbon emission flow that flows through a node or branch in unit time, and the unit is kg CO2/s or t CO2/s; the carbon flow rate includes the node carbon flow rate , branch carbon flow rate and network loss carbon flow rate, the carbon flow rate is obtained through the calculation method of carbon emission flow in the power system;
[0058] 1-3) Carbon flow: Carbon flow is a basic physical quantity that describes carbon flow to characterize the size of carbon flow in the system; it is defined as the cumulative amount of carbon emissions corresponding to the tidal current in a given time, and the unit is kg CO 2 or tCO 2;
[0059] 1-4) Branch carbon flow density: represents the carbon emission corresponding to the unit electricity transmitted by the branch;
[0060] 1-5) Carbon potential of the unit: Indicates the carbon emission generated by the unit of electricity generated by the generator, the unit is kg CO 2 /kWh; For thermal power units, the carbon potential of the unit is obtained according to the real-time coal consumption data and operating status of the thermal power plant (while other types of power plants such as hydropower, wind power, photovoltaics do not produce carbon emissions, so the carbon potential of the unit is zero);
[0061] 2) According to the power flow distribution in the power network, the injected power of each power plant and the topology data of the network, the corresponding initial data is generated. The initial data includes: branch power flow distribution matrix, unit injection distribution matrix, node active power flux matrix and unit carbon potential vector;
[0062] 2-1) Branch power flow distribution matrix:
[0063] Branch power flow distribution matrix P B Describe the active power flow distribution in the power system. The matrix contains both the topology information of the power network and the distribution information of the steady-state active power flow of the system;
[0064] In the power system, if a branch is connected between node i and node j (i,j=1,2,...,N), and the forward active power flow flowing into node i through this branch is p, then P Bij =0, P Bji =p(P Bij represents the branch power flow distribution matrix P B The element at row i and column j, P Bji represents the branch power flow distribution matrix P B element in row j, column i); if the active power flow p flowing through the branch is a reverse flow, then P Bij =p,P Bji =0; otherwise P Bij =P Bji = 0; for all diagonal elements, there is P Bii =0(i=1,2,...,N);
[0065] 2-2) Unit injection distribution matrix
[0066] Unit injection distribution matrix P G It describes the connection relationship between all generator sets and the power system and the active power injected by the generator sets into the system. It is also the boundary condition for describing the carbon emission flow generated by the generator sets in the system; the element P in the generator set injection distribution matrix Gkj (the element of the kth row and the jth column of the matrix) is specifically defined as follows:
[0067] If the kth (k=1,2,...,K) generator set is connected to node j, and the active power flow injected into node j from this set is p, then P Gkj =p, otherwise P Bji = 0;
[0068] 2-3) Node active flux matrix
[0069] In the calculation of carbon emission flow, the carbon potential of the node is only affected by the injected power flow, and the power flow from the node has no effect on the carbon potential of the node; therefore, the calculation of the carbon emission flow only focuses on the active power flow of the incoming node under the direction of the power flow. Absolute quantity, called node active flux P N; element P of the nodal active flux matrix Nii (The i-th row diagonal element of the matrix) is specifically defined as follows:
[0070] For node i, let I + represents the set of branches with flow flowing into node i, p Bs is the active power of branch s, then:
[0071] P N i i = Σ s ∈ I + p B s + P G i - - - ( 1 )
[0072] In the formula: P Gi is the active power output of the unit connected to node i (if the node has no generator unit or the unit output is 0, then P Gi =0); all off-diagonal elements P in the matrix Nij =0(i≠j);
[0073] 2-4) Power plant carbon potential vector
[0074] Different power plants have different carbon potentials, which are known conditions in the carbon flow calculation. The carbon potential vector E of the generator sets that make up the system G; Let the carbon potential of the kth (k=1,2,…,K) power plant be e Gk , then the carbon potential vector of the power plant is shown in formula (2):
[0075] E G =[e G1 ,e G2 ,…,e GK ] T (2)
[0076] 3) Calculate the carbon emission flow in the power grid using the initial data obtained in step 2), thereby obtaining the carbon potential of each node, the branch carbon flow rate and the corresponding load carbon flow rate; the specific steps are as follows:
[0077] 3-1) Calculate the nodal carbon potential, as shown in formula (3):
[0078] e N i = Σ s ∈ I + P B s · ρ s + P G i · e G i Σ s ∈ I + P B s + P G i - - - ( 3 )
[0079] In the formula, I + represents the set of lines that inject power into node i, P Bs represents the active power of line s, P Gi The injected active power of the power plant connected to node i; ρ s represents the carbon flux density of line s, which is equal to the carbon potential of the line injected into the node; e Gi represents the carbon potential of the power plant connected to node i;
[0080] Write Equation (3) in matrix form, that is, the carbon potential of each node in the system is obtained as shown in Equation (4):
[0081] E N = ( P N - P B T ) - 1 · P G T · E G - - - ( 4 )
[0082] 3-2) Calculate the branch carbon flow rate distribution and load carbon flow rate in the network;
[0083] The branch carbon flow rate is shown in formula (5):
[0084] R BL =P BL ·e N (5)
[0085] In the formula, R BL is the branch carbon flow rate; P BL is the active current of the branch; e N is the carbon potential of the branch head node;
[0086] The load carbon flow rate is shown in formula (6):
[0087] R BD =PBD ·e N (6)
[0088] In the formula, R BD is the load carbon flow rate; P BL is the active power of the load; e N is the carbon potential of the node where the load is located;
[0089] 4) Calculate the carbon emission flow in the power grid according to step 3), thereby obtaining the results of the carbon potential of each node, the branch carbon flow rate and the corresponding load carbon flow rate, and the carbon flow distribution in the entire power network is obtained; The above results can clarify the carbon emission responsibility of the whole link of the power grid, and obtain the carbon emission corresponding to the power consumption of the power user.
[0090] The above method of the present invention can be implemented by conventional programming techniques.
[0091] A carbon meter system for realizing the above-mentioned real-time measurement method of carbon emissions in a power system proposed by the present invention has the following structure: figure 1 shown. The carbon meter system is composed of carbon meters, a central server, and a communication line connecting each carbon meter and the central server, which are distributed in the entire network where carbon emissions need to be measured; the central server, as a computing center, is responsible for the flow of carbon emissions in the network. According to its different location distribution in the power system, the carbon meter is divided into power generation side carbon meter, transmission network carbon meter and distribution network carbon meter. The grid carbon meter consists of the network side carbon meter and the user side carbon meter, which are installed in the power plant, each node of the power grid, and the power user side respectively. The communication line communicates and transmits the collected information with the central server, and displays the calculation results fed back by the central server. The solid line in the figure represents the power line, and the dotted line with arrows represents the communication line and communication direction.
[0092] The carbon meter system is composed of different types of carbon meters and a central server to form a system with a layered structure, which is divided into three layers: an upper system, a middle system and a lower system; the upper system includes the central server, the carbon meter on the power generation side and the power transmission system The network carbon meter and the power generation side carbon meter calculate the carbon emission intensity of the power plant according to the real-time coal consumption data of the power plant and the emission coefficient of the coal used by the method for real-time measurement of carbon emissions in the power system proposed by the present invention, and then calculate the carbon emission flow in the transmission network. According to the data of the transmission network carbon meter, calculate the real-time carbon emission corresponding to the loss of the line or transformer connected to the node; the middle system is composed of the distribution network carbon meter, and the distribution network carbon meter is connected to the transmission network Network carbon meter communication obtains the carbon potential of the root node and the injection power information of the root node, and calculates the distribution of carbon emission flow in the distribution network; the lower system includes the user-side carbon meter, and the user-side carbon meter communicates with the distribution network carbon meter through communication. , obtain the carbon potential of the node where the user is located, and obtain the carbon emission caused by the power consumption of each user.
[0093] In the carbon meter system proposed by the present invention, the functions of each part are specifically described as follows:
[0094] The central server implements the real-time measurement and display of the carbon emissions of the power system by applying the method for real-time measurement of carbon emissions in the power system proposed by the present invention, and through the functions of communication with the carbon meter, data collection and display. The basic measurement and display indicators of the carbon meter include node carbon potential, real-time carbon flow rate and cumulative carbon emissions; for the user-side carbon meter, it is also necessary to display the user's electricity consumption, cumulative electricity consumption and other electricity consumption data. Obtained by communicating with the central server. In addition to the above basic indicators, different types of carbon meters also have corresponding different functions. Specifically include:
[0095] 1) The carbon meter on the power generation side is installed at the outlet of the power plant to measure the carbon potential of the power plant and measure the real-time carbon emission of the power plant, and communicate with the central server to transmit relevant information.
[0096] For thermal power plants, the carbon table on the power generation side needs to calculate the carbon emission intensity of the power plant according to the real-time coal consumption data of the power plant and the emission coefficient of the coal used. The calculation formula is shown in Equation (7):
[0097] e G = 7 · r · EF M q - - - ( 7 )
[0098] In the formula, e G is the carbon potential of power plant G, in kg CO 2 /kWh; r is the coal consumption for power supply of the thermal power plant, EF M is the carbon emission coefficient of coal used in thermal power plants, in kg CO 2 /kg; q is the combustion calorific value of the coal used in the thermal power plant, in kcal/kg;
[0099] For hydropower plants, nuclear power plants and new energy power plants such as wind power and photovoltaics, carbon emissions are usually not generated during power generation, so their carbon emission intensity is equal to 0.
[0100] In addition, the carbon table on the power generation side should also calculate the real-time carbon emissions and cumulative carbon emissions of the power plant according to the carbon emission intensity of the power plant and the injected power of the power plant. The calculation formulas are shown in equations (8) and (9) respectively. :
[0101] E Gt =P Gt ·Δt·e Gt (8)
[0102] E G = Σ t ∈ T P G t · Δ t · e G t - - - ( 9 )
[0103] In formula (8) and formula (9), E Gt is the real-time carbon emission of power plant G in time period t, E G is the cumulative carbon emissions of power plant G, in kg CO 2;P Gt is the active power output corresponding to the power plant G in the period t; e Gt is the carbon potential of the unit corresponding to the power plant G in the period t, the value can be calculated from the carbon table on the power generation side by formula (7); Δt is the duration of the period t. 2) The carbon meter on the network side is installed at each node of the power grid. According to the different voltage levels of the network, it is divided into a transmission network carbon meter and a distribution network carbon meter. The main function of the carbon meter on the network side is to calculate the carbon potential of the node where the carbon meter is located and to measure the carbon flow rate through each node by communicating with the central server or with the adjacent nodes.
[0104] In addition, according to the data of the carbon meter on the network side, the real-time carbon emission corresponding to the loss of the line or transformer connected to the node is calculated, as shown in formula (10):
[0105] E Nt =(P 1t -P 2t )·Δt·e Nt (10)
[0106] The cumulative amount of carbon emissions corresponding to the loss of the line or transformer connected to the node is shown in formula (11):
[0107] E N = Σ t ∈ T ( P 1 t - P 2 t ) · Δ t · e N t - - - ( 11 )
[0108] In formula (10) and formula (11), E Nt Indicates the real-time carbon emission corresponding to the loss of the line or transformer; E N Indicates the cumulative amount of carbon emissions corresponding to line or transformer losses; P 1t Indicates the active power corresponding to the head-end node of the line or the primary side of the transformer in the period t, P 2t Represents the active power corresponding to the end node of the line or the secondary side of the transformer in the period t; e Nt is the carbon potential of the line head node or the node where the transformer is located.
[0109] 3) The user-side carbon meter is installed on the power user terminal. In addition to the necessary communication and data collection functions, it also measures the carbon emissions caused by the electricity consumption of power users and displays it visually based on the calculation results of the network carbon emissions flow. The real-time carbon emissions caused by the power consumption of power users are shown in formula (12):
[0110] E Ct =P Ct ·Δt·e Ct (12)
[0111] The cumulative amount of carbon emissions caused by the power consumption of power users is shown in formula (13):
[0112] E C = Σ t ∈ T P C t · Δ t · e C t - - - ( 13 )
[0113] In formula (12) and formula (13), E Ct Represents the real-time carbon emissions caused by the electricity consumption of electricity users; E C Represents the cumulative amount of carbon emissions caused by the electricity consumption of electricity users; P Ct Represents the load active power of the power user in the t period; e Ct is the carbon potential of the node where the power user is located;
[0114] For the distributed power generation on the user side, the user-side carbon meter also measures the carbon emissions generated by the distributed power generation. Calculate the cumulative carbon emissions of the distributed power generation; sum the carbon emissions of the distributed power generation with the carbon emission results of the power users obtained by Equation (13) to obtain the actual user-side carbon emissions of the distributed power generation.
[0115] (The various types of carbon meters in the present invention can use traditional electricity metering meters, and the metering program of the present invention can be pre-embedded in the meter, or other metering instruments can be used to add programs to realize the above functions)
[0116] The specific workflow of the carbon meter system proposed by the present invention is described as follows:
[0117] 1) The upper-layer system includes a central server, a power generation side carbon meter and a transmission network carbon meter, which are used to calculate the distribution of carbon emission flows in the power network.
[0118] 1.1) The carbon table of each power generation side calculates the carbon potential and carbon emissions of the corresponding power plant by collecting data. The calculation formulas are shown in formulas (7), (8) and (9); and transmit the carbon potential data of the power plant to the central server. , the central server uses the power plant carbon potential data transmitted by the power generation side carbon meter and the network power flow distribution data obtained by itself, and uses the power system carbon emission real-time measurement method proposed by the present invention to calculate the carbon emission flow distribution of the transmission network.
[0119] 1.2) The central server communicates with the generation side carbon meter and the transmission network carbon meter, and transmits the results of the carbon potential, node carbon flow rate and active power of each node in the network to each generation side carbon meter and transmission network carbon meter. The transmission network displays the carbon potential, node carbon flow rate, and active power of the node where the central server transmits the results in real time and intuitively.
[0120] 2) The middle-level system is composed of the distribution network carbon meter; the distribution network carbon meter obtains the carbon potential of the root node (that is, the node connected to the transmission network in the distribution network) and the carbon potential of the root node through communication with the connected transmission network carbon meter. Information such as power is injected, and based on this information, the distribution of carbon emissions flows from the distribution network is calculated.
[0121] Since the distribution network is a radial network, the calculation of the node carbon potential in the distribution network is relatively simple. Starting from the root node, the carbon potential of each node in the distribution network is calculated in turn along the radial direction of the network, and finally each terminal load can be obtained. The carbon potential of the node at which it is located.
[0122] The formula for calculating the carbon potential of the distribution network is shown in Equation (14):
[0123] e N i = Σ s ∈ I + P B s · ρ s + P R i · e R i Σ s ∈ I + P B s + P R i - - - ( 14 )
[0124] In the formula, e Ni represents the carbon potential of node i in the distribution network; P Ri Active power injected into node i by connecting to the transmission grid, if node i is not the root node, then P Ri =0;;e Ri represents the carbon potential of the root node connected to node i.
[0125] After the carbon emission flow distribution of the distribution network is calculated, the real-time carbon emission data of the power consumption on the user side can be obtained. This part of the function is realized by the lower layer system.
[0126]3) The lower system is the user-side carbon meter, and the user-side carbon meter communicates with the distribution network carbon meter to obtain the carbon potential of the node where the user is located. And calculate the carbon emissions caused by the power consumption of each user, the calculation formulas are shown in formulas (12) and (13).
[0127] After the above steps, the carbon potential and carbon flow rate of each node in the entire network, the real-time carbon emissions and cumulative carbon emissions of each power plant, and the real-time carbon potential and power consumption of the nodes where each power user is located can be obtained. Carbon emissions, cumulative carbon emissions.
[0128] The method for real-time measurement of carbon emissions in a power system and its carbon meter system proposed by the present invention are applied to the embodiment of the IEEE 24 node system to measure carbon emissions and verify the effectiveness of the present invention.
[0129] The system applied in the embodiment of the present invention has a total of 12 power plants, and the installed capacity and carbon emission intensity of each power plant are shown in Table 1.
[0130] Table 1 Basic parameters of the power plant
[0131]
[0132] The node where the load is located and its power are shown in Table 2:
[0133] Table 2 Load nodes and their power
[0134] the node
[0135] According to the real-time carbon emission measurement method and carbon meter system proposed in the present invention, firstly, the real-time carbon emission in each hour of the day caused by network loss and power user consumption in the power system can be obtained, such as: figure 2 shown. figure 2 The abscissa is time, in hours; the ordinate is carbon emissions, in tons. In the figure, user carbon emissions represent the carbon emissions on the power generation side caused by user power consumption, and network loss carbon emissions represent the carbon emissions on the power generation side caused by network losses. real-time changes. And take the carbon table at node 1 as an example, image 3 The real-time carbon emissions, cumulative carbon emissions and changes of node carbon potential measured and displayed by the carbon meter are given in each hour of the day. image 3 The abscissa is time, the unit is hour; the main ordinate is the nodal carbon potential, the unit is kg CO 2 /kWh, the subordinate ordinate is carbon emission, the unit is ton. In the figure, the bar graphs represent real-time carbon emissions and cumulative carbon emissions, respectively, and the curve represents the change of the carbon potential of node 1 over time.

PUM

no PUM

Description & Claims & Application Information

We can also present the details of the Description, Claims and Application information to help users get a comprehensive understanding of the technical details of the patent, such as background art, summary of invention, brief description of drawings, description of embodiments, and other original content. On the other hand, users can also determine the specific scope of protection of the technology through the list of claims; as well as understand the changes in the life cycle of the technology with the presentation of the patent timeline. Login to view more.
Why Eureka
Try Eureka