Forest-biomass remote sensing inversion method based on spectral curve characteristic differentiation

A forest biomass and spectral curve technology, applied in the field of forest biomass remote sensing inversion based on spectral curve feature differentiation, can solve the problems of complex radar extraction, smaller degrees of freedom, and lower estimation accuracy, and achieve inversion good effect

Inactive Publication Date: 2017-01-04
SOUTH CHINA BOTANICAL GARDEN CHINESE ACADEMY OF SCI +1
View PDF3 Cites 17 Cited by
  • Summary
  • Abstract
  • Description
  • Claims
  • Application Information

AI Technical Summary

Problems solved by technology

However, in actual research, the method of multivariate linear statistical regression is generally used. This method has certain defects, that is, it will enter the equation regardless of whether the independent variable is significant to the dependent variable, which will lead to a smaller degree of freedom of error and a lower estimation accuracy. , at the same time, if the variables are not completely independent of each other, the coefficient matrix of the entire equation system will appear ill-conditioned, which will cause a large error in the model
Secondly, due to its wavelength, optical images can only observe the information of the forest canopy, but cannot observe the information of vegetation branches and trunks. Therefore, there will inevitably be large errors in estimating the biomass of the entire forest using optical images.
The P-band and L-band of synthetic aperture radar have a certain penetration ability to the vegetation canopy and trunk, and can obtain the soil information of the vegetation canopy, trunk and even the surface layer. , terrain, etc. will have a significant impact on the backscatter coefficient of the radar, making the radar extraction of aboveground biomass in forests complicated
And the backscattering intensity of the radar increases linearly with the increase of the biomass. After reaching a certain biomass level, the backscattering tends to be saturated. The saturation threshold of the Landsat TM image when estimating the biomass is 15kg / m2, will have a certain impact on the estimation accuracy

Method used


Image

  • Forest-biomass remote sensing inversion method based on spectral curve characteristic differentiation
  • Forest-biomass remote sensing inversion method based on spectral curve characteristic differentiation
  • Forest-biomass remote sensing inversion method based on spectral curve characteristic differentiation

Examples


Embodiment

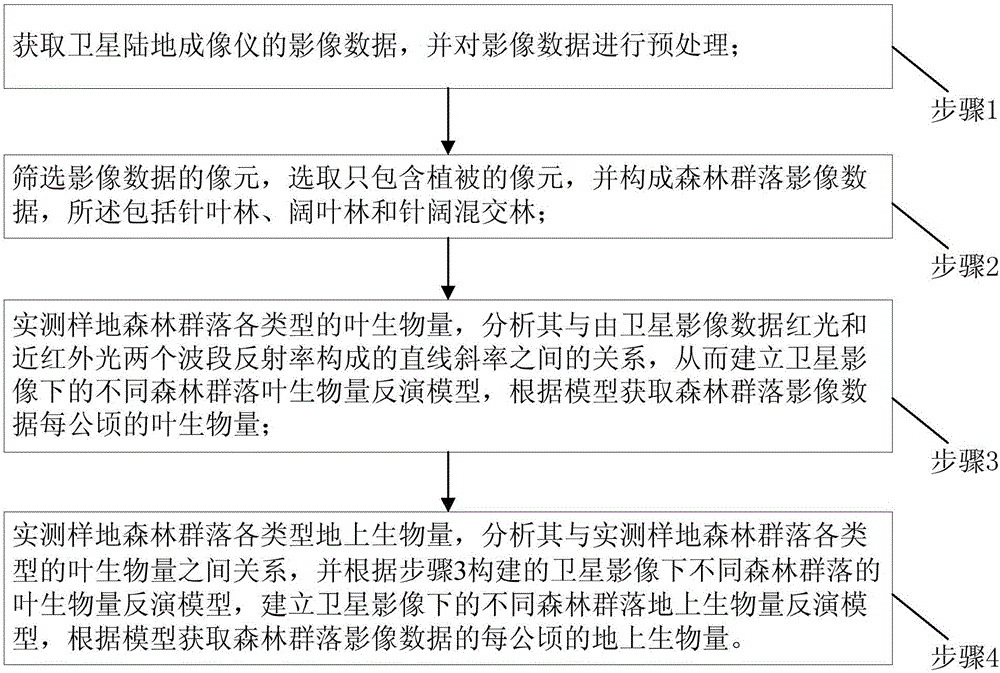
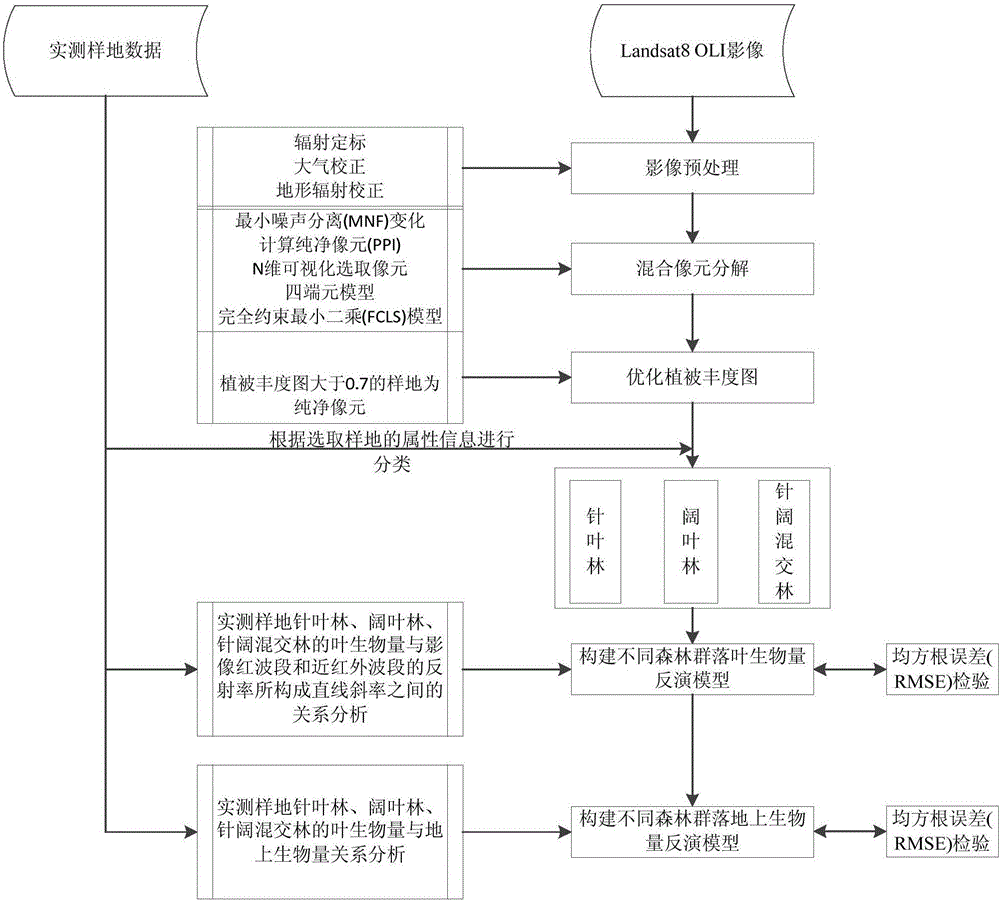
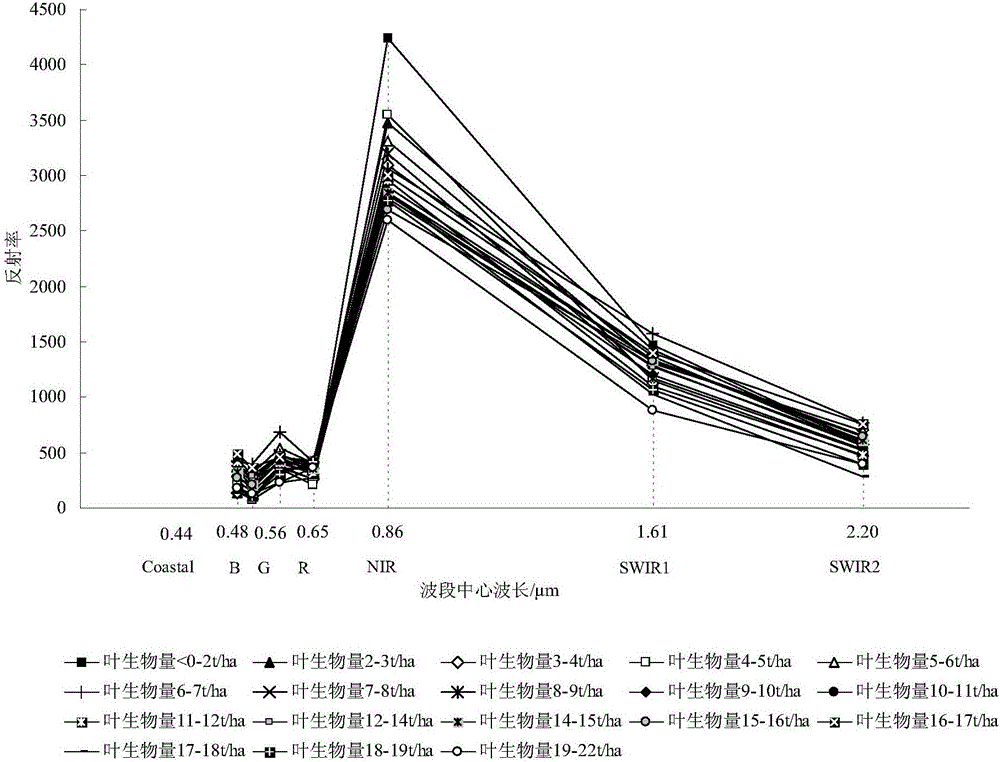
[0041]Plant leaves have strong absorption properties in the visible red band and strong reflection properties in the near-infrared band, which is the physical basis for vegetation remote sensing monitoring. The present invention finds that the lower the leaf biomass is, the higher the reflectivity of the near-infrared band is, and the steeper the slope of the two bands of near-infrared and red light is by investigating the graph of the leaf biomass and the corresponding Landsat8OLI image pure vegetation pixel reflectance. This may be related to the water content of the leaf canopy in the sample plot. When the leaf biomass of the vegetation in the sample plot is low, the total water content in the vegetation leaf surface of the sample plot is lower, and the near-infrared band of the Landsat8OLI sensor is sensitive to water The content of is the most sensitive, so the slope of the red light and near-infrared band reflectance can effectively reflect the difference in leaf biomass....


PUM


Abstract

The invention discloses a forest-biomass remote sensing inversion method based on spectral curve characteristic differentiation. Landsat 8OLI and actually measured data serve as a data source, and a forest-biomass leaf biomass and above-ground biomass inversion model which takes Landsat 8OLI red-light band reflectivity R, near-infrared band reflectivity NIR, red-light band central wavelength CW<R> and near-infrared band central wavelength CW<NIR> as characterization parameters is constructed. The model is good in inversion effect and provides a new technical method and means for rapidly, accurately and comprehensively estimating above-ground biomass of different forest community types in large stretches of forests.

Description

technical field [0001] The invention relates to the field of forest biomass detection, in particular to a forest biomass remote sensing inversion method based on spectral curve feature differentiation. Background technique [0002] Forest is an important resource for renewable and sustainable development, and plays an important role in global climate change, soil and water conservation, and carbon cycle in terrestrial ecosystems. As one of the raw materials with the most development potential in the world, forest biomass accounts for about 40% of the total biomass in the world, and China's forest biomass accounts for about 33% of the country's total biomass. For resource shortages and serious environmental pollution In China, forest biomass has attracted the attention of scholars and policy makers. [0003] The traditional methods of using remote sensing images to estimate forest biomass are as follows: 1) Extracting the vegetation index or the ratio between the bands relat...

Claims


Application Information

Patent Timeline
Patent Type & Authority Applications(China)
IPC IPC(8): G01S17/89
CPCG01S17/89
Inventor 陈修治苏泳娴李静
Owner SOUTH CHINA BOTANICAL GARDEN CHINESE ACADEMY OF SCI
Why Eureka
Try Eureka