Patent map visualization method and system

A technology for patent maps and patent documents, applied in the computer field, can solve the problems of inability to generate patent maps in real time, complex operation process, large memory overhead, etc., and achieve the effect of reducing memory overhead, simplifying operation process, and simplifying the amount of operation.

Active Publication Date: 2017-02-01
GREAT WALL COMP SOFTWARE & SYST CO LTD
View PDF4 Cites 11 Cited by
  • Summary
  • Abstract
  • Description
  • Claims
  • Application Information

AI Technical Summary

Problems solved by technology

However, in the existing patent map generation process, the calculation process is relatively complicated, the calculation amount is large, and the CPU and memory overhead are large, and the patent map cannot be generated and displayed in real time.

Method used


Image

  • Patent map visualization method and system
  • Patent map visualization method and system
  • Patent map visualization method and system

Examples


Embodiment Construction

[0038] The following will clearly and completely describe the technical solutions in the embodiments of the present invention with reference to the drawings in the embodiments of the present invention. Obviously, the described embodiments are part of the embodiments of the present invention, not all of them. Based on the embodiments of the present invention, all other embodiments obtained by persons of ordinary skill in the art without making creative efforts shall fall within the protection scope of the present invention.

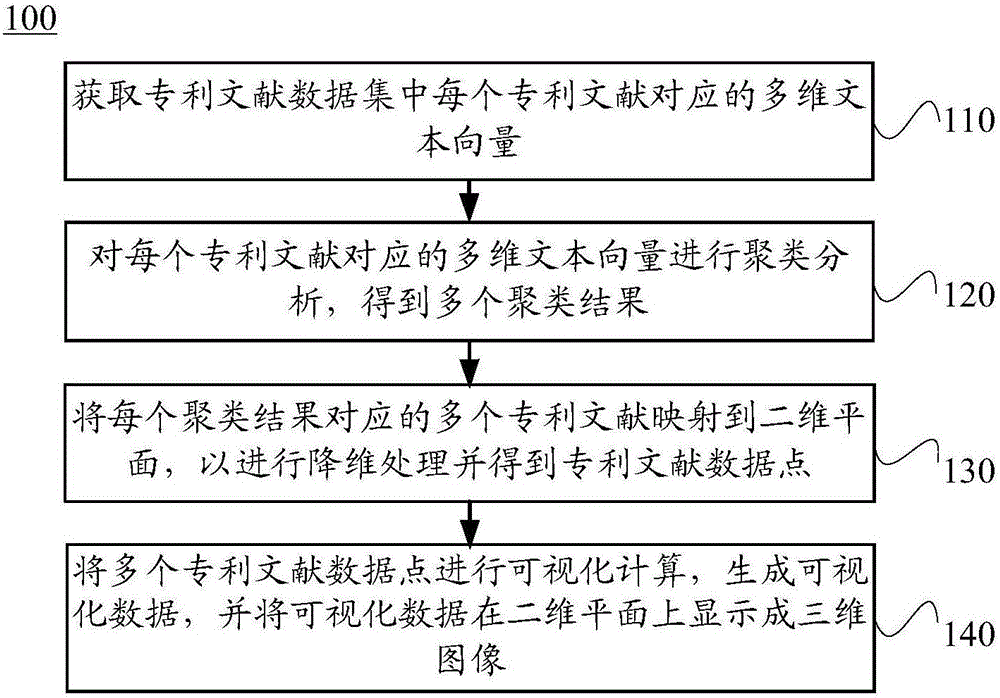
[0039] Such as figure 1 A patent map visualization method 100 shown includes:

[0040] 110. Obtain a multi-dimensional text vector corresponding to each patent document in the patent document dataset.

[0041] 120. Perform cluster analysis on the multi-dimensional text vector corresponding to each patent document, and obtain multiple cluster results.

[0042] 130. Map multiple patent documents corresponding to each clustering result to a two-dimensional ...


PUM


Abstract

The invention relates to a patent map visualization method and system. The patent map visualization method comprises the steps that multi-dimensional text vectors corresponding to patent literatures in a patent literature data set are obtained; clustering analysis is conducted on the multi-dimensional text vectors corresponding to the patent literatures to obtain multiple clustering results; multiple patent literatures corresponding to the clustering results are mapped to a two-dimensional plane so as to perform dimension reduction processing, and patent literature data points are obtained; visualized calculation is conducted on the multiple patent literature data points to generate visualized data, and the visualized data is displayed on the two-dimensional plane in a three-dimensional image mode. By the adoption of the patent map visualization method and system, the operation amount in the patent map generating process can be simplified, accordingly the occupation to a CPU and a memory is decreased, and real-time patent map generation and display are achieved.

Description

technical field [0001] The invention relates to the field of computer technology, in particular to a visualization method and system for a patent map. Background technique [0002] The patent map is composed of various graphic information related to patents. The patent map uses the statistical analysis method to carefully and finely analyze the patent technology information indicators and their combinations to make analytical and interpretable graphic information to reflect the intricate information contained in a large amount of patent data. [0003] On the patent map, a point represents a patent document, and the distance from a point to the center point represents the degree of technical correlation between the patent and the center point. The closer the distance, the higher the technical correlation. Through the patent map, we can judge the overall distribution of patented technology, technology hotspots, technology distribution of applicants, and changes of technology ...

Claims


Application Information

Patent Timeline
Patent Type & Authority Applications(China)
IPC IPC(8): G06F17/24G06F17/30G06K9/62
CPCG06F16/35G06F40/174G06F18/23213
Inventor 金忠良徐建堂林赞磊商雷
Owner GREAT WALL COMP SOFTWARE & SYST CO LTD
Why Eureka
Try Eureka