Liver function region explaining and analysis method including three-dimensional visualized display and attribute measurement

A liver function and liver technology, applied in the field of computer-aided medicine, can solve problems such as large amount of calculation and no application of liver system, and achieve the effect of reducing complexity, facilitating calculation and analysis, and reducing misjudgment

Active Publication Date: 2017-03-01
TONGJI UNIV
View PDF5 Cites 9 Cited by
  • Summary
  • Abstract
  • Description
  • Claims
  • Application Information

AI Technical Summary

Problems solved by technology

CamilleKurtz, Christopher F.Beaulieu, Sandy Napel, Daniel L.Rubin published an article titled A hierarchical knowledge-based approach for retrieving similar medical images described with semantic annotations on the 49th issue of Journal of biomedical informatics in 2014, proposing a structured-based An image analysis method based on vocabulary description. This method uses a pre-defined controlled vocabulary to describe image features, which facilitates the interpretation of medical images of large data sets. However, this method is only used to describe local liver tumor information, and does not Applied to the whole liver system; Ashnil Kumar, Shane Dyer, Changyang Li, PhilipH.W.Leong, Jinman Kim published an article entitled Automatic annotation of liver CT images: The submission of the BMET group to ImageCLEFmed 2014 on CEUR workshop proceedings in 2014, A liver image interpretation method based on multi-level classification and majority opinion rule is proposed. This method generates a set of structured reports by analyzing the differences between image features. This method focuses on solving image classification problems; Beyza Ermis, A.Taylan Cemgil published an article titled Liver CT annotation via generalized coupled tensor factorization on CEUR workshop proceedings in 2014, using a method based on generalized coupled tensor factorization to analyze data and obtain a satisfactory prediction accuracy, which requires a large amount of calculation; Imane Nedjar, Mahmoudi, Mohamed Amine Chikh, Khadidja Abi-yad, ZouheyrBouafia published an article entitled Automatic annotation of liver CT image: ImageCLEFmed 2015 on CEUR workshop proceedings in 2015. This method first preprocesses the original image, extracts the texture and texture of the liver and tumor Shape features, and then use the random forest classifier to classify and generate the final structured interpretation report. This method requires more manual intervention, and the extracted features do not include blood vessel information; Francisco Gimenez, Jiajing Xu, Yi Liu, Tiffany Liu, Christopher Beaulieu, Daniel Rubin, and Sandy Napel published an article entitled Automatic annotation of radiological observations in liver CT images on AMIA annual symposium proceedings in 2012. This method extracts 431-dimensional features such as grayscale, texture, shape, and edge to describe the liver area. The calculation is more complicated, and it has limited auxiliary judgment for doctors

Method used


Image

  • Liver function region explaining and analysis method including three-dimensional visualized display and attribute measurement
  • Liver function region explaining and analysis method including three-dimensional visualized display and attribute measurement
  • Liver function region explaining and analysis method including three-dimensional visualized display and attribute measurement

Examples


Embodiment 1

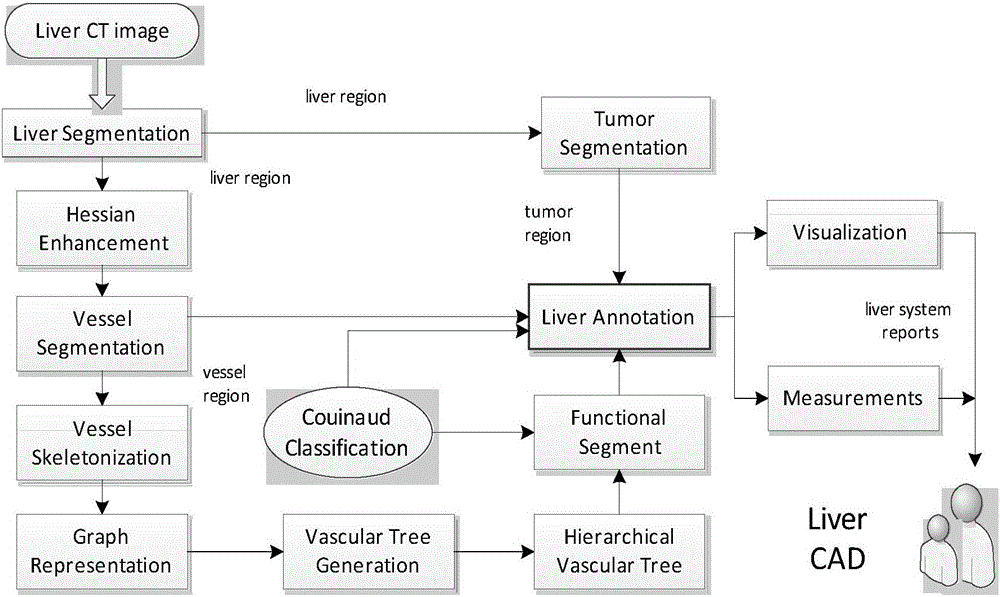
[0043] Refer to attached picture, in figure 1 A flow chart of the method of the present invention is provided in , and a group of embodiments are provided according to the flow chart of this diagram. The method first extracts the liver region, including the liver, hepatic vessels, and liver tumors, then extracts the hepatic portal vein skeleton and generates a directed acyclic graph, that is, the hepatic portal vein vascular tree, and then uses the vascular tree to divide the liver into corresponding functional segments, and finally Generate liver analysis report.

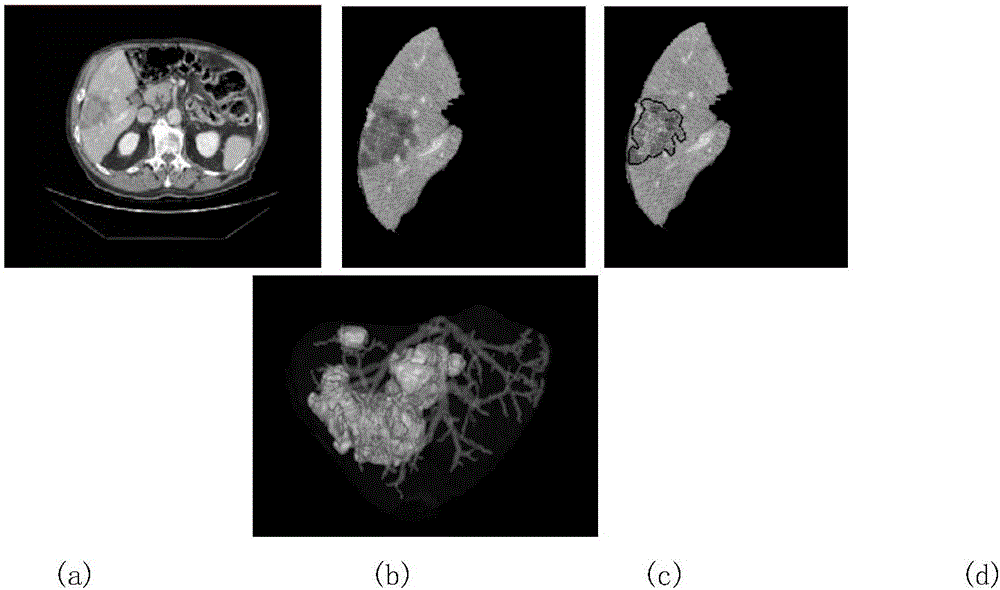
[0044] exist figure 2 In the example shown, the figure 2 (a) is a piece of original abdominal image data slice, figure 2 (b) is the segmented liver and hepatic vascular regions, figure 2 (c) is the segmented liver and liver tumor area, figure 2 (d) is the 3D visualization result of the whole liver area including liver, hepatic vessels and liver tumor.

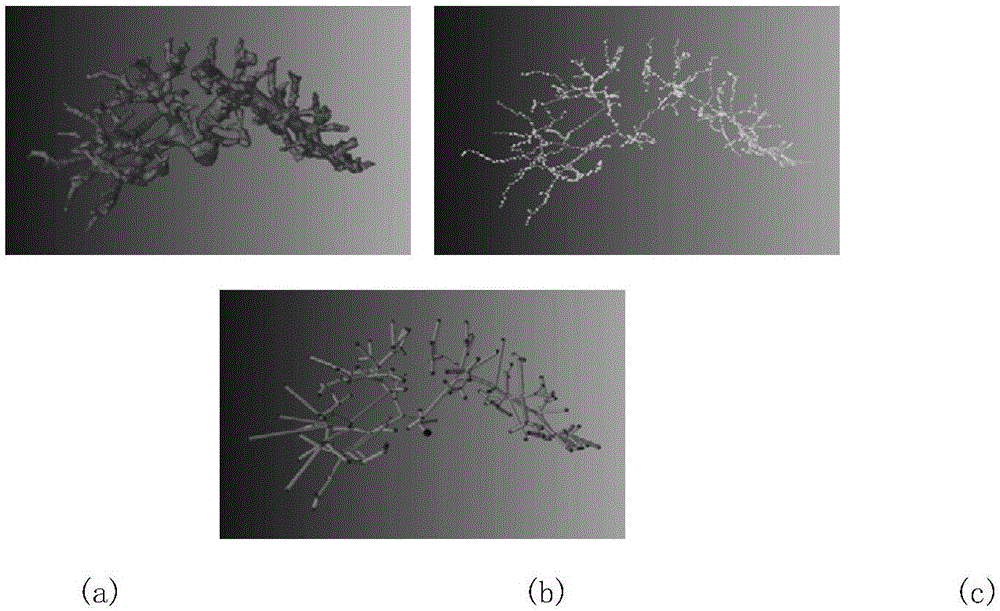
[0045] Extract the hepatic portal vein in this embo...


PUM


Abstract

The invention discloses a liver function region explaining and analysis method including three-dimensional visualized display and attribute measurement. The method comprises steps of: firstly extracting the liver, liver blood vessels and the liver tumor; acquiring a skeleton structure of the hepatic portal vein through a three-dimensional image refining algorithm; generating a directed acyclic graph through topology point extraction and circuit trimming and using the directed acyclic graph to represent the topology structure of the portal vein; recording the attribute information of knots and edges of the graph, i.e., the geometrical attributes of the portal vein; according to the liver Couinaud classification theory, using the directed acyclic graph to divide the liver area into corresponding function segments; and finally, generating a liver explaining and analysis report so as to help a doctor to precisely estimate liver states.

Description

technical field [0001] The invention relates to the field of computer aided medical treatment. Background technique [0002] The analysis of liver functional regions plays a key role in the diagnosis and treatment of liver diseases. CamilleKurtz, Christopher F.Beaulieu, Sandy Napel, Daniel L.Rubin published an article titled A hierarchical knowledge-based approach for retrieving similar medical images described with semantic annotations on the 49th issue of Journal of biomedical informatics in 2014, proposing a structured-based An image analysis method based on vocabulary description. This method uses a pre-defined controlled vocabulary to describe image features, which facilitates the interpretation of medical images of large data sets. However, this method is only used to describe local liver tumor information, and does not Applied to the whole liver system; Ashnil Kumar, Shane Dyer, Changyang Li, PhilipH.W.Leong, Jinman Kim published an article entitled Automatic annotat...

Claims


Application Information

Patent Timeline
Patent Type & Authority Applications(China)
IPC IPC(8): G06T7/00G06T17/00
CPCG06T7/0012G06T17/00G06T2207/20056G06T2207/30096G06T2207/30101
Inventor 陈宇飞岳晓冬柳先辉赵卫东
Owner TONGJI UNIV
Why Eureka
Try Eureka