Seismic signal high resolution processing method based on CEEMD (Complementary Ensemble Empirical Mode Decomposition)
A seismic signal, high-resolution technology, applied in the field of seismic exploration, can solve problems such as incompleteness and increased computing costs
- Summary
- Abstract
- Description
- Claims
- Application Information
AI Technical Summary
Problems solved by technology
Method used
Image
Examples
Embodiment 1
[0104] Embodiment 1: see figure 1 to Figure 5.
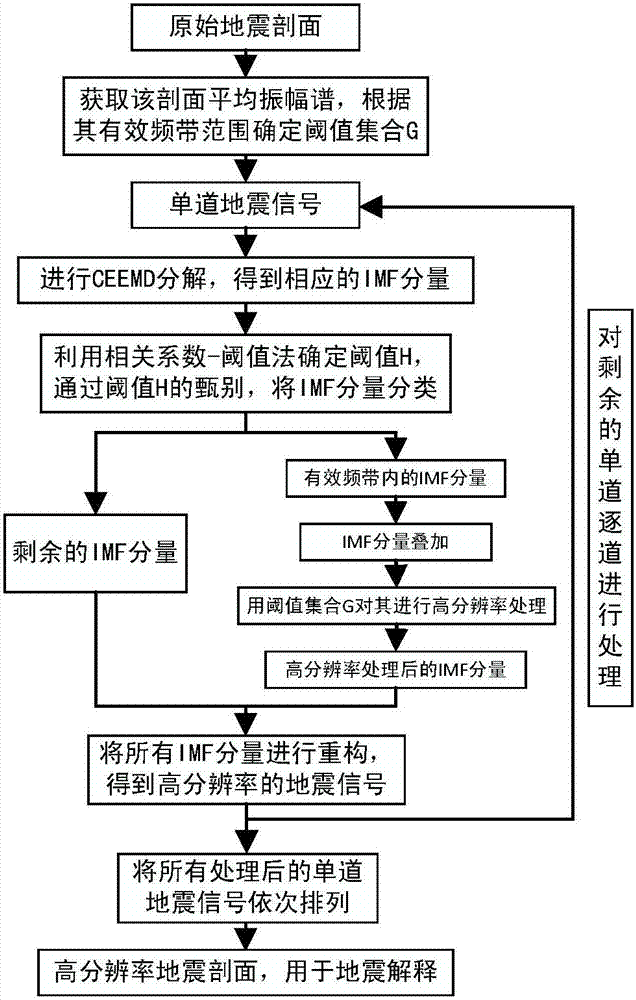
[0105] like figure 1 A high-resolution processing method for seismic signals based on CEEMD is shown, including the following steps:
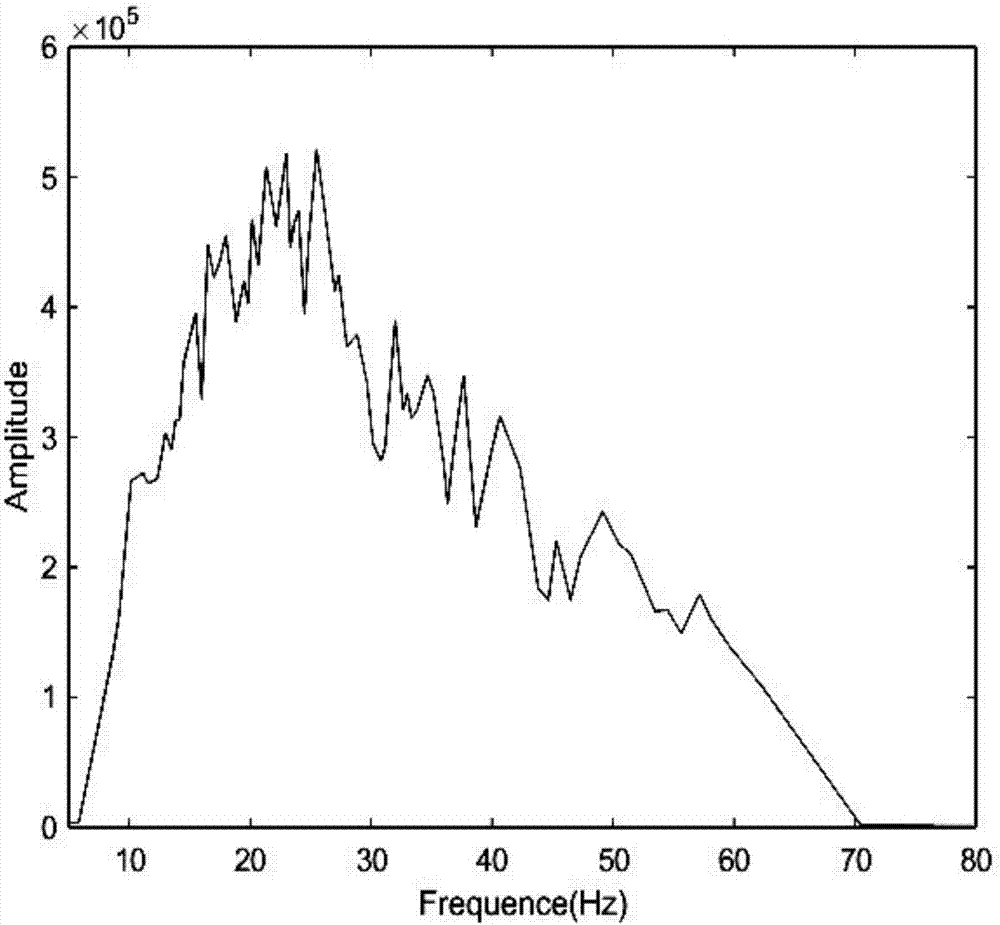
[0106] (1) Obtain the seismic profile, obtain the average amplitude spectrum of the profile, analyze the effective frequency band range of the average amplitude spectrum, determine the thresholds of low pass, low cut, high pass, and high cut according to the frequency band range, and arrange them into a threshold set G, and at the same time The threshold G can be corrected by referring to the amplitude spectrum of several randomly selected single-trace seismic signals, where the seismic section is composed of single-trace seismic signals, and the single-trace seismic signals are time-domain Signal;
[0107] Referring to Fig. 2, actual data 1 is a seismic section with 3001 sampling points, 461 traces, and 2ms sampling time. from Figure 2a It can be seen that the frequency range of the averag...
Embodiment 2
[0154] Embodiment 2: in step (3), according to the feature of IMF component, utilize correlation coefficient-threshold method to determine threshold value H, by the screening of threshold value H, IMF component is divided into IMF component and other IMF components in effective frequency band, method schematic diagram see Figure 5b As shown, the specific method is:
[0155] (31) Calculate the correlation degree Q between each IMF component and the original seismic trace signal, namely
[0156]
[0157] where Q(j) represents the degree of correlation between the jth IMF signal and the original seismic signal,
[0158] (32) Calculate the ρ value by the following formula to obtain the threshold H;
[0159]
[0160] ρ H =max(ρ j ),j=2,3,...M
[0161](33) According to the IMF components decomposed by CEEMD, they meet the characteristics of being arranged in order from high frequency to low frequency, and the position of the threshold H is H=max(ρ j ) corresponding to t...
Embodiment 3
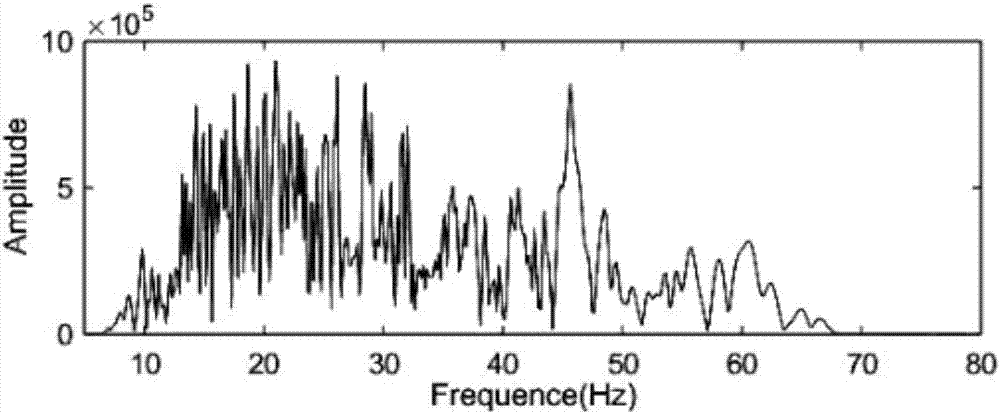
[0164] Embodiment 3: see Figure 6a-6d , Figure 6a 6 is the profile before high-resolution processing of actual data 1, and 6c is the spectrum curve before high-resolution processing in this area. Figure 6b 6d is the high-resolution processing profile of the actual data 1, and 6d is the frequency spectrum graph after high-resolution processing in this area. Through the analysis of the profiles and spectrum curves before and after the processing of the actual data 1, it can be seen that through the technical solution in the embodiment of the present invention, the resolution of the entire profile is significantly improved, and the information that is difficult to directly distinguish in the profile before processing becomes Clear, and distinguish some thin-bed areas, the spectral bandwidth of the seismic section is obviously widened, and the main frequency is significantly increased.
PUM
 Abstract
Description
Claims
Application Information
 - R&D
- Intellectual Property
- Life Sciences
- Materials
- Tech Scout
- Unparalleled Data Quality
- Higher Quality Content
- 60% Fewer Hallucinations
Browse by: Latest US Patents, China's latest patents, Technical Efficacy Thesaurus, Application Domain, Technology Topic, Popular Technical Reports.
© 2025 PatSnap. All rights reserved.Legal|Privacy policy|Modern Slavery Act Transparency Statement|Sitemap|About US| Contact US: help@patsnap.com


