Functional spectrum analyzer

A spectrum analyzer and spectrum analysis technology, applied in the field of electronic measuring instruments, can solve problems such as inability to satisfy scientific researchers, inconvenience in scientific research, and difficulty in updating, and achieve the effects of reducing scientific research costs and improving practicability and portability.

Active Publication Date: 2017-12-08
HENAN INST OF ENG
2 Cites 4 Cited by

AI-Extracted Technical Summary

Problems solved by technology

[0003] With the continuous development of information science, the engineering problems that need to be dealt with are becoming more and more complex, and the requirements for spectrum analysis in signal processing are also getting higher and higher. The diversification of analysis methods is simple and easy to operate. Traditional spectrum analyzers are realizing Various complex functions...

Abstract

The invention discloses a functional spectrum analyzer which includes a computer and a Labview which is embedded to the computer. The computer and the Labview cooperates to generate a virtual front panel, and forms a signal acquisition module, a signal display control module, a signal filtering module, a parameter measurement module and a waveform storage module in combination with related hardware of the computer. The virtual front panel includes a time-based control module front panel, a gain adjusting and translation module front panel, a signal filtering module front panel and a parameter measurement front panel. According to the invention, the functional spectrum analyzer herein realizes signal acquisition and storage, time-domain waveform display and measurement, frequency-domain parameter measurement, signal filtering processing, waveform storage and printing, local signal reading and analyzing, and the like by using PC hardware platform and the Labview virtual instrument platform. The functional spectrum analyzer herein overcomes high cost, large size and poor universality of current spectrum analyzers. Internet connection allows the functional spectrum analyzer to measure and analyze remote signals, which greatly increases the practicality and portability of the spectrum analyzer.

Application Domain

Frequency analysis

Technology Topic

Image

  • Functional spectrum analyzer
  • Functional spectrum analyzer
  • Functional spectrum analyzer

Examples

  • Experimental program(1)

Example Embodiment

[0038] Example: see figure 1 , figure 2 , image 3 , Figure 4 , Figure 5 , Image 6 , Figure 7 , Figure 8 , Figure 9 , Figure 10 , Figure 11 and Figure 12.
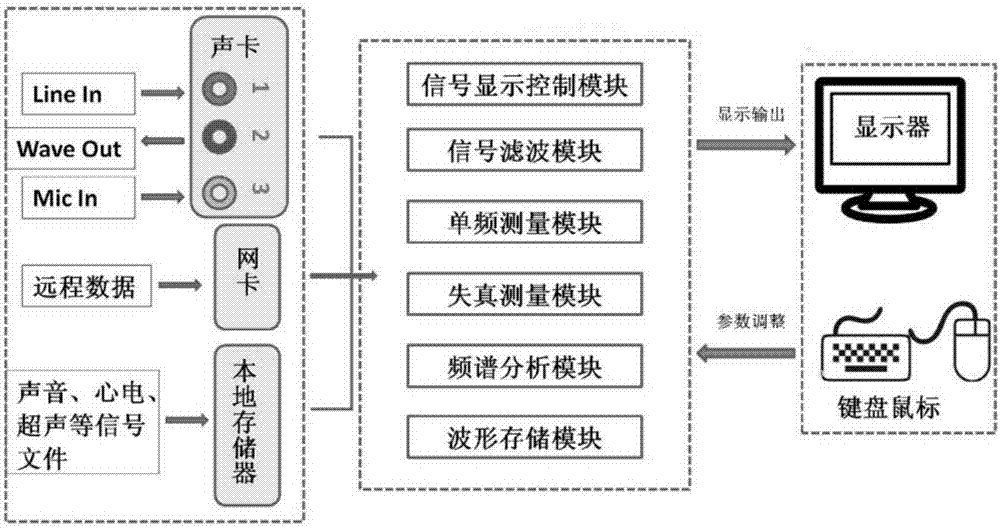
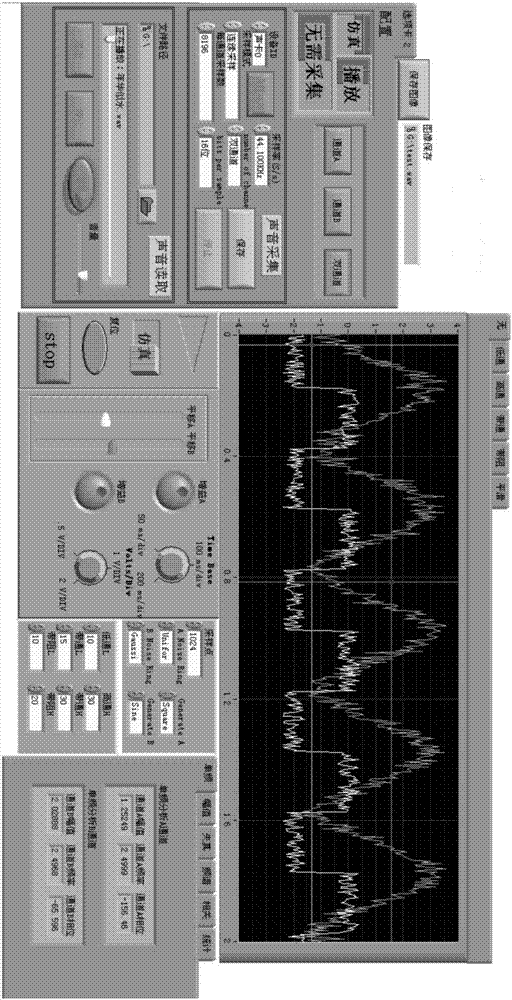
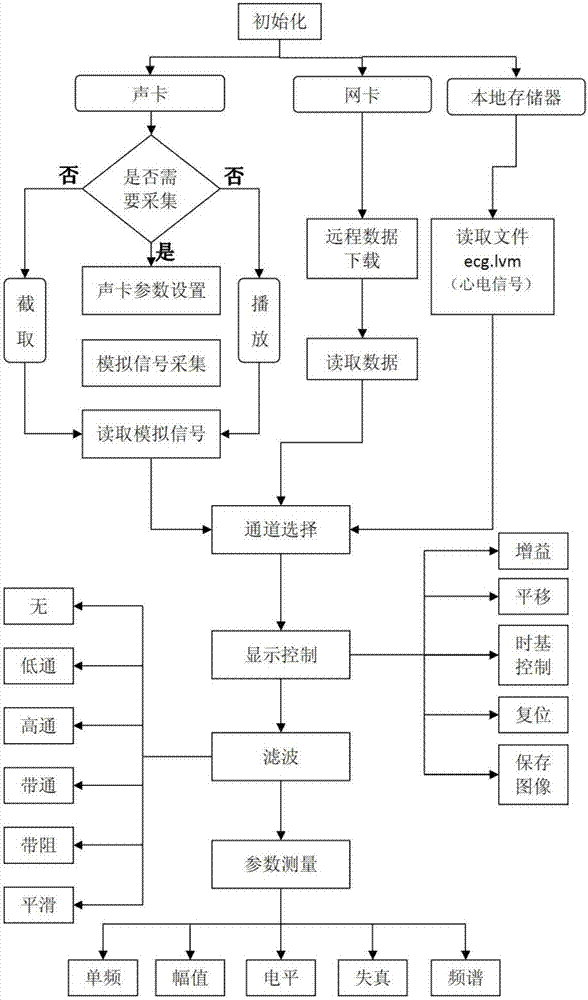
[0039] Multifunctional spectrum analyzer, including computer and Labview embedded in the computer, the computer and Labview cooperate to generate a virtual front panel, and combine with the relevant hardware of the computer to form a signal acquisition module, a signal display control module, a signal filtering module, a parameter measurement module and a waveform storage module The virtual front panel includes the front panel of the time base control module, the front panel of the gain adjustment and translation module, the front panel of the signal filtering module and the front panel of the parameter measurement module.
[0040] The signal acquisition module includes the input and output of signals through the use of the Line In, Wave Out, and Mic In interfaces of the sound card to achieve dual-channel, 16-bit, 32-bit, 64-bit quantization accuracy, and 44KHz sampling frequency. Sound cards that meet the sampling requirements Collect, call the TCP/IP VI module through Labview, realize the network card collection of remote data collection, and realize the local memory collection of information collection by reading the information of the computer memory.
[0041] The Line In interface is a computer interface that can be connected to an analog signal source and realizes the collection of linear analog signals; the WaveOut interface is a linear output port for external power amplifier equipment to realize the output of signals in the audio range; the MicIn interface is to realize AD sampling of audio signals through a microphone computer interface.
[0042] The steps of network card collection are: (1) The server host is in working state, monitoring the communication port, and waiting for the connection request sent by the client; (2) the client computer opens the TCP connection; (3) the server host responds and establishes a data transmission channel; (4) ) The connection process judges the network error, and if there is any, the connection is interrupted; (5) The data transmission is completed by using the VI module TCP read/write; (6) the connection is interrupted after the transmission is completed.
[0043] The signal display control module includes a time base control module that adjusts the time length and voltage value displayed by each scale by setting the time base/div and Volts/div with three gears. Gain adjustment is performed through the gain adjustment control and the translation adjustment control. Gain adjustment and translation block for pan adjustment, reset control block for resetting time base/div and Volts/div.
[0044] The adjustment range of the gain adjustment control is 0.01-10. The control is multiplied by the signal data to make the signal amplitude increase in multiples of the positive part to the positive direction, while the signal amplitude is a multiple of the negative part and increase in the negative direction; pan adjustment The adjustment range of the control is -10—+10. By adding it to the signal data, the overall increase (upward shift) or overall decrease (downward shift) of the signal data amplitude can be obtained.
[0045] time base/div belongs to the time axis adjustment. The three gears set are 0, 1, and 2. The value of 0 is 50ms/div, the value of 1 is 100ms/div, and the value of 2 is 200ms/div. div; Volts/div belongs to the voltage axis adjustment, and the three gears it sets are 0, 1, and 2.
[0046] Among the three gears set by Volts/div, gear 0 means that the voltage axis is from -2V to +2V, the increment is 0.5V, and the starting voltage is -2V; gear 1 means that the voltage axis is from -4V to +4V, and the increment is The volume is 1V, and the starting voltage is -4V; the 2nd gear indicates that the voltage axis is from -8V to +8V, the increment is 2V, and the starting voltage is -8V.
[0047] When reset is set, the oscilloscope data is cleared, the time base and volts/div are both in 0 gear, the gain is 1, that is, the signal is neither amplified nor reduced, the A channel signal is shifted down by 1V, and the B channel signal is shifted up by 1V. The signals of the two channels are staggered for easy observation.
[0048] The signal filtering module includes an infinite impulse response filter with a third-order Butterworth topology: there are seven options buttons on the front panel of the filter, including or not, low-pass, high-pass, band-pass, band-stop, and smooth.
[0049] The parameter measurement module includes finding the single frequency with the highest amplitude, or finding the single frequency with the highest amplitude within the specified range, or finding the frequency and phase of the single frequency single frequency measurement module, realizing the signal-to-noise distortion ratio, total harmonic Wave distortion, fundamental wave level distortion measurement module for measuring three distortion parameters, spectrum analysis module for detection and analysis of the amplitude and phase of the spectrum; the single frequency measurement module, distortion measurement module and spectrum analysis module and the front panel of the parameter measurement module The single frequency button, distortion button and spectrum button on the digital measurement module correspond to each other, and there are also amplitude, correlation and statistics buttons on the front panel of the digital measurement module.
[0050] By calculating the ratio of the signal RMS energy to the signal RMS energy minus the fundamental wave energy, the signal-to-noise-distortion ratio (SINAD) is measured in dB; the RMS total of harmonics and the fundamental frequency amplitude are calculated The total harmonic distortion (THD) measurement can be realized; the fundamental wave level can be measured by measuring the level value when the harmonic order is 1.
[0051] The VI design steps of the spectrum analysis module are as follows:
[0052] (1) Calculate the FFT of the time signal;
[0053] (2) Average the current FFT spectrum of the time signal and the FFT spectrum obtained by the last calculation of VI since the last averaging process reset;
[0054] (3) Returns the magnitude and phase of the average spectrum.
[0055] The waveform storage module includes recording the display data of the signal at any time in the spectrum analysis module, saving and printing related images: using the bmp image storage format, the implementation method is as follows Figure 12 As shown, with a case structure, when the "Save Image" button is pressed, the image of the "spectroscope" node is obtained, and the image data is written into the bmp file to realize the function of saving the bmp image; and then a "file dialog" is added to create a new bmp file selection location, you can change the name of the image to be saved and the path to save the image as needed.
[0056] When in use, the generated signal acquisition module collects information, and controls the front panel through the keyboard and mouse to realize the generated signal display control module, signal filtering module, parameter measurement module and waveform storage module to process the collected information by the signal acquisition module. and stored, and displayed through the computer.

PUM

no PUM

Description & Claims & Application Information

We can also present the details of the Description, Claims and Application information to help users get a comprehensive understanding of the technical details of the patent, such as background art, summary of invention, brief description of drawings, description of embodiments, and other original content. On the other hand, users can also determine the specific scope of protection of the technology through the list of claims; as well as understand the changes in the life cycle of the technology with the presentation of the patent timeline. Login to view more.

Similar technology patents

Auxiliary device for dismounting new energy automobile tire

InactiveCN114670584AImproved portability and usabilityEasy accessWheel mounting apparatusTyre repairingAutomotive engineeringScrew head
Owner:深圳市蓝鲸鱼新能源科技有限公司

Bracelet type acupuncture arrhythmia therapeutic equipment

ActiveCN108310648AReduce arrhythmiaImproved portability and usabilityElectrotherapySensorsAcupuncture pointWrist
Owner:THE FIRST TEACHING HOSPITAL OF XINJIANG MEDICAL UNIVERCITY

Adjustable steel structure supporting member

ActiveCN110670903ASmall footprintImproved portability and usabilityShoresMechanical engineeringClassical mechanics
Owner:江苏双鹏钢结构工程有限公司

Classification and recommendation of technical efficacy words

  • Improved portability and usability
  • Reduce research costs

Coupling system

InactiveUS20070205344A1Easily attached and removedImproved portability and usabilityCandle holdersAnimal huntingCoupling systemEngineering
Owner:LIERMANN TRAVIS K +3

Remote-controlled opening and closing device, system and method

InactiveCN109995142AOpening and closing operation safetyImproved portability and usabilityCircuit arrangementsInformation technology support systemControl circuitOutput device
Owner:四川华宇电力有限公司

Adjustable steel structure supporting member

ActiveCN110670903ASmall footprintImproved portability and usabilityShoresMechanical engineeringClassical mechanics
Owner:江苏双鹏钢结构工程有限公司

Method for simultaneously measuring saturated particle medium stress and displacement based on transparent photoelastic material

ActiveCN108106973AUnderstand the inner mechanism of mechanical behaviorReduce research costsMethod using image detector and image signal processingComputational physicsRefraction coefficient
Owner:DALIAN UNIV OF TECH

Method for predicting height of urban atmospheric mixed layer

InactiveCN102175216AReduce research costsImprove research efficiencyHeight/levelling measurementMultivariable linear regressionDew point
Owner:CENT SOUTH UNIV

Data acquisition method and device of vehicle-mounted terminal

InactiveCN110908363AEasy data collectionReduce research costsProgramme controlElectric testing/monitoringEmbedded systemIn vehicle
Owner:GUANGZHOU XIAOPENG MOTORS TECH CO LTD

A multi-bus interface system of an airborne transponder

InactiveCN109726155AReduce research costsAvoid duplication of developmentElectric digital data processingEmbedded systemBus interface
Owner:四川九洲空管科技有限责任公司
Why Eureka
Try Eureka