Music continuous emotion feature analysis evaluation method based on Gamma distribution analysis
A technology of emotional features and music features, which is applied in the field of music continuous emotional feature analysis and evaluation, can solve problems such as inaccurate music selection or recommendation, and inability to make real-time music recommendations, so as to reduce the number of features, reduce overfitting, and improve model accuracy degree of effect
- Summary
- Abstract
- Description
- Claims
- Application Information
AI Technical Summary
Problems solved by technology
Method used
Image
Examples
Embodiment 1
[0061] A kind of music continuous emotion feature analysis and evaluation method based on Gamma distribution analysis The specific steps are as follows:
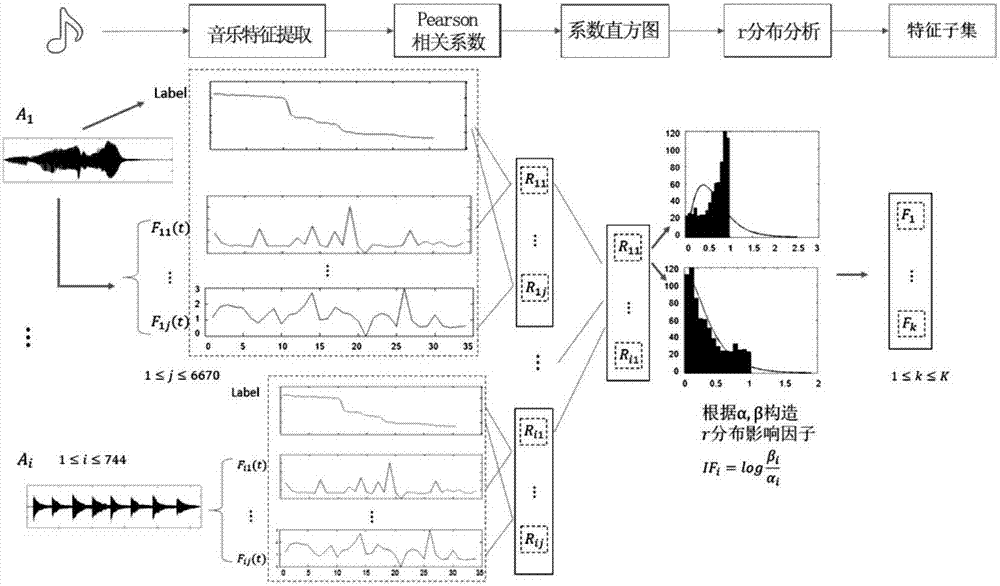
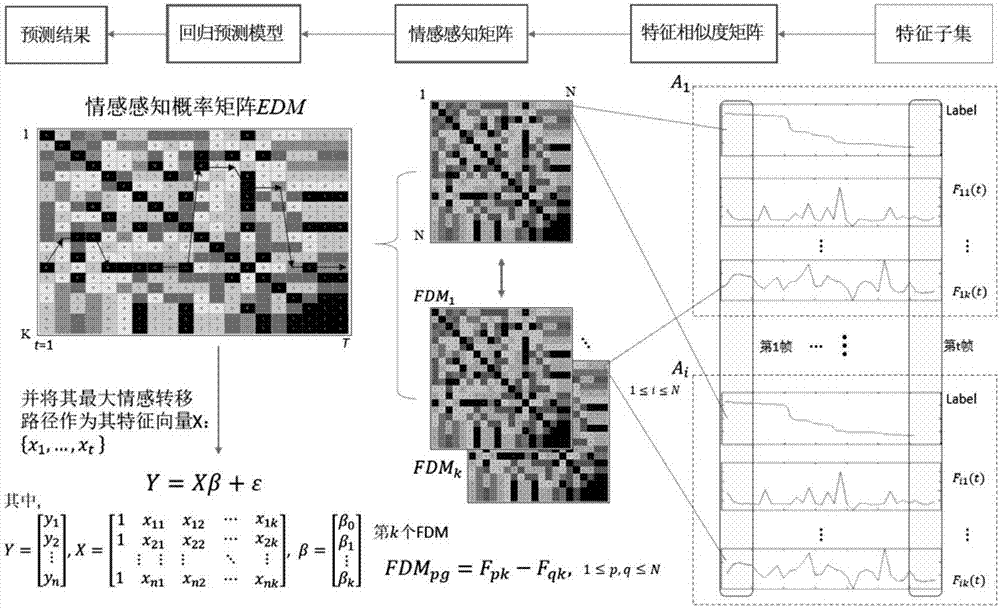
[0062] Step 1: Calculate the correlation between music features and emotional labels; set the music signal as A i , 1≤i≤N, N is the number of samples, the emotional label of Valence and Arousal in the process of the user listening to music is L, and the sampling rate is 2Hz,
[0063] (4) In order to preserve the time information, the music signal is firstly windowed and divided into frames. The length of the music emotion analysis takes the window length w as 4 seconds, and the frame shift as 0.5 seconds.
[0064] (5) Secondly, audio feature extraction, feature F ij , 1≤j≤M, M is the feature dimension, including low-level features, pitch and loudness, and high-level semantic features, melody and rhythm;
[0065] (6) Calculate each dimension feature F ij , 1≤j≤M and the Pearson correlation coefficient of scoring L, the Pea...
Embodiment 2
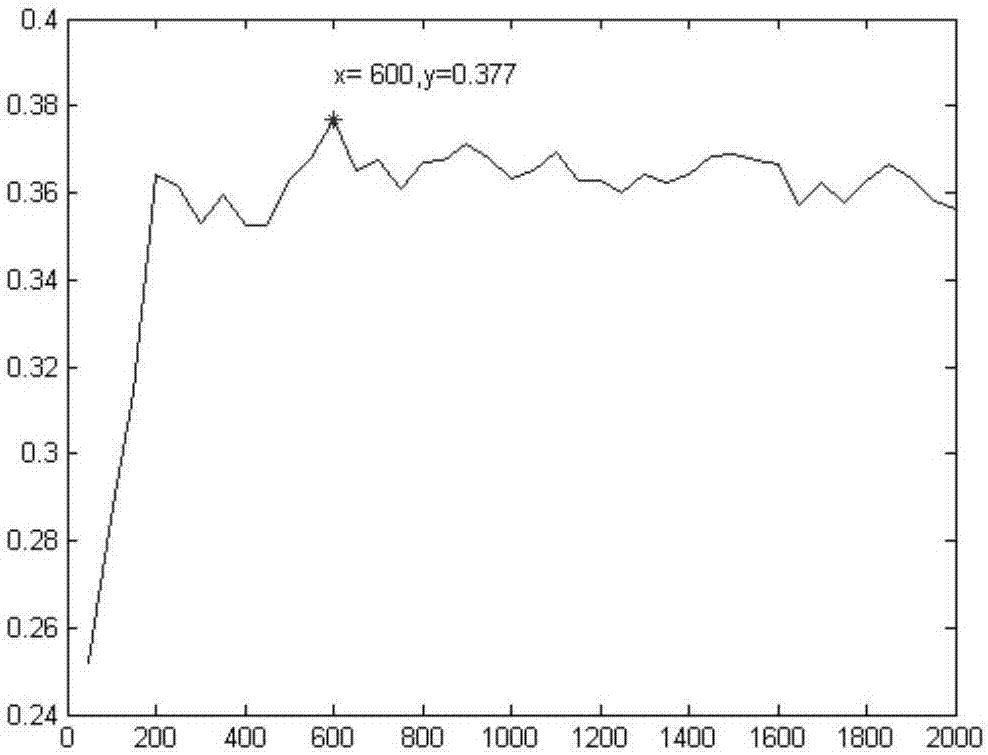
[0104] In order to verify the recognition effect of the optimal feature set extracted by the music continuous emotion feature evaluation method based on Gamma distribution analysis, we tested the method on the MediaEval 2013 public music emotion dataset and compared it with other methods. The dataset contains 744 music clips with a length of 45 seconds and continuous emotion annotations for these music clips. The method that the present invention proposes is to the average fitting coefficient of different feature numbers, the calculated result is as follows table 1.
[0105] Table 1 Fitting coefficient table under different K values (number of features)
[0106] Trials
K value
rSquare
1
2
0.17
2
100
0.28
3
200
0.35
4
600
0.38
[0107] In order to obtain the best fitting coefficient, we calculate the fitting coefficient every 50, the result is as follows image 3 shown. When taking the first 600-dimensio...
PUM
 Abstract
Description
Claims
Application Information
 - R&D
- Intellectual Property
- Life Sciences
- Materials
- Tech Scout
- Unparalleled Data Quality
- Higher Quality Content
- 60% Fewer Hallucinations
Browse by: Latest US Patents, China's latest patents, Technical Efficacy Thesaurus, Application Domain, Technology Topic, Popular Technical Reports.
© 2025 PatSnap. All rights reserved.Legal|Privacy policy|Modern Slavery Act Transparency Statement|Sitemap|About US| Contact US: help@patsnap.com


